Public transit gains and spatially uneven travel demand changes after NYC congestion pricing
Pith reviewed 2026-06-26 22:17 UTC · model grok-4.3
The pith
New York City's congestion pricing raised bus and subway ridership above expected levels while modestly lowering overall travel demand, with changes varying across neighborhoods.
A machine-rendered reading of the paper's core claim, the machinery that carries it, and where it could break.
Core claim
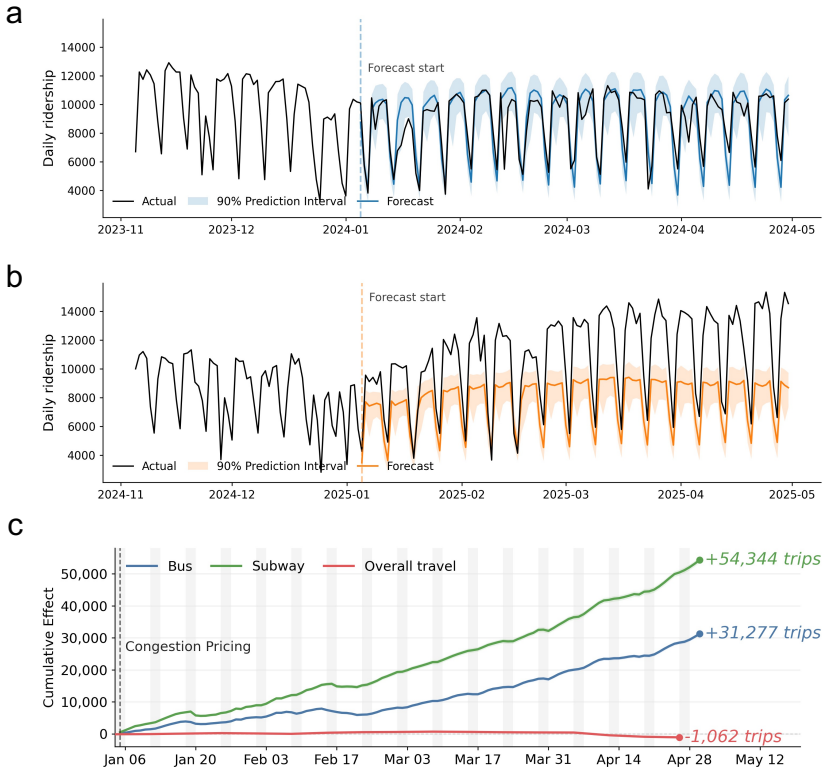
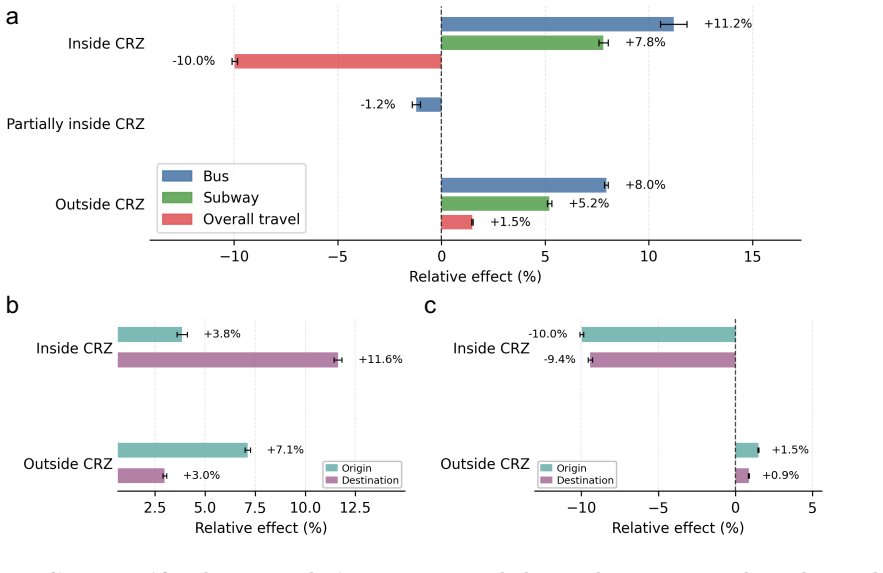
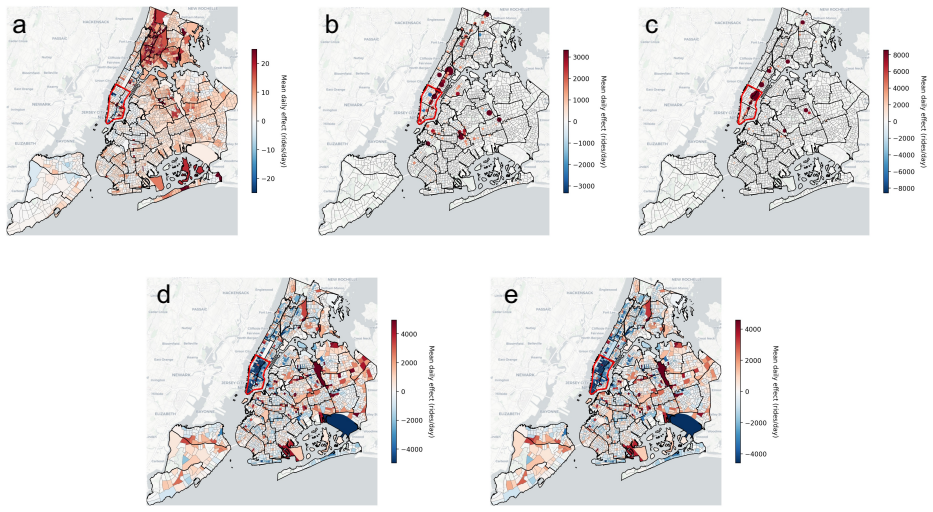
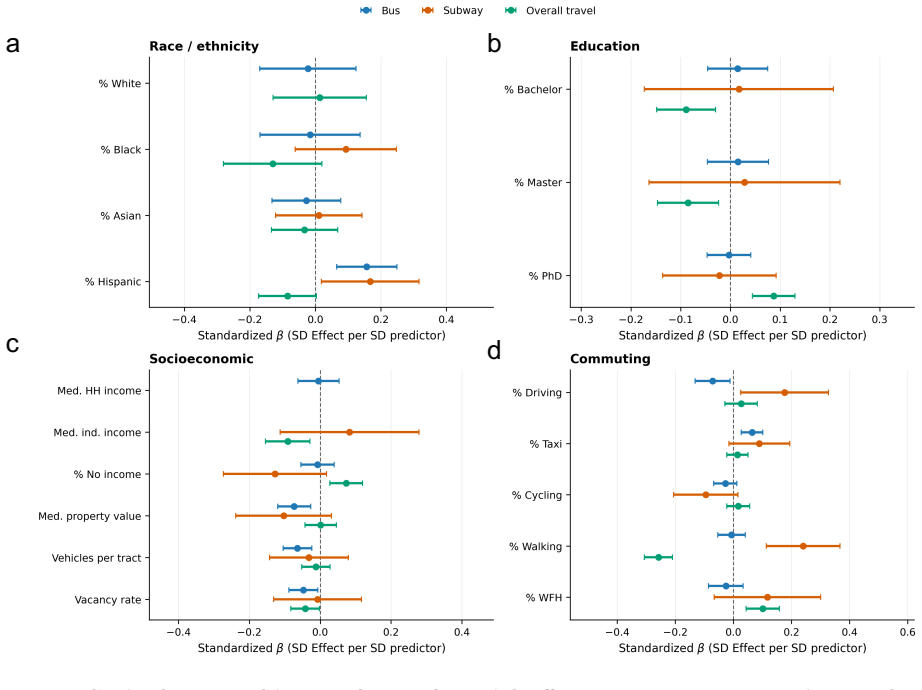
Post-policy bus and subway ridership increased significantly relative to expected no-policy demand, while overall travel demand decreased modestly. Reductions in aggregate travel concentrated inside the Congestion Relief Zone, yet transit gains extended beyond Manhattan's core. Neighborhood-level socio-demographic breakdowns show uneven adaptation across areas.
What carries the argument
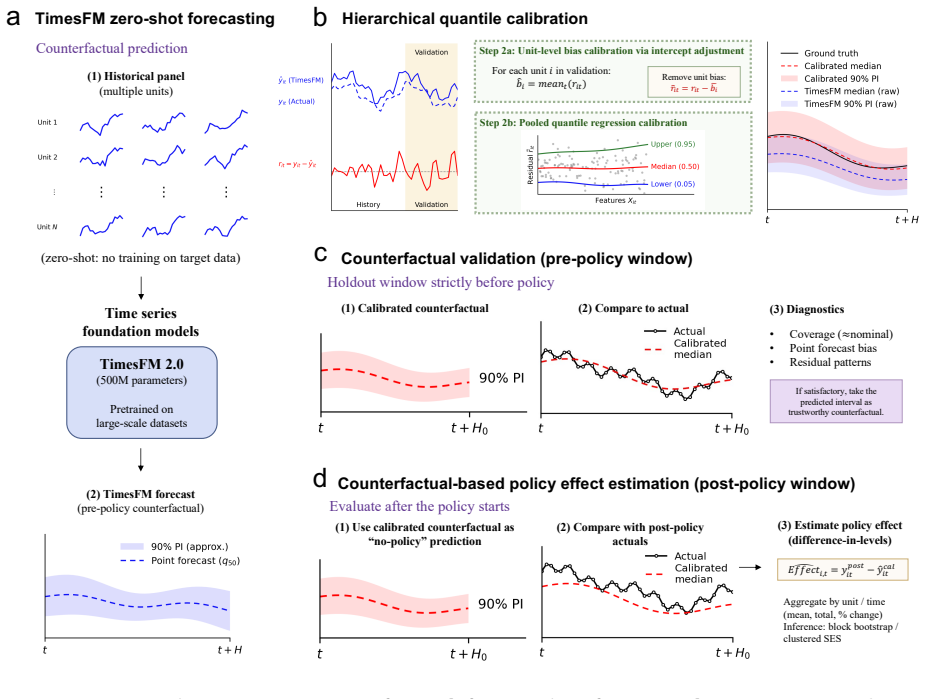
Time series foundation models that generate probabilistic counterfactual demand forecasts with calibrated uncertainty to stand in for the no-policy scenario.
If this is right
- Transit ridership gains occur even outside the priced zone.
- Overall travel demand reductions remain localized to the congestion relief area.
- Socio-demographic differences across neighborhoods shape how much each area adapts.
- The method supports evaluation of system-wide interventions without needing clean control groups.
Where Pith is reading between the lines
- The same forecasting approach could be applied to congestion pricing or other pricing schemes in additional cities to check consistency of mode shifts.
- Tracking the same metrics over multiple years would reveal whether initial transit gains persist or fade.
- Linking the spatial patterns to emissions or accessibility data could quantify secondary environmental or equity outcomes not measured here.
Load-bearing premise
The time series foundation models accurately generate probabilistic counterfactual demand forecasts with calibrated uncertainty that represent the no-policy scenario.
What would settle it
If observed post-policy bus, subway, and total trip volumes fall inside the models' no-policy forecast uncertainty bands, the claimed ridership gains and demand reductions would not be supported.
Figures
read the original abstract
New York City implemented the nation's first cordon-based congestion pricing program in January 2025, providing an opportunity to evaluate how system-wide urban mobility responds to large-scale pricing interventions. Because such policies generate spillovers across modes and locations, credible control groups are difficult to construct. We address this challenge using time series foundation models to generate probabilistic counterfactual demand forecasts with calibrated uncertainty. Applying this framework to bus, subway, and aggregate trip volume data, we find that post-policy bus and subway ridership increased significantly relative to expected no-policy demand, while overall travel demand decreased modestly. The effects are spatially heterogeneous: while reductions in overall travel demand are concentrated within the Congestion Relief Zone, transit gains extend beyond Manhattan's core. Socio-demographic analyses further reveal uneven adaptation across neighborhoods, highlighting spatial equity implications. Our framework provides a scalable approach for the uncertainty-aware evaluation of system-wide urban interventions when clean control groups are unavailable.
Editorial analysis
A structured set of objections, weighed in public.
Referee Report
Summary. The manuscript evaluates the effects of New York City's January 2025 cordon-based congestion pricing using time series foundation models to generate probabilistic counterfactual demand forecasts. It reports that bus and subway ridership increased significantly relative to no-policy expectations, overall travel demand declined modestly, effects are spatially heterogeneous (with transit gains extending beyond the core and demand reductions concentrated in the Congestion Relief Zone), and socio-demographic analyses show uneven neighborhood adaptation, highlighting equity implications. The framework is presented as a scalable approach for uncertainty-aware policy evaluation without clean control groups.
Significance. If the counterfactual forecasts prove reliable, the work provides empirical evidence on modal shifts and spatial equity under congestion pricing, along with a method for system-wide intervention evaluation in settings lacking controls. The emphasis on calibrated uncertainty and foundation models for counterfactuals could strengthen causal inference in urban mobility studies if validation is demonstrated.
major comments (3)
- [Methods] Methods section: No quantitative validation is reported for the time series foundation models, such as empirical coverage rates, calibration plots, or performance on pre-policy rolling-origin hold-out forecasts; without this, it is impossible to assess whether the probabilistic counterfactuals reliably represent the no-policy scenario or whether unmodeled trends are absorbed into the estimated treatment effects.
- [Results] Results section (and abstract): The headline claims of significant transit ridership gains and modest aggregate demand reduction are identified exclusively via comparison of observed post-January 2025 series to the foundation-model counterfactuals; absent evidence that the models achieve nominal coverage or robustness to alternative backbones on hold-out data, the treatment-effect estimates rest on an untested assumption.
- [Socio-demographic analyses] Socio-demographic analyses subsection: The reported spatial heterogeneity and equity implications depend on the same counterfactual framework; any bias in the no-policy forecasts would propagate directly into the neighborhood-level adaptation findings, yet no sensitivity checks or alternative model specifications are described.
minor comments (2)
- [Abstract] Abstract: The high-level description of findings would benefit from at least one quantitative effect size or confidence interval to convey the magnitude of the reported changes.
- [Methods] Notation: The term 'calibrated uncertainty' is used without a precise definition or reference to the specific calibration procedure employed by the foundation models.
Simulated Author's Rebuttal
We thank the referee for their constructive comments on our manuscript. We address each major comment point by point below and describe the revisions we will make to strengthen the paper.
read point-by-point responses
-
Referee: [Methods] Methods section: No quantitative validation is reported for the time series foundation models, such as empirical coverage rates, calibration plots, or performance on pre-policy rolling-origin hold-out forecasts; without this, it is impossible to assess whether the probabilistic counterfactuals reliably represent the no-policy scenario or whether unmodeled trends are absorbed into the estimated treatment effects.
Authors: We agree that quantitative validation of the foundation models on pre-policy data is essential for assessing counterfactual reliability. The original manuscript emphasized the policy application rather than model diagnostics. In the revised version, we will add a new Methods subsection reporting empirical coverage rates (targeting nominal 95% intervals), calibration plots, and performance metrics on rolling-origin hold-out forecasts using data through December 2024. This will directly address whether unmodeled trends are absorbed into treatment effects. revision: yes
-
Referee: [Results] Results section (and abstract): The headline claims of significant transit ridership gains and modest aggregate demand reduction are identified exclusively via comparison of observed post-January 2025 series to the foundation-model counterfactuals; absent evidence that the models achieve nominal coverage or robustness to alternative backbones on hold-out data, the treatment-effect estimates rest on an untested assumption.
Authors: The results and abstract claims are indeed derived from the counterfactual comparisons. With the addition of the validation metrics described in response to the Methods comment, the treatment-effect estimates will be supported by demonstrated model performance on hold-out data. We will revise the Results section to explicitly reference these validation results when presenting the ridership gains and demand reductions, and we will ensure the abstract accurately reflects the validated framework. revision: yes
-
Referee: [Socio-demographic analyses] Socio-demographic analyses subsection: The reported spatial heterogeneity and equity implications depend on the same counterfactual framework; any bias in the no-policy forecasts would propagate directly into the neighborhood-level adaptation findings, yet no sensitivity checks or alternative model specifications are described.
Authors: We concur that the spatial heterogeneity and equity findings rely on the counterfactuals, creating potential for bias propagation. In the revised manuscript, we will add sensitivity analyses in the socio-demographic subsection, including results from alternative foundation model backbones and specifications. These checks will be presented to demonstrate robustness of the neighborhood-level adaptation patterns. revision: yes
Circularity Check
No circularity: counterfactual forecasts are generated from pre-policy trained models and compared externally to post-policy observations
full rationale
The paper's core identification strategy relies on time-series foundation models trained on historical data to produce probabilistic forecasts of no-policy demand after the January 2025 policy. Observed post-policy series are then compared against these forecasts. This structure does not reduce the estimated treatment effects to fitted quantities by construction, nor does it invoke self-citations, uniqueness theorems, or ansatzes that collapse the result into the inputs. No equations or method descriptions in the provided text exhibit self-definitional, fitted-input-renamed-as-prediction, or self-citation load-bearing patterns. The derivation chain remains self-contained against external benchmarks.
Axiom & Free-Parameter Ledger
Reference graph
Works this paper leans on
-
[1]
W. S. Vickrey, Congestion theory and transport investment, The American economic review 59 (2) (1969) 251–260
1969
-
[3]
URLhttps://congestionreliefzone.mta.info/
Metropolitan Transportation Authority, Congestion relief zone – Central Business District Tolling Program, accessed: 2025-06-11 (2025). URLhttps://congestionreliefzone.mta.info/
2025
-
[4]
URLhttps://cicbca.org/202412-fhwa-approves-congestion-pricing-toll-to-fund-1 5b-in-mta-capital-projects/
Construction Industry Council of Westchester & Hudson Valley, Fhwa approves congestion pricing toll to fund $15b in mta capital projects, accessed: 2025-06-11 (2024). URLhttps://cicbca.org/202412-fhwa-approves-congestion-pricing-toll-to-fund-1 5b-in-mta-capital-projects/
2025
-
[7]
Eliasson, L
J. Eliasson, L. Hultkrantz, L. Nerhagen, L. S. Rosqvist, The stockholm congestion–charging trial 2006: Overview of effects, Transportation Research Part A: Policy and Practice 43 (3) (2009) 240–250
2006
-
[8]
Schwach, Congestion pricing brings fewer cars and more subway riders, data shows, accessed June 11, 2025.arXiv:QueensDailyEagle
R. Schwach, Congestion pricing brings fewer cars and more subway riders, data shows, accessed June 11, 2025.arXiv:QueensDailyEagle. URLhttps://queenseagle.com/all/2025/1/15/congestion-pricing-brings-fewer-car s-and-more-subway-riders-data-shows 18
2025
-
[10]
Ziedan, C
A. Ziedan, C. Brakewood, K. Watkins, Will transit recover? a retrospective study of nationwide ridership in the united states during the covid-19 pandemic, Journal of public transportation 25 (2023) 100046
2023
-
[11]
P. Jing, R. Seshadri, T. Sakai, A. Shamshiripour, A. R. Alho, A. Lentzakis, M. E. Ben-Akiva, Evaluatingcongestionpricingschemesusingagent-basedpassengerandfreightmicrosimulation, Transportation Research Part A: Policy and Practice 186 (2024) 104118
2024
-
[26]
URLhttps://www.mta.info/press-release/icymi-six-months-governor-hochul-highl ights-success-of-congestion-pricing-traffic
MTA, Icymi: Six months in, governor hochul highlights success of congestion pricing: Traffic is down, business is up, and critical investments are being made to improve transit (2025). URLhttps://www.mta.info/press-release/icymi-six-months-governor-hochul-highl ights-success-of-congestion-pricing-traffic
2025
-
[27]
D.Li, Y.Zheng, S.Wang, X.Guo, J.Zhao, Quantifyingthenonlinearcausalimpactofcommute time on us remote work, Transportation Research Part D: Transport and Environment 151 (2026) 105153
2026
-
[29]
A. E. Raftery, T. Gneiting, F. Balabdaoui, M. Polakowski, Using Bayesian model averaging to calibrate forecast ensembles, Monthly Weather Review 133 (5) (2005) 1155–1174.doi: 10.1175/MWR2906.1
-
[30]
S. Siegert, P. G. Sansom, R. M. Williams, Parameter uncertainty in forecast recalibration, Quarterly Journal of the Royal Meteorological Society 142 (696) (2016) 1213–1221.doi: 10.1002/qj.2716
-
[31]
T. Gneiting, A. E. Raftery, A. H. Westveld, T. Goldman, Calibrated probabilistic forecasting using ensemble model output statistics and minimum CRPS estimation, Monthly Weather Review 133 (5) (2005) 1098–1118.doi:10.1175/MWR2904.1
-
[32]
32, 2019, pp
Y.Romano, E.Patterson, E.Candès, Conformalizedquantileregression, in: AdvancesinNeural Information Processing Systems, Vol. 32, 2019, pp. 3538–3548
2019
-
[33]
Gibbs, E
I. Gibbs, E. Candès, Adaptive conformal inference under distribution shift, Advances in Neural Information Processing Systems 34 (2021) 1660–1672
2021
-
[34]
M. Chen, L. Shen, H. Fu, Z. Li, J. Sun, C. Liu, Calibration of time-series forecasting: Detecting and adapting context-driven distribution shift, arXiv preprint arXiv:2310.14838 (2023)
arXiv 2023
-
[35]
X. Jiang, D. Zhuang, X. Zhang, H. Chen, J. Luo, X. Gao, Uncertainty quantification via spatial-temporal Tweedie model for zero-inflated and long-tail travel demand prediction, in: 20 Proceedings of the 32nd ACM International Conference on Information and Knowledge Man- agement, 2023, pp. 3983–3987.doi:10.1145/3583780.3615215
- [36]
-
[37]
Salinas, V
D. Salinas, V. Flunkert, J. Gasthaus, T. Januschowski, Deepar: Probabilistic forecasting with autoregressive recurrent networks, International journal of forecasting 36 (3) (2020) 1181–1191
2020
-
[38]
P. Montero-Manso, R. J. Hyndman, Principles and algorithms for forecasting groups of time series: Locality and globality, International Journal of Forecasting 37 (4) (2021) 1632–1653. doi:10.1016/j.ijforecast.2021.03.004
-
[39]
H. Hewamalage, C. Bergmeir, K. Bandara, Global models for time series forecasting: A simu- lation study, Pattern Recognition 124 (2022) 108441.doi:10.1016/j.patcog.2021.108441
-
[40]
G. E. Box, G. M. Jenkins, G. C. Reinsel, G. M. Ljung, Time series analysis: forecasting and control, John Wiley & Sons, 2015
2015
-
[41]
S. J. Taylor, B. Letham, Forecasting at scale, The American Statistician 72 (1) (2018) 37–45. Acknowledgements This research is supported by the National Research Foundation (NRF), Prime Minister’s Office, Singapore under its Campus for Research Excellence and Technological Enterprise (CREATE) pro- gramme. The Mens, Manus, and Machina (M3S) is an interdis...
2018
-
[42]
R.Lindsney*, E.Verhoef*, Trafficcongestionandcongestionpricing, in: Handbookoftransport systems and traffic control, Emerald Group Publishing Limited, 2001, pp. 77–105
2001
-
[43]
K. A. Small, Urban transportation economics, Routledge, 2013
2013
-
[44]
J.Eliasson, etal., TheStockholmcongestioncharges: anoverview, CentreforTransportStudies Stockholm, Sweden, 2014
2014
-
[45]
Z. Li, D. A. Hensher, J. M. Rose, Willingness to pay for travel time reliability in passenger transport: A review and some new empirical evidence, Transportation research part E: logistics and transportation review 46 (3) (2010) 384–403
2010
-
[46]
Lehe, Downtown congestion pricing in practice, Transportation Research Part C: Emerging Technologies 100 (2019) 200–223
L. Lehe, Downtown congestion pricing in practice, Transportation Research Part C: Emerging Technologies 100 (2019) 200–223
2019
-
[47]
Agarwal, K
S. Agarwal, K. M. Koo, Impact of electronic road pricing (erp) changes on transport modal choice, Regional Science and Urban Economics 60 (2016) 1–11
2016
-
[48]
rep., Transport for London, London, UK, sixth Annual Report, July 2008 (Jul
Transport for London, Central london congestion charging: Impacts monitoring—sixth annual report, Tech. rep., Transport for London, London, UK, sixth Annual Report, July 2008 (Jul. 2008). URLsandbox:/mnt/data/central-london-congestion-charging-impacts-monitoring-s ixth-annual-report.pdf
2008
-
[49]
C. P. Green, J. S. Heywood, M. Navarro, Traffic accidents and the london congestion charge, Journal of public economics 133 (2016) 11–22
2016
-
[50]
Börjesson, J
M. Börjesson, J. Eliasson, M. B. Hugosson, K. Brundell-Freij, The stockholm congestion charges—5 years on. effects, acceptability and lessons learnt, Transport Policy 20 (2012) 1– 12
2012
-
[51]
Börjesson, Long-term effects of the swedish congestion charges, International Transport Forum Discussion Paper, 2018
M. Börjesson, Long-term effects of the swedish congestion charges, International Transport Forum Discussion Paper, 2018
2018
-
[52]
Gibson, M
M. Gibson, M. Carnovale, The effects of road pricing on driver behavior and air pollution, Journal of Urban Economics 89 (2015) 62–73
2015
-
[53]
Börjesson, I
M. Börjesson, I. Kristoffersson, The gothenburg congestion charge. effects, design and politics, Transportation Research Part A: Policy and Practice 75 (2015) 134–146
2015
-
[54]
URLhttps://congestionreliefzone.mta.info/ S33
Metropolitan Transportation Authority, Congestion relief zone – Central Business District Tolling Program, accessed: 2025-06-11 (2025). URLhttps://congestionreliefzone.mta.info/ S33
2025
-
[55]
C. Cook, A. Kreidieh, S. Vasserman, H. Allcott, N. Arora, F. van Sambeek, A. Tomkins, E. Turkel, The short-run effects of congestion pricing in new york city, Tech. rep., National Bureau of Economic Research (2025)
2025
-
[56]
Metropolitan Transportation Authority, Icymi: Six months in, governor hochul highlights suc- cess of congestion pricing: Traffic is down, business is up, and critical investments are being made to improve transit, press release (Jul. 2025). URLhttps://www.mta.info/press-release/icymi-six-months-governor-hochul-highl ights-success-of-congestion-pricing-traffic
2025
-
[57]
Eliasson, Lessons from the stockholm congestion charging trial, Transport Policy 15 (6) (2008) 395–404
J. Eliasson, Lessons from the stockholm congestion charging trial, Transport Policy 15 (6) (2008) 395–404
2008
-
[58]
Gallego, J.-P
F. Gallego, J.-P. Montero, C. Salas, The effect of transport policies on car use: Evidence from latin american cities, Journal of Public Economics 107 (2013) 47–62
2013
-
[59]
Eliasson, Congestion pricing, in: The Routledge Handbook of Transport Economics, Rout- ledge, 2017, pp
J. Eliasson, Congestion pricing, in: The Routledge Handbook of Transport Economics, Rout- ledge, 2017, pp. 209–226
2017
-
[60]
Baghestani, M
A. Baghestani, M. Tayarani, M. Allahviranloo, H. O. Gao, Evaluating the traffic and emissions impacts of congestion pricing in new york city, Sustainability 12 (9) (2020) 3655
2020
-
[61]
Morton, Y
C. Morton, Y. Ali, The impact of congestion charging on car ownership: Evidence from a quasi-natural experiment, Transport Policy 160 (2025) 181–191
2025
-
[62]
Athey, G
S. Athey, G. W. Imbens, Design-based analysis in difference-in-differences settings with stag- gered adoption, Journal of Econometrics 226 (1) (2022) 62–79
2022
-
[63]
Callaway, P
B. Callaway, P. H. Sant’Anna, Difference-in-differences with multiple time periods, Journal of econometrics 225 (2) (2021) 200–230
2021
-
[64]
J. D. Angrist, J.-S. Pischke, Mostly harmless econometrics: An empiricist’s companion, Prince- ton university press, 2009
2009
-
[65]
D. S. Lee, T. Lemieux, Regression discontinuity designs in economics, Journal of economic literature 48 (2) (2010) 281–355
2010
-
[66]
Duranton, M
G. Duranton, M. A. Turner, Urban form and driving: Evidence from us cities, Journal of Urban Economics 108 (2018) 170–191
2018
-
[67]
Abadie, A
A. Abadie, A. Diamond, J. Hainmueller, Synthetic control methods for comparative case stud- ies: Estimating the effect of california’s tobacco control program, Journal of the American statistical Association 105 (490) (2010) 493–505
2010
-
[68]
J. M. Wooldridge, Econometric analysis of cross section and panel data, MIT press, 2010. S34
2010
-
[69]
Arkhangelsky, S
D. Arkhangelsky, S. Athey, D. A. Hirshberg, G. W. Imbens, S. Wager, Synthetic difference-in- differences, American Economic Review 111 (12) (2021) 4088–4118
2021
-
[70]
Doudchenko, G
N. Doudchenko, G. W. Imbens, Balancing, regression, difference-in-differences and synthetic control methods: A synthesis, Tech. rep., National Bureau of Economic Research (2016)
2016
-
[71]
K. H. Brodersen, F. Gallusser, J. Koehler, N. Remy, S. L. Scott, Inferring causal impact using bayesian structural time-series models (2015)
2015
-
[72]
Schulam, S
P. Schulam, S. Saria, Reliable decision support using counterfactual models, Advances in neural information processing systems 30 (2017)
2017
-
[73]
J. Hill, A. Linero, J. Murray, Bayesian additive regression trees: A review and look forward, Annual Review of Statistics and Its Application 7 (1) (2020) 251–278
2020
-
[74]
Cerqua, M
A. Cerqua, M. Letta, F. Menchetti, et al., Causal inference and policy evaluation without a control group (2024)
2024
-
[75]
I. Bica, A. M. Alaa, J. Jordon, M. van der Schaar, Estimating counterfactual treatment out- comes over time through adversarially balanced representations, in: International Conference on Learning Representations
-
[76]
D. Cao, J. Enouen, Y. Wang, X. Song, C. Meng, H. Niu, Y. Liu, Estimating treatment effects from irregular time series observations with hidden confounders, in: Proceedings of the AAAI Conference on Artificial Intelligence, Vol. 37, 2023, pp. 6897–6905
2023
-
[77]
A. Alaa, M. Schaar, Limits of estimating heterogeneous treatment effects: Guidelines for prac- tical algorithm design, in: International Conference on Machine Learning, PMLR, 2018, pp. 129–138
2018
-
[78]
Y. Han, J. C. Lam, V. O. Li, J. Crowcroft, Interpretable ai-driven causal inference to uncover the time-varying effects of pm2. 5 and public health interventions on covid-19 infection rates, Humanities and Social Sciences Communications 11 (1) (2024) 1–17
2024
-
[79]
Rothfuss, V
J. Rothfuss, V. Fortuin, M. Josifoski, A. Krause, Pacoh: Bayes-optimal meta-learning with pac-guarantees, in: International Conference on Machine Learning, PMLR, 2021, pp. 9116– 9126
2021
-
[80]
A. F. Ansari, L. Stella, C. Turkmen, X. Zhang, P. Mercado, H. Shen, O. Shchur, S. S. Ranga- puram, S. P. Arango, S. Kapoor, et al., Chronos: Learning the language of time series, arXiv preprint arXiv:2403.07815 (2024)
Pith/arXiv arXiv 2024
-
[81]
A. Das, W. Kong, R. Sen, Y. Zhou, A decoder-only foundation model for time-series forecasting, arXiv preprint arXiv:2310.10688 (2023). S35
Pith/arXiv arXiv 2023
-
[82]
M. Y. Ahamed, M. A. B. Syed, Zero shot time series forecasting: Do time series fms outperform cross modal fms?, in: Recent Advances in Time Series Foundation Models Have We Reached the’BERT Moment’?
-
[83]
Y. Wang, G. Huang, C. Chen, Q. Li, X. Xu, A comparative study of time series founda- tion models for hand, foot, and mouth disease forecasting: Timesfm, moirai, and traditional approaches, Frontiers in Public Health 13 (2025) 1634138
2025
-
[84]
U. H. Lok, Z.-L. Lu, J.-H. Syu, Forecasting option-implied dynamics with google timesfm: From model to market, in: 2025 IEEE International Conference on Big Data (BigData), IEEE, 2025, pp. 6914–6919
2025
-
[85]
M. Santos-Moreno, Forecasting electrical demand with zero-shot lag llama and timesfm v2, in: Progress in Artificial Intelligence and Pattern Recognition: 9th International Congress, IWAIPR 2025, Varadero, Cuba, October 14–17, 2025, Proceedings, Springer Nature, 2026, p. 323
2025
-
[86]
Zhuang, H
D. Zhuang, H. Xu, X. Guo, Y. Zheng, S. Wang, J. Zhao, Mitigating spatial disparity in urban prediction using residual-aware spatiotemporal graph neural networks: A chicago case study, in: Companion Proceedings of the ACM on Web Conference 2025, 2025, pp. 2351–2360. S36
2025
discussion (0)
Sign in with ORCID, Apple, or X to comment. Anyone can read and Pith papers without signing in.