The atmospheric extinction curve at Lenghu site
Pith reviewed 2026-06-26 19:41 UTC · model grok-4.3
The pith
The atmospheric extinction curve at Lenghu has been derived using A0 star observations and compared to Mauna Kea and Cerro Paranal.
A machine-rendered reading of the paper's core claim, the machinery that carries it, and where it could break.
Core claim
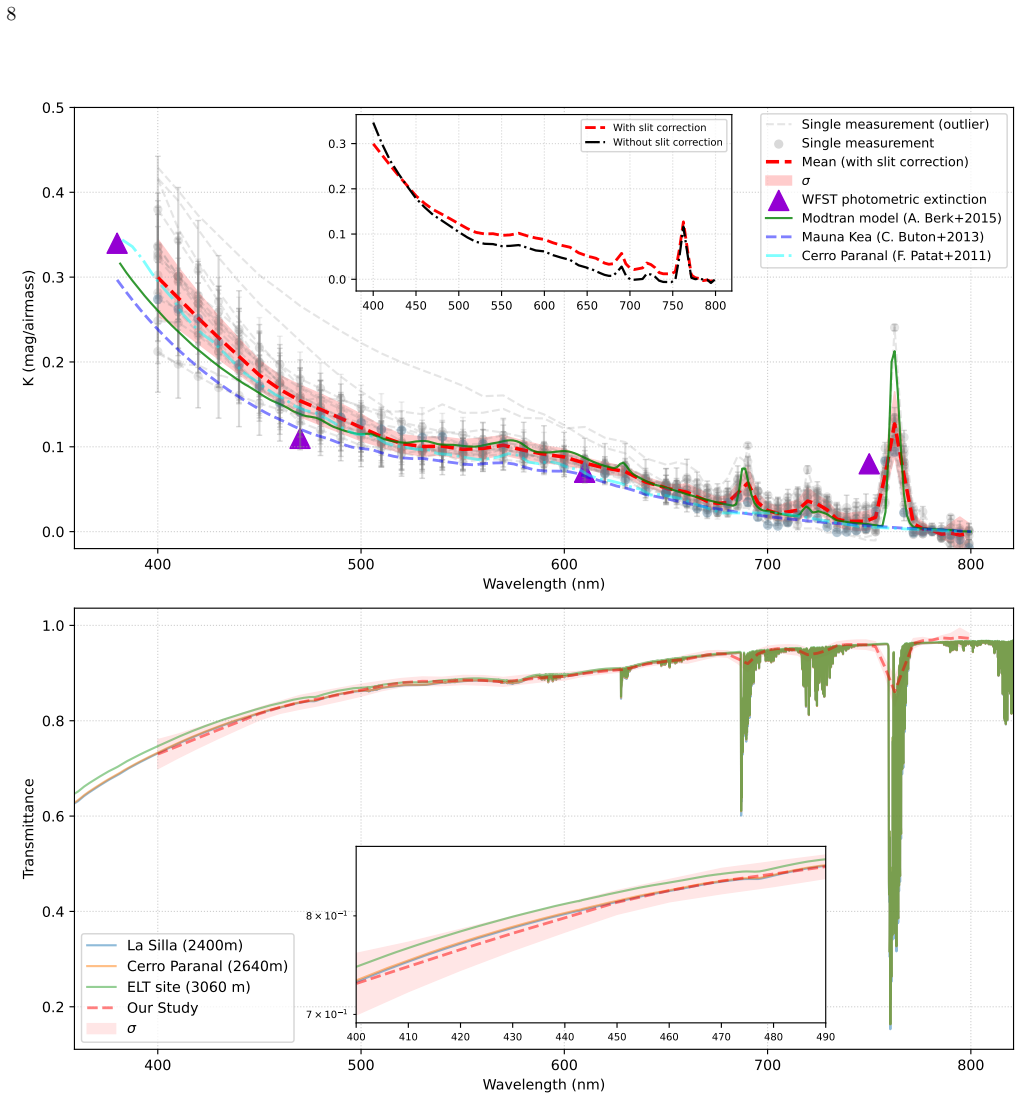
The extinction curve for the Lenghu site is derived from the airmass-dependent attenuation of light from A0 stars in the optical range, and it is directly compared with the extinction curves from Mauna Kea and Cerro Paranal.
What carries the argument
Differential measurements of stellar flux as a function of airmass using low-resolution spectra of A0 stars to isolate the wavelength-dependent atmospheric extinction.
If this is right
- The Lenghu site now has a characterized extinction curve for use in optical observations.
- Quantitative comparisons can be made between Lenghu and other sites for site selection decisions.
- The method demonstrates the use of spectroscopic data for extinction determination at new sites.
- Data collected over several years provides a robust baseline for the curve.
Where Pith is reading between the lines
- This could support planning for future telescope installations at Lenghu.
- The results may help in modeling regional atmospheric effects on light transmission.
- Similar measurements could be repeated to monitor changes in the extinction over time.
- Connections to photometric calibration techniques using standard stars are strengthened.
Load-bearing premise
Observations of A0-type stars at airmasses 1.0-2.0 yield an extinction curve free from significant instrumental or other atmospheric contamination.
What would settle it
If independent observations at Lenghu produce a substantially different extinction curve, the derived values would be called into question.
Figures
read the original abstract
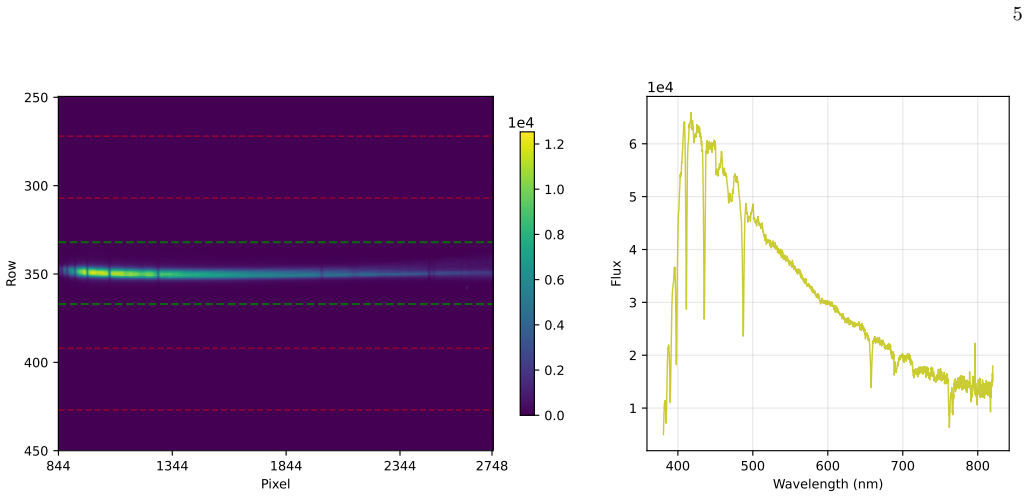
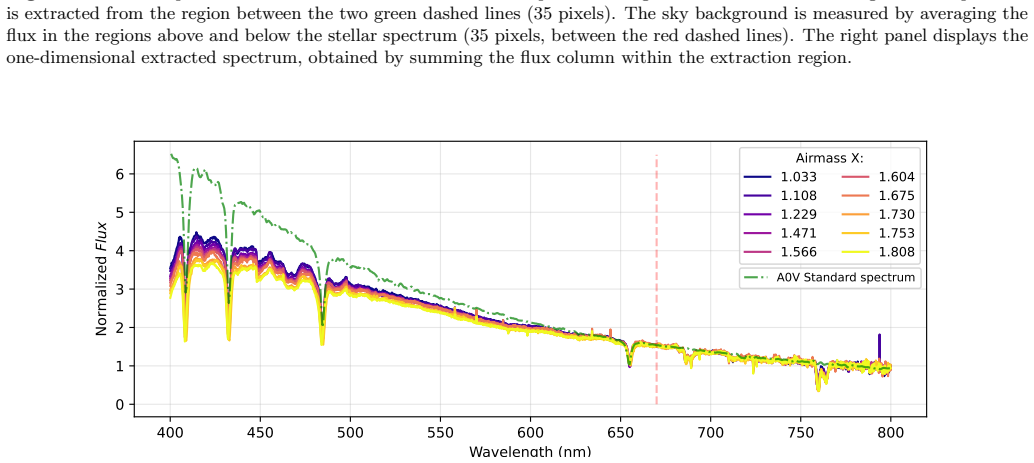
In this study, we use a dedicated spectroscopic telescope to carry out low-resolution measurements of the optical atmospheric extinction curve at Lenghu astronomical site in Qinghai Province, China. Observations of A0-type stars are conducted over multiple nights between 2024 and 2026, covering airmasses from 1.0 to 2.0 and wavelengths in the range of 400 to 800 nm. We derive the extinction curve for the Lenghu site and compare it with those from Mauna Kea and Cerro Paranal.
Editorial analysis
A structured set of objections, weighed in public.
Referee Report
Summary. The manuscript reports low-resolution spectroscopic observations of A0-type stars at the Lenghu site over multiple nights in 2024-2026, covering airmasses 1.0-2.0 and wavelengths 400-800 nm, to derive the site's atmospheric extinction curve and compare it with those from Mauna Kea and Cerro Paranal.
Significance. If substantiated with data and analysis, the result would provide a useful characterization of a developing astronomical site in China, allowing direct comparison to established sites and informing observational planning. The conventional technique of A0-star spectroscopy across airmass is appropriate for this purpose.
major comments (1)
- [Abstract] Abstract: The abstract states that a curve was derived but supplies no data, fitting procedure, error analysis, or comparison details, preventing evaluation of whether the measurements support the claim.
Simulated Author's Rebuttal
We thank the referee for highlighting the lack of detail in the abstract. We agree this limits evaluation and will revise the abstract accordingly while ensuring the full manuscript already contains the supporting analysis.
read point-by-point responses
-
Referee: [Abstract] Abstract: The abstract states that a curve was derived but supplies no data, fitting procedure, error analysis, or comparison details, preventing evaluation of whether the measurements support the claim.
Authors: We agree the abstract is overly concise and omits these elements. The full manuscript describes the A0-star observations across airmasses 1.0-2.0, the low-resolution spectroscopy from 400-800 nm, the derivation of the extinction curve via airmass-dependent fitting, associated uncertainties, and direct comparisons to Mauna Kea and Cerro Paranal. In revision we will expand the abstract to briefly summarize the dataset, fitting approach, error treatment, and key comparative results. revision: yes
Circularity Check
No significant circularity in direct observational report
full rationale
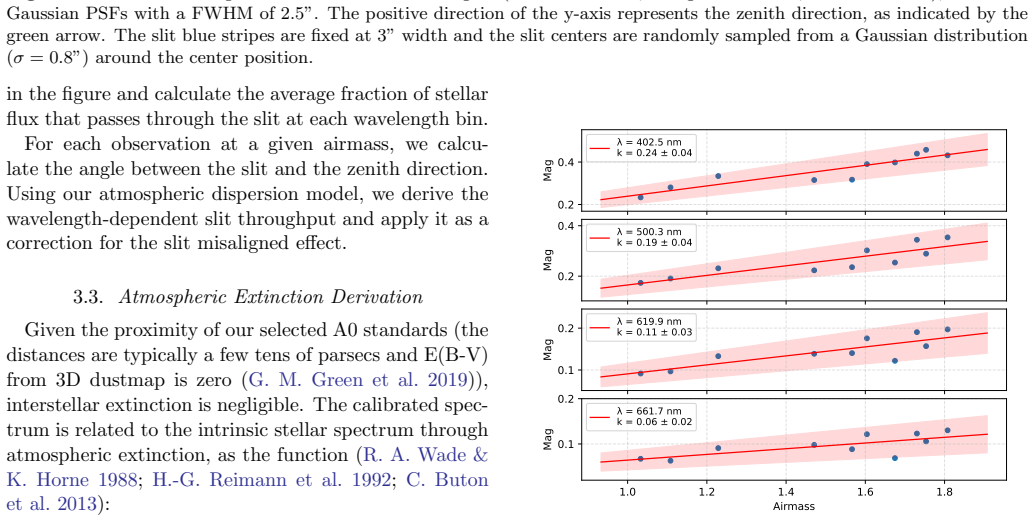
The paper presents a conventional empirical measurement: low-resolution spectroscopy of A0 stars at airmasses 1.0-2.0 to extract the extinction curve between 400-800 nm, followed by site comparisons. No equations, fitted models, self-definitions, or derivations are described that could reduce the claimed result to its own inputs by construction. The derivation chain consists solely of data reduction from observations, with no load-bearing self-citations or ansatzes. This is a standard site-characterization report whose central claim is an independent empirical output.
Axiom & Free-Parameter Ledger
axioms (1)
- domain assumption A0-type stars have sufficiently well-known spectra to serve as standards for deriving atmospheric extinction.
Reference graph
Works this paper leans on
-
[1]
16 https://www.eso.org/observing/etc/bin/gen/form?INS. MODE=swspectr+INS.NAME=SKYCALC Astropy Collaboration, Robitaille, T. P., Tollerud, E. J., et al. 2013, A&A, 558, A33, doi: 10.1051/0004-6361/201322068 Astropy Collaboration, Price-Whelan, A. M., Sip˝ ocz, B. M., et al. 2018, AJ, 156, 123, doi: 10.3847/1538-3881/aabc4f 10 Astropy Collaboration, Price-W...
-
[2]
2015, in Society of Photo-Optical Instrumentation Engineers (SPIE) Conference Series, Vol
Berk, A., Conforti, P., & Hawes, F. 2015, in Society of Photo-Optical Instrumentation Engineers (SPIE) Conference Series, Vol. 9472, Algorithms and Technologies for Multispectral, Hyperspectral, and Ultraspectral Imagery XXI, ed. M. Velez-Reyes & F. A. Kruse, 947217, doi: 10.1117/12.2177444
-
[3]
Bohlin, R. C. 2014, AJ, 147, 127, doi: 10.1088/0004-6256/147/6/127
-
[4]
Bohlin, R. C., Gordon, K. D., & Tremblay, P.-E. 2014, PASP, 126, 711, doi: 10.1086/677655
-
[5]
L., Axelrod, T., Blondin, S., et al
Burke, D. L., Axelrod, T., Blondin, S., et al. 2010, ApJ, 720, 811, doi: 10.1088/0004-637X/720/1/811
-
[6]
2013, A&A, 549, A8, doi: 10.1051/0004-6361/201219834
Buton, C., Copin, Y., Aldering, G., et al. 2013, A&A, 549, A8, doi: 10.1051/0004-6361/201219834
-
[7]
2026, The observational condition of Lenghu site I
Cai, M., Wan, Z., Xu, Z., & Fan, L. 2026, The observational condition of Lenghu site I. The first atmospheric extinction measurements with the Wide Field Survey Telescope, in prep,
2026
-
[8]
J., & Pickering, E
Cannon, A. J., & Pickering, E. C. 1993, VizieR Online Data Catalog: Henry Draper Catalogue and Extension (Cannon+ 1918-1924; ADC 1989),, VizieR On-line Data Catalog: III/135A. Originally published in: Harv. Ann. 91-100 (1918-1924)
1993
-
[9]
2021, Nature, 596, 353, doi: 10.1038/s41586-021-03711-z
Deng, L., Yang, F., Chen, X., et al. 2021, Nature, 596, 353, doi: 10.1038/s41586-021-03711-z
-
[10]
Filippenko, A. V. 1982, PASP, 94, 715, doi: 10.1086/131052
-
[11]
2022, Universe, 8, 538, doi: 10.3390/universe8100538
Gao, B., Ping, Y., Lu, Y., & Zhang, C. 2022, Universe, 8, 538, doi: 10.3390/universe8100538
-
[12]
A 3D Dust Map Based on Gaia, Pan-STARRS 1 and 2MASS
Finkbeiner, D. 2019, ApJ, 887, 93, doi: 10.3847/1538-4357/ab5362
work page internal anchor Pith review doi:10.3847/1538-4357/ab5362 2019
-
[13]
Hayes, D. S., & Latham, D. W. 1975, ApJ, 197, 593, doi: 10.1086/153548
-
[14]
H., Wallace, L., & Livingston, W
Hinkle, K. H., Wallace, L., & Livingston, W. 2003, in American Astronomical Society Meeting Abstracts, Vol. 203, American Astronomical Society Meeting Abstracts, 38.03
2003
-
[15]
Hopkins, J. L. 2014, Using Commercial Amateur Astronomical Spectrographs, doi: 10.1007/978-3-319-01442-5
-
[16]
Houghton, J. T. 1977, The physics of atmospheres
1977
-
[17]
2013, A&A, 560, A91, doi: 10.1051/0004-6361/201322433
Kimeswenger, S. 2013, A&A, 560, A91, doi: 10.1051/0004-6361/201322433
-
[18]
Kasten, F., & Young, A. T. 1989, ApOpt, 28, 4735, doi: 10.1364/AO.28.004735
-
[19]
Ralchenko, Reader, J., & and NIST ASD Team
Kramida, A., Yu. Ralchenko, Reader, J., & and NIST ASD Team. 2024, NIST Atomic Spectra Database (ver. 5.12), [Online]. Available:https://physics.nist.gov/asd [2025, December 8]. National Institute of Standards and
2024
-
[20]
1987, PASP, 99, 887, doi: 10.1086/132054
Krisciunas, K., Sinton, W., Tholen, K., et al. 1987, PASP, 99, 887, doi: 10.1086/132054
-
[21]
2023, Research in Astronomy and Astrophysics, 23, 035013, doi: 10.1088/1674-4527/acb877
Lei, L., Zhu, Q.-F., Kong, X., et al. 2023, Research in Astronomy and Astrophysics, 23, 035013, doi: 10.1088/1674-4527/acb877
-
[22]
2016, in Society of Photo-Optical Instrumentation Engineers (SPIE) Conference Series, Vol
Lou, Z., Liang, M., Yao, D., et al. 2016, in Society of Photo-Optical Instrumentation Engineers (SPIE) Conference Series, Vol. 10154, Society of Photo-Optical Instrumentation Engineers (SPIE) Conference Series, 101542A, doi: 10.1117/12.2248371
-
[23]
2014, A&A, 568, A9, doi: 10.1051/0004-6361/201423790
Moehler, S., Modigliani, A., Freudling, W., et al. 2014, A&A, 568, A9, doi: 10.1051/0004-6361/201423790
-
[24]
2012, A&A, 543, A92, doi: 10.1051/0004-6361/201219040
Noll, S., Kausch, W., Barden, M., et al. 2012, A&A, 543, A92, doi: 10.1051/0004-6361/201219040
-
[25]
2011, A&A, 527, A91, doi: 10.1051/0004-6361/201015537
Patat, F., Moehler, S., O’Brien, K., et al. 2011, A&A, 527, A91, doi: 10.1051/0004-6361/201015537
-
[26]
Pickles, A. J. 1998, PASP, 110, 863, doi: 10.1086/316197 ˚Angstr¨ om, A. 1964, Tellus, 16, 64, doi: 10.1111/j.2153- 3490.1964.tb00144.x10.3402/tellusa.v16i1.8885
-
[27]
1992, A&A, 265, 360
Reimann, H.-G., Ossenkopf, V., & Beyersdorfer, S. 1992, A&A, 265, 360
1992
-
[28]
1927, L’Astronomie, 41, 541
Ritchey, G.-W., & Chretien, H. 1927, L’Astronomie, 41, 541
1927
-
[29]
Wade, R. A., & Horne, K. 1988, ApJ, 324, 411, doi: 10.1086/165905
-
[30]
2023, Science China
Wang, T., Liu, G., Cai, Z., et al. 2023, Science China
2023
-
[31]
Physics, Mechanics, and Astronomy, 66, 109512, doi: 10.1007/s11433-023-2197-5
-
[32]
2023, MNRAS, 522, 1419, doi: 10.1093/mnras/stad1006 ˚Angstr¨ om, A
Zhu, L., Zhang, H., Sun, G., et al. 2023, MNRAS, 522, 1419, doi: 10.1093/mnras/stad1006 ˚Angstr¨ om, A. 1929, Geografiska Annaler, 11, 156, doi: 10.1080/20014422.1929.11880498
discussion (0)
Sign in with ORCID, Apple, or X to comment. Anyone can read and Pith papers without signing in.