Multifractal Dynamics of Tropical Atlantic SST Indices: Nonlinear Scaling Structure and Episodic Statistical Association with ENSO Variability
Pith reviewed 2026-06-26 19:03 UTC · model grok-4.3
The pith
The Tropical Atlantic SST Gradient Index exhibits a broader multifractal spectrum than regional indices, with added nonlinear phase correlations and reductions during major El Nino events.
A machine-rendered reading of the paper's core claim, the machinery that carries it, and where it could break.
Core claim
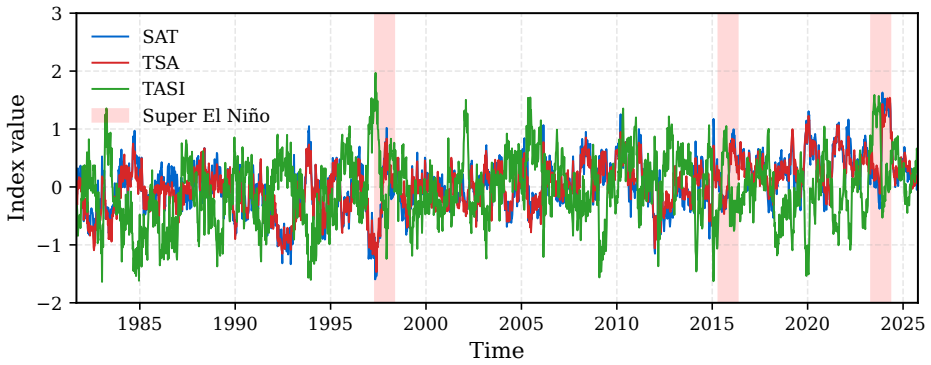
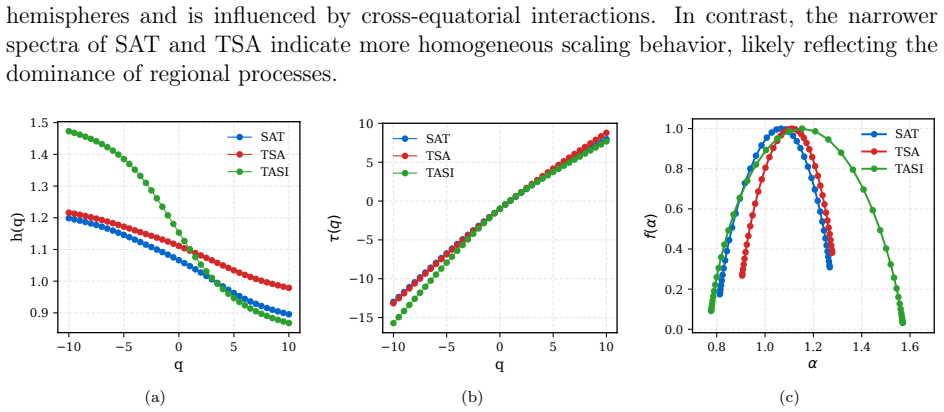
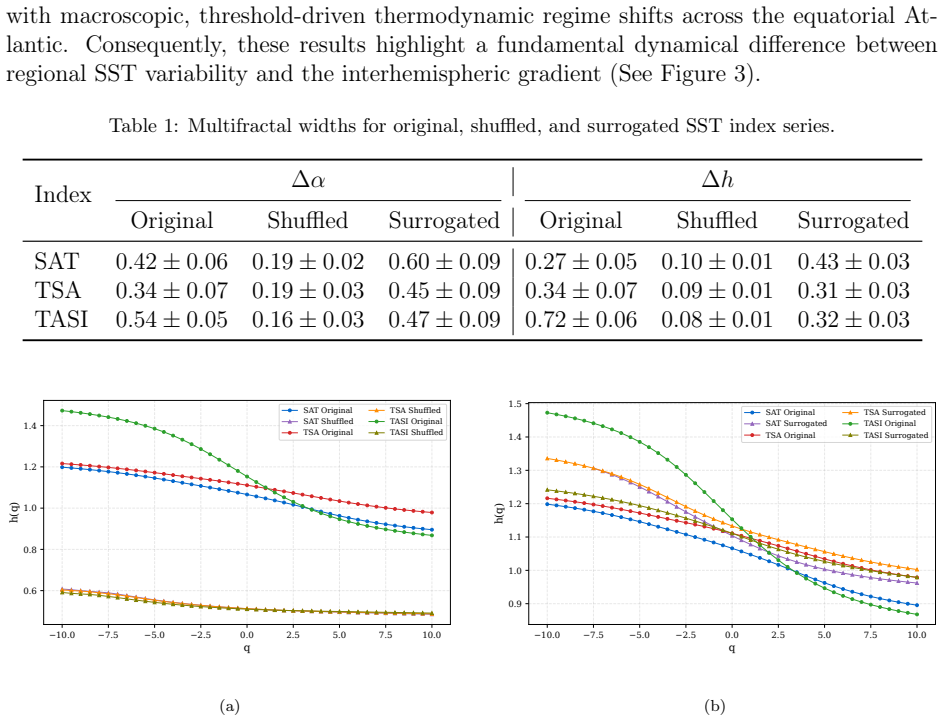
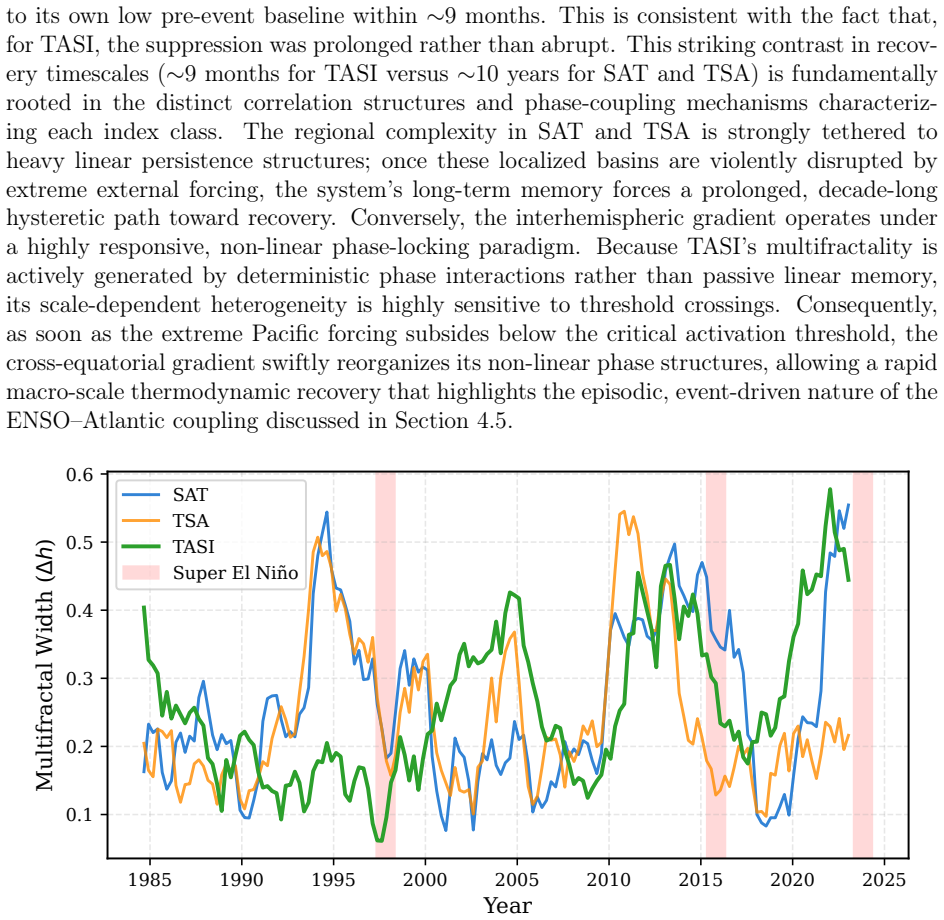
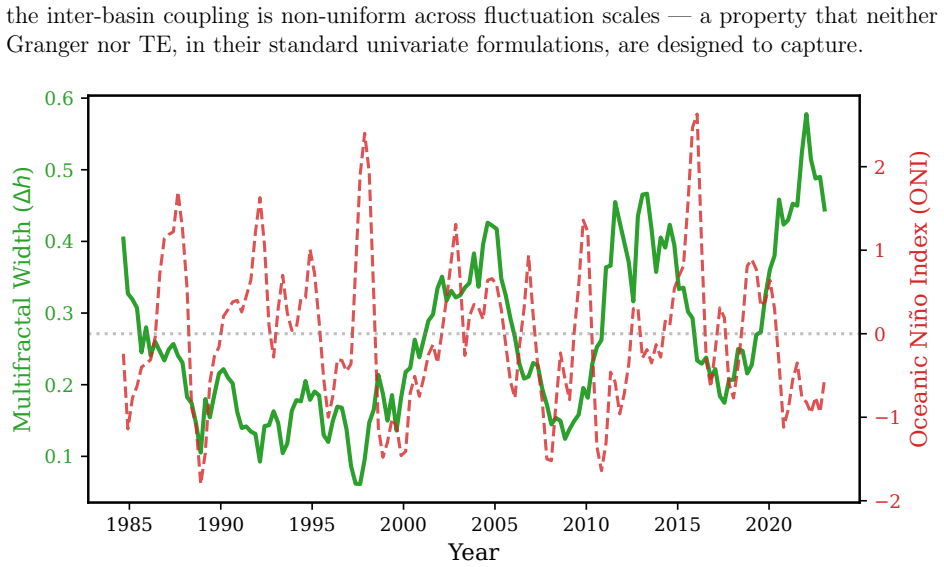
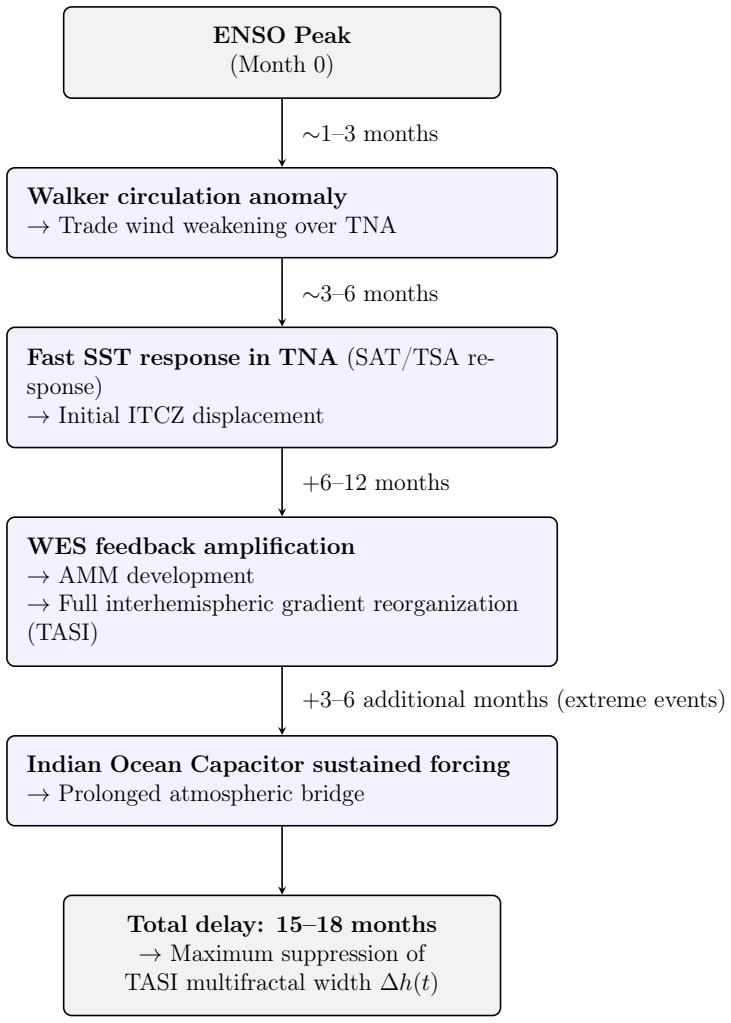
TASI displays a substantially broader multifractal spectrum (Delta h about 0.72) than SAT (0.27) and TSA (0.34). Surrogate-data tests show that multifractality in SAT and TSA is mainly explained by linear autocorrelations, whereas TASI contains an additional nonlinear contribution associated with phase correlations. Significant reductions in multifractal width are observed during the major 1997-1998 and 2015-2016 El Nino events. Lagged correlation analysis reveals a significant negative association with the Oceanic Nino Index at delays of 15-18 months, but Granger causality and Transfer Entropy tests detect no significant causal links, indicating an episodic rather than persistent relationsh
What carries the argument
Multifractal Detrended Fluctuation Analysis (MFDFA) performed in a moving-window framework, together with surrogate-data tests that distinguish linear autocorrelation from nonlinear phase correlations.
If this is right
- Time-dependent multifractal measures provide a framework for characterizing nonlinear Atlantic variability.
- TASI is a dynamically distinct index whose scaling properties contain information not captured by regional SST indices alone.
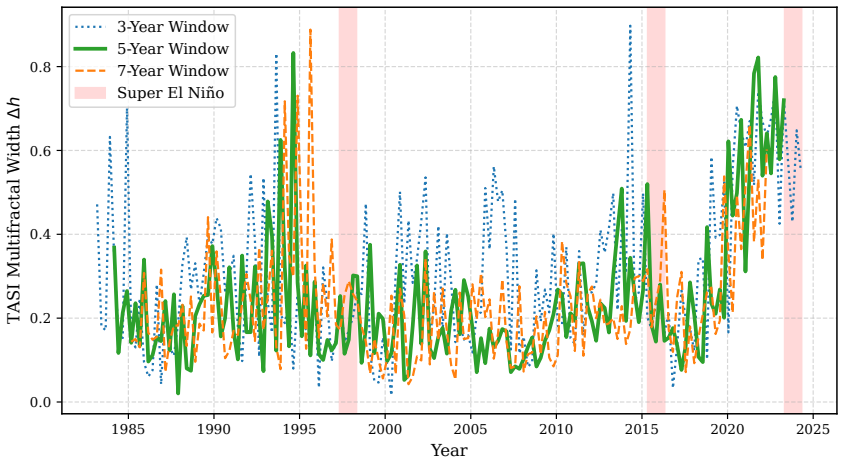
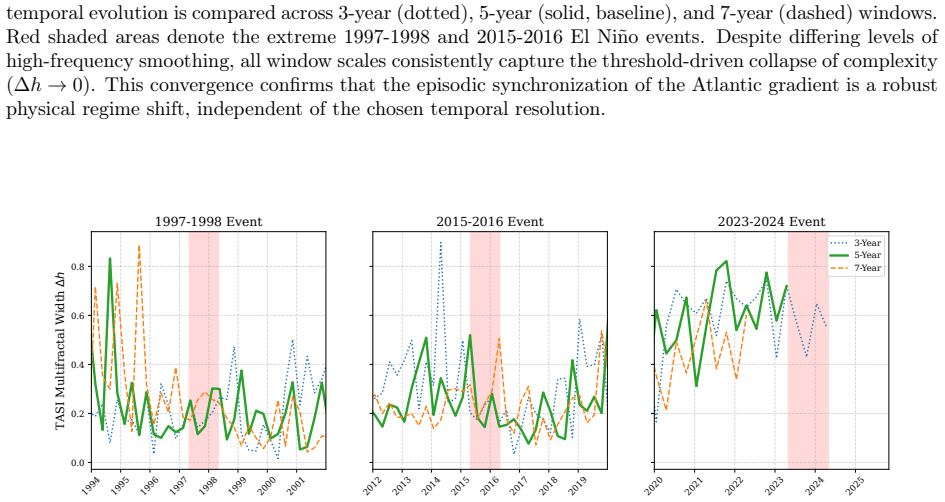
- Multifractal width undergoes significant reductions under extreme Pacific forcing during major El Nino events.
- A significant negative lagged correlation exists with the Oceanic Nino Index at 15-18 month delays without evidence of direct causality.
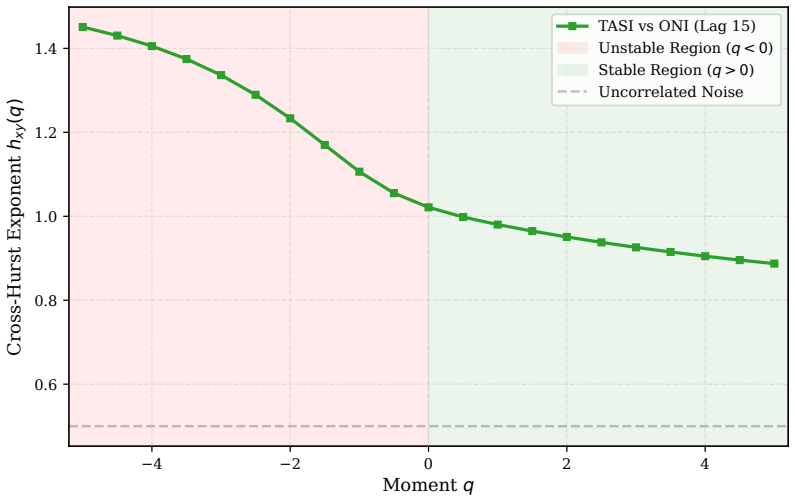
- Lagged multifractal cross-correlation analysis identifies scale-dependent inter-basin coupling between the Atlantic and Pacific.
Where Pith is reading between the lines
- The distinction in nonlinear contributions could be tested by applying the same moving-window method to other gradient-based climate indices to check whether phase correlations systematically mark basin-wide contrasts.
- If the episodic suppression of multifractal width proves repeatable, climate models might be evaluated on whether they reproduce temporary narrowing of scaling ranges during strong remote forcing.
- The 15-18 month lag without detected causality suggests searching for specific atmospheric or oceanic pathways that temporarily link the basins only under certain conditions.
Load-bearing premise
The surrogate-data tests and moving-window MFDFA framework correctly isolate nonlinear phase correlations and temporal changes in multifractal width without artifacts from parameter choices such as window length or surrogate generation method.
What would settle it
Repeating the MFDFA and surrogate analysis on the same indices with altered window lengths or different surrogate-generation procedures that removes the reported difference in spectrum width between TASI and the regional indices or eliminates the reductions during the 1997-1998 and 2015-2016 El Nino periods.
Figures
read the original abstract
The Tropical Atlantic exhibits complex sea surface temperature (SST) variability driven by internal ocean-atmosphere interactions and remote climate forcing. We perform a comparative multifractal analysis of three SST indices, South Atlantic Tropical (SAT), Tropical Southern Atlantic (TSA), and the Tropical Atlantic SST Gradient Index (TASI), using weekly data from 1981 to 2025. Multifractal Detrended Fluctuation Analysis (MFDFA) reveals robust scale-dependent behavior in all indices. TASI displays a substantially broader multifractal spectrum (Delta h about 0.72) than SAT (0.27) and TSA (0.34). Surrogate-data tests show that multifractality in SAT and TSA is mainly explained by linear autocorrelations, whereas TASI contains an additional nonlinear contribution associated with phase correlations. To investigate temporal variability, we introduce a moving-window MFDFA framework that tracks the evolution of multifractal width. Significant reductions are observed during the major 1997-1998 and 2015-2016 El Nino events, indicating a suppression of multiscale variability under extreme Pacific forcing. Lagged correlation analysis reveals a significant negative association with the Oceanic Nino Index at delays of 15-18 months, consistent with known Atlantic-Pacific teleconnections. However, Granger causality and Transfer Entropy tests do not detect significant causal links, suggesting an episodic rather than persistent relationship. Lagged multifractal cross-correlation analysis further reveals scale-dependent inter-basin coupling. These results demonstrate that time-dependent multifractal measures provide a useful framework for characterizing nonlinear Atlantic variability and identify TASI as a dynamically distinct index whose scaling properties contain information not captured by regional SST indices alone.
Editorial analysis
A structured set of objections, weighed in public.
Referee Report
Summary. The manuscript applies Multifractal Detrended Fluctuation Analysis (MFDFA) to weekly SST indices SAT, TSA, and TASI (1981–2025). It reports that TASI has a substantially wider multifractal spectrum (Δh ≈ 0.72) than SAT (0.27) or TSA (0.34); surrogate tests attribute SAT/TSA multifractality mainly to linear autocorrelations while TASI retains an additional nonlinear (phase-correlation) component. A moving-window MFDFA framework detects reductions in multifractal width during the 1997–1998 and 2015–2016 El Niño events. Lagged correlations with the Oceanic Niño Index are significant at 15–18 months, but Granger causality and transfer-entropy tests find no persistent causal links, suggesting an episodic relationship. Scale-dependent cross-correlations between basins are also examined.
Significance. If the reported distinctions survive explicit robustness checks, the work would supply a quantitative, scale-dependent characterization of nonlinear Atlantic variability and identify TASI as dynamically distinct from the regional indices. The combination of MFDFA, surrogates, moving-window analysis, and information-theoretic tests is a methodological strength; the episodic ENSO association, if confirmed, would align with known teleconnections while adding a multifractal perspective.
major comments (3)
- [Abstract; surrogate-data tests section] The central claim that TASI alone retains a nonlinear contribution after surrogates (while SAT/TSA multifractality is linear) rests on the surrogate procedure. The abstract and methods description do not specify whether phase randomization or IAAFT was used, nor do they report verification that the surrogate spectra widths remain undistorted relative to the original linear component; this directly affects the reported Δh contrast of 0.72 versus 0.27/0.34.
- [Moving-window MFDFA framework] The moving-window MFDFA results that show significant width reductions specifically during the 1997–1998 and 2015–2016 El Niño events are load-bearing for the episodic-forcing interpretation. Window length, overlap, q-range, polynomial order, and segment-length choices are not stated, leaving open the possibility that the reported temporal changes arise from edge effects or scale-selection artifacts rather than genuine dynamical shifts.
- [Lagged correlation analysis] The lagged-correlation claim of a significant negative association with ONI at 15–18 months is presented without error bars, exact p-values, or the number of independent samples after accounting for autocorrelation; this weakens the quantitative support for the teleconnection statement relative to the null results from Granger causality and transfer entropy.
minor comments (2)
- [Abstract] The abstract states “Delta h about 0.72” without reporting the precise numerical value or uncertainty; consistent reporting of exact Δh values and their uncertainties would improve clarity.
- [Methods] MFDFA parameters (q-range, segment lengths) are listed among free parameters but not tabulated; a supplementary table listing the exact settings used for each index would aid reproducibility.
Simulated Author's Rebuttal
We thank the referee for the constructive and detailed comments, which identify key areas requiring greater methodological transparency and statistical reporting. We will revise the manuscript to address each point and strengthen the presentation of the results.
read point-by-point responses
-
Referee: [Abstract; surrogate-data tests section] The central claim that TASI alone retains a nonlinear contribution after surrogates (while SAT/TSA multifractality is linear) rests on the surrogate procedure. The abstract and methods description do not specify whether phase randomization or IAAFT was used, nor do they report verification that the surrogate spectra widths remain undistorted relative to the original linear component; this directly affects the reported Δh contrast of 0.72 versus 0.27/0.34.
Authors: We agree that the surrogate procedure requires explicit specification and verification. In the revised manuscript we will state the exact surrogate generation method used and include a direct comparison demonstrating that the surrogate spectrum widths align with the linear component of the original series. This will substantiate the reported distinction in multifractal width for TASI. revision: yes
-
Referee: [Moving-window MFDFA framework] The moving-window MFDFA results that show significant width reductions specifically during the 1997–1998 and 2015–2016 El Niño events are load-bearing for the episodic-forcing interpretation. Window length, overlap, q-range, polynomial order, and segment-length choices are not stated, leaving open the possibility that the reported temporal changes arise from edge effects or scale-selection artifacts rather than genuine dynamical shifts.
Authors: We acknowledge that the moving-window parameters were not reported. The revised manuscript will provide a complete description of the window length, overlap, q-range, polynomial order, and segment lengths employed. We will also add supplementary robustness checks that vary these parameters to confirm that the observed reductions during the cited El Niño events are not attributable to edge effects or scale-selection artifacts. revision: yes
-
Referee: [Lagged correlation analysis] The lagged-correlation claim of a significant negative association with ONI at 15–18 months is presented without error bars, exact p-values, or the number of independent samples after accounting for autocorrelation; this weakens the quantitative support for the teleconnection statement relative to the null results from Granger causality and transfer entropy.
Authors: We agree that additional quantitative details are needed for the lagged-correlation results. The revised manuscript will report error bars, exact p-values for the 15–18 month lags, and the effective number of independent samples after autocorrelation adjustment. These additions will allow a clearer evaluation of the association alongside the Granger causality and transfer-entropy findings. revision: yes
Circularity Check
No significant circularity; all results are direct computations from data via standard procedures
full rationale
The paper applies MFDFA, surrogate tests, moving-window analysis, lagged correlations, Granger causality, and transfer entropy directly to observational SST time series. Reported quantities such as Delta h values, nonlinear contributions, and episodic reductions are outputs of these named statistical methods with no reduction to fitted parameters, self-definitions, or self-citation chains. The central claims rest on empirical measurements rather than any derivation that loops back to its inputs by construction. This is the expected outcome for a purely data-driven analysis paper.
Axiom & Free-Parameter Ledger
free parameters (1)
- MFDFA parameters (q-range, segment lengths, window sizes)
axioms (1)
- domain assumption Surrogate data tests isolate nonlinear contributions via phase randomization
Reference graph
Works this paper leans on
-
[1]
Mechanisms of tropical atlantic sst influence on north american precipitation variability.Journal of Climate, 23(21):5610–5628, 2010
Yochanan Kushnir, Richard Seager, Mingfang Ting, Naomi Naik, and Jennifer Naka- mura. Mechanisms of tropical atlantic sst influence on north american precipitation variability.Journal of Climate, 23(21):5610–5628, 2010
2010
-
[2]
The role of tropical atlantic sst anomalies in modulating western north pacific tropical cyclone genesis.Geophysical Research Letters, 42(7):2378–2384, 2015
Liwei Huo, Pinwen Guo, Saji N Hameed, and Dachao Jin. The role of tropical atlantic sst anomalies in modulating western north pacific tropical cyclone genesis.Geophysical Research Letters, 42(7):2378–2384, 2015
2015
-
[3]
Global sea surface temperature analyses: Multiple problems and their implications for climate analysis, modeling, and reanalysis
James W Hurrell and Kevin E Trenberth. Global sea surface temperature analyses: Multiple problems and their implications for climate analysis, modeling, and reanalysis. Bulletin of the American Meteorological Society, 80(12):2661–2678, 1999
1999
-
[4]
A decadal climate variation in the tropical atlantic ocean from thermodynamic air-sea interactions.Nature, 385(6616):516–518, 1997
Ping Chang, Link Ji, and Hong Li. A decadal climate variation in the tropical atlantic ocean from thermodynamic air-sea interactions.Nature, 385(6616):516–518, 1997
1997
-
[5]
Multi-scale variability of the sea surface temperature in the tropical atlantic.Journal of Geophysical Research: Oceans, 109(C5), 2004
Rita Valéria Andreoli and Mary Toshie Kayano. Multi-scale variability of the sea surface temperature in the tropical atlantic.Journal of Geophysical Research: Oceans, 109(C5), 2004
2004
-
[6]
Climate variability and atlantic surface gravity wave variability based on reanalysis data.Journal of Marine Science and Engineering, 13(8):1536, 2025
Yuri Onça Prestes, Alex Costa da Silva, André Lanfer Marquez, Gabriel D’annunzio Gomes Junior, and Fabrice Hernandez. Climate variability and atlantic surface gravity wave variability based on reanalysis data.Journal of Marine Science and Engineering, 13(8):1536, 2025
2025
-
[7]
Rita Valéria Andreoli and Mary Toshie Kayano. Tropical pacific and south atlantic effects on rainfall variability over northeast brazil.International Journal of Climatology: A Journal of the Royal Meteorological Society, 26(13):1895–1912, 2006
1912
-
[8]
Atlantic hurricanes and natural variability in 2005.Geophysical research letters, 33(12), 2006
Kevin E Trenberth and Dennis J Shea. Atlantic hurricanes and natural variability in 2005.Geophysical research letters, 33(12), 2006
2005
-
[9]
Atlantic sst gradient and the influence of enso.Geophysical research letters, 32(20), 2005
Huei-Ping Huang, Andrew W Robertson, and Yochanan Kushnir. Atlantic sst gradient and the influence of enso.Geophysical research letters, 32(20), 2005
2005
-
[10]
Atmosphere–ocean coupled variability in the south atlantic.Journal of Climate, 10(11):2904–2920, 1997
SA Venegas, LA Mysak, and DN Straub. Atmosphere–ocean coupled variability in the south atlantic.Journal of Climate, 10(11):2904–2920, 1997
1997
-
[11]
Trenberth
Kevin E. Trenberth. The definition of el niño.Bulletin of the American Meteorological Society, 78(12):2771–2777, 1997. 21
1997
-
[12]
Dynamical nonlinearity in the at- mospheric response to atlantic sea surface temperature anomalies.Geophysical research letters, 30(20), 2003
Walter A Robinson, Shuanglin Li, and Shiling Peng. Dynamical nonlinearity in the at- mospheric response to atlantic sea surface temperature anomalies.Geophysical research letters, 30(20), 2003
2003
-
[13]
On the relationship between atlantic niño variability and ocean dynamics.Climate Dynamics, 51(1):597–612, 2018
Tina Dippe, Richard J Greatbatch, and Hui Ding. On the relationship between atlantic niño variability and ocean dynamics.Climate Dynamics, 51(1):597–612, 2018
2018
-
[14]
Multifractal analysis of el nino climate influence.Sea, 28:30, 2000
Irini Reljin, Branimir Reljin, and Gordana Jovanovic. Multifractal analysis of el nino climate influence.Sea, 28:30, 2000
2000
-
[15]
Multifractal analysis of meteorological time series to assess climate impacts.Climate Research, 65:39–52, 2015
Piotr Baranowski, Jaromir Krzyszczak, Cezary Slawinski, Holger Hoffmann, Jerzy Kozyra, Anna Nieróbca, Krzysztof Siwek, and Andrzej Gluza. Multifractal analysis of meteorological time series to assess climate impacts.Climate Research, 65:39–52, 2015
2015
-
[16]
Kantelhardt, Stephan A
Jan W. Kantelhardt, Stephan A. Zschiegner, Eva Koscielny-Bunde, Shlomo Havlin, Armin Bunde, and H. Eugene Stanley. Multifractal detrended fluctuation analysis of nonstationary time series.Physica A: Statistical Mechanics its Applications, 316(1- 4):87–114, 2002
2002
-
[17]
Introductiontomultifractaldetrendedfluctuationanalysisinmatlab
EspenA.F.Ihlen. Introductiontomultifractaldetrendedfluctuationanalysisinmatlab. Frontiers in Physiology, 3:141, 2012
2012
-
[18]
Auto-and cross-correlation multifractal analysis of sea surface temperature variability.Fractal and Fractional, 8(4):239, 2024
Gyuchang Lim and Jong-Jin Park. Auto-and cross-correlation multifractal analysis of sea surface temperature variability.Fractal and Fractional, 8(4):239, 2024
2024
-
[19]
Multifractal detrended fluctuation analysis of particulate matter and at- mospheric variables at different time scales.Meteorology and Atmospheric Physics, 135(3):27, 2023
Ibiyinka Fuwape, Samuel Ogunjo, Joshua Akinsusi, Babatunde Rabiu, and Gregory Jenkins. Multifractal detrended fluctuation analysis of particulate matter and at- mospheric variables at different time scales.Meteorology and Atmospheric Physics, 135(3):27, 2023
2023
-
[20]
Surrogate time series.Physica D: Nonlinear Phenomena, 142(3-4):346–382, 2000
Thomas Schreiber and Andreas Schmitz. Surrogate time series.Physica D: Nonlinear Phenomena, 142(3-4):346–382, 2000
2000
-
[21]
Improved surrogate data for nonlinearity tests
Thomas Schreiber and Andreas Schmitz. Improved surrogate data for nonlinearity tests. Physical Review Letters, 77(4):635–638, 1996
1996
-
[22]
Characterising the interplay of dynamics and artefacts: a multifractal analysis of historical humpback whale recordings.Bioacoustics, 35(2):220– 239, 2026
Nahuel Mendez, Sebastián Jaroszewicz, Osei K Tweneboah, Maria P Beccar-Varela, and Maria Cristina Mariani. Characterising the interplay of dynamics and artefacts: a multifractal analysis of historical humpback whale recordings.Bioacoustics, 35(2):220– 239, 2026
2026
-
[23]
Observations of the fractal properties of the japan sea surface temperature patterns.Remote Sensing, 14(11):2185–2201, 1993
LA Bunimovich, AG Ostrovskii, and S Umatani. Observations of the fractal properties of the japan sea surface temperature patterns.Remote Sensing, 14(11):2185–2201, 1993
1993
-
[24]
The atlantic meridional mode and hurricane activity.Geophysical Research Letters, 34(7), 2007
Daniel J Vimont and James P Kossin. The atlantic meridional mode and hurricane activity.Geophysical Research Letters, 34(7), 2007. 22
2007
-
[25]
Noaa physical sciences laboratory: Sat index data.https://psl.noaa.gov/data/correlation/sat.data, 2026
NOAA Physical Sciences Laboratory. Noaa physical sciences laboratory: Sat index data.https://psl.noaa.gov/data/correlation/sat.data, 2026
2026
-
[26]
Noaa physical sciences laboratory: Tsa index data.https://psl.noaa.gov/data/correlation/tsa.data, 2026
NOAA Physical Sciences Laboratory. Noaa physical sciences laboratory: Tsa index data.https://psl.noaa.gov/data/correlation/tsa.data, 2026
2026
-
[27]
Enfield, Alberto M
David B. Enfield, Alberto M. Mestas-Nuñez, and Paul J. Trimble. The atlantic ocean signal in decadal rainfall variability in the united states, namibia, and australia.Geo- physical Research Letters, 26(15):1993–1996, 1999
1993
-
[28]
Enfield, Alberto M
David B. Enfield, Alberto M. Mestas-Nuñez, and Paul J. Trimble. The atlantic mul- tidecadal oscillation and its relation to rainfall and river flows in the continental us. Geophysical Research Letters, 28(11):2077–2080, 2001
2077
-
[29]
Ping Chang, Link Ji Ji, and H. Li. A decadal climate variation in the tropical atlantic ocean from thermodynamic air-sea interactions.Nature, 385(6616):516–518, 1997
1997
-
[30]
G. F. Zebende. Dcca cross-correlation coefficient: Quantifying level of cross-correlation. Physica A: Statistical Mechanics and its Applications, 390(4):614–618, 2011
2011
-
[31]
Eugene Stanley
Boris Podobnik and H. Eugene Stanley. Detrended cross-correlation analysis: a new method for analyzing two nonstationary time series.Physical Review Letters, 100(8):084102, 2008
2008
-
[32]
Multifractal detrended cross-correlation analysis for two nonstationary signals.Physical Review E, 77(6):066211, 2008
Wei-Xing Zhou. Multifractal detrended cross-correlation analysis for two nonstationary signals.Physical Review E, 77(6):066211, 2008
2008
-
[33]
Estimating mutual in- formation.Physical Review E, 69(6):066138, 2004
Alexander Kraskov, Harald Stögbauer, and Peter Grassberger. Estimating mutual in- formation.Physical Review E, 69(6):066138, 2004
2004
-
[34]
Klein, Brian J
Stephen A. Klein, Brian J. Soden, and Ngar-Cheung Lau. Remote sea surface temper- ature variations during enso: Evidence for a tropical atmospheric bridge.Journal of Climate, 12(4):917–932, 1999
1999
-
[35]
George H
Shang-Ping Xie and S. George H. Philander. A coupled ocean-atmosphere model of relevance to the itcz in the eastern pacific.Tellus A, 46(4):340–350, 1994
1994
-
[36]
John C. H. Chiang and Daniel J. Vimont. Analogous pacific and atlantic meridional modes of tropical atmosphere–ocean variability.Journal of Climate, 17(21):4143–4158, 2004
2004
-
[37]
Indian ocean capacitor effect on indo-western pacific climate during the summer following el niño.Journal of Climate, 22(3):730–747, 2009
Shang-Ping Xie, Kaiming Hu, Jan Hafner, Hiroki Tokinaga, Yan Du, Gang Huang, and Takeaki Sampe. Indian ocean capacitor effect on indo-western pacific climate during the summer following el niño.Journal of Climate, 22(3):730–747, 2009. 23
2009
-
[38]
Nahuel Mendez, Maria Cristina Mariani Maria Pia Beccar-Varela, Osei Tweneboah, and Sebastian Jaroszewicz. Mf-toolkit: A high-performance python library for multifractal analysis with automated crossover detection, source identification and application to gravitational waves data.arXiv preprint arXiv:2604.16257, 2026. Supplementary Material S1. Scaling Beh...
Pith/arXiv arXiv 2026
discussion (0)
Sign in with ORCID, Apple, or X to comment. Anyone can read and Pith papers without signing in.