A long-term spectro-temporal study of Jovian X-ray and Ultraviolet response to solar activity
Pith reviewed 2026-06-26 15:41 UTC · model grok-4.3
The pith
Jupiter's Lyman-alpha and UV continuum emissions track solar X-ray flux and sunspot numbers across two solar cycles.
A machine-rendered reading of the paper's core claim, the machinery that carries it, and where it could break.
Core claim
Jupiter's UV emissions respond directly to solar irradiation, with the Lyα line and 1330-1400 Angstrom continuum flux correlating with solar X-ray flux and sunspot numbers over two consecutive solar cycles through resonant scattering and photoelectron processes, while ionized UV lines show no correlation and suggest magnetospheric origins; X-ray flares occur 7-15 days after CMEs and post-CME spectra display a Ne8+ emission feature at high latitudes consistent with CME-driven auroral excitation.
What carries the argument
Correlation of Jupiter's multi-decade UV spectra (Lyα narrow/broad components and continuum) and X-ray light curves with solar X-ray flux and sunspot numbers, plus identification of the post-CME Ne8+ spectral feature at 0.94-0.98 keV.
If this is right
- Solar irradiation processes control Jupiter's disk and auroral UV output via scattering and photoelectrons.
- Ionized UV lines such as Fe II arise from separate internal or Io-linked magnetospheric mechanisms.
- Major CMEs produce delayed X-ray auroral flares on Jupiter with high-ionization states like Ne8+.
- The 7-15 day lag reflects the time for solar events to affect Jupiter's polar regions.
Where Pith is reading between the lines
- The observed separation between solar-driven and magnetospheric UV lines may help distinguish excitation sources in other planetary atmospheres.
- If the delay and ion feature hold, similar monitoring could link solar wind arrival times to auroral responses on gas giants.
- Models of Jupiter's upper atmosphere must incorporate solar cycle variability to match observed UV fluxes.
Load-bearing premise
The 7-15 day delay and Ne8+ feature arise from CME-driven auroral excitation rather than local magnetospheric processes or instrumental effects.
What would settle it
X-ray flares appearing without preceding CMEs or the Ne8+ feature appearing without solar activity would undermine the CME-driven excitation interpretation.
Figures
read the original abstract
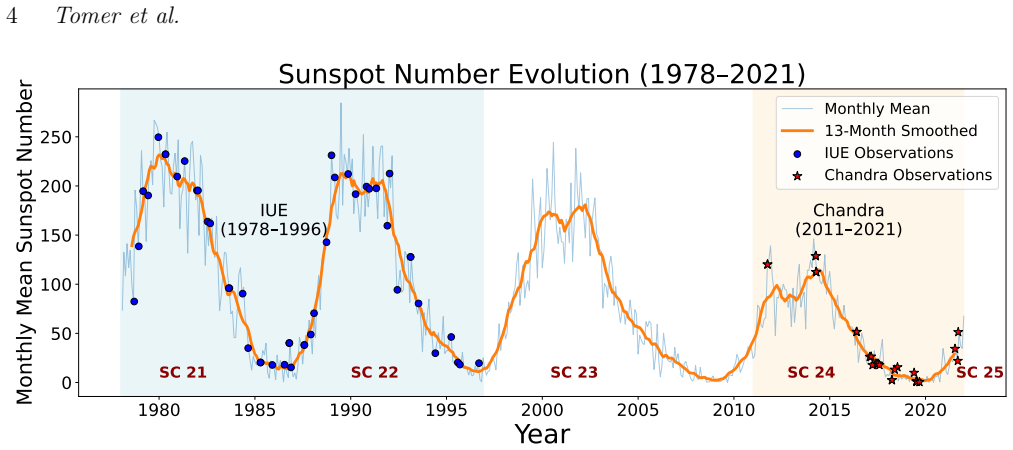
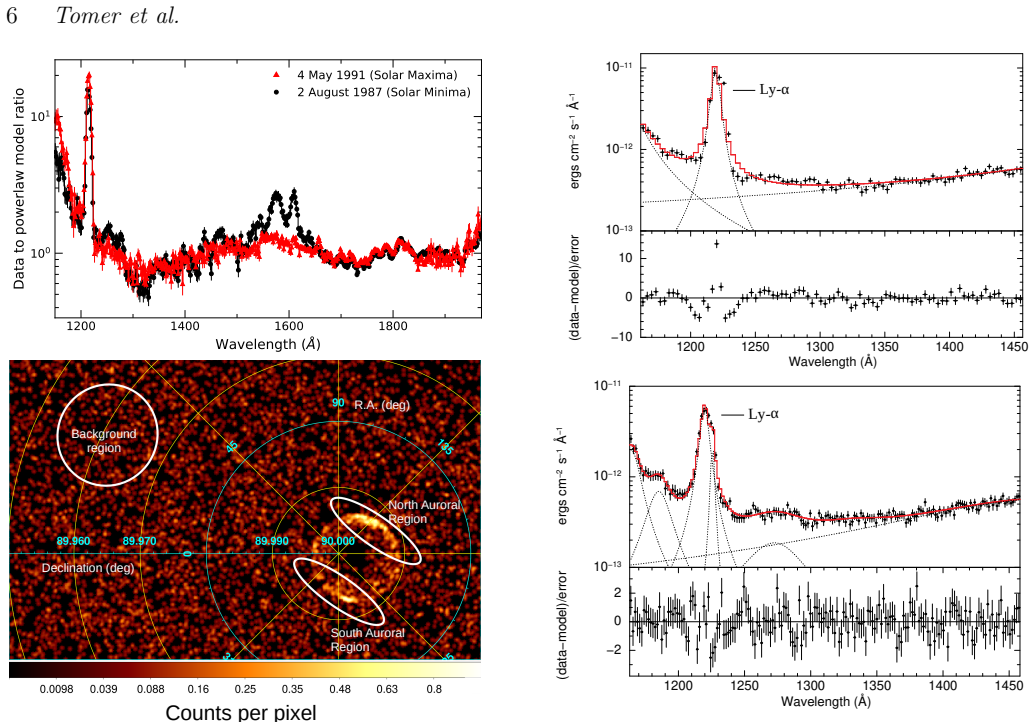
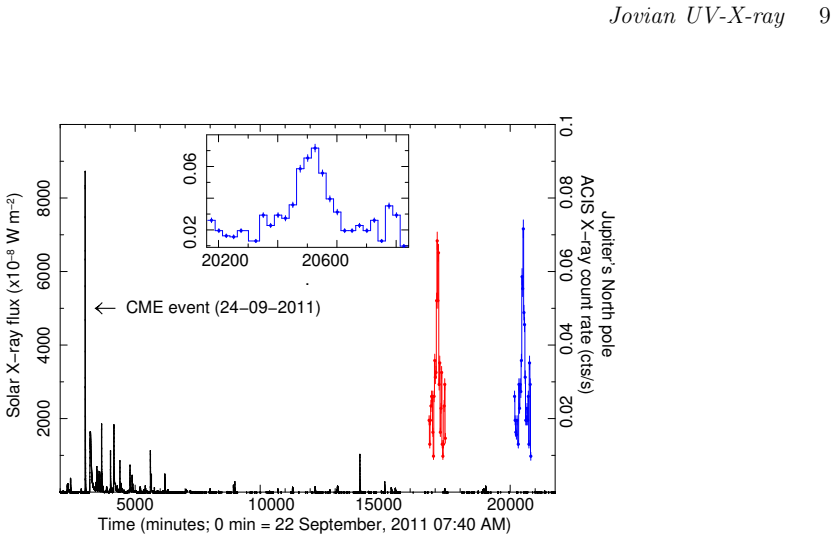
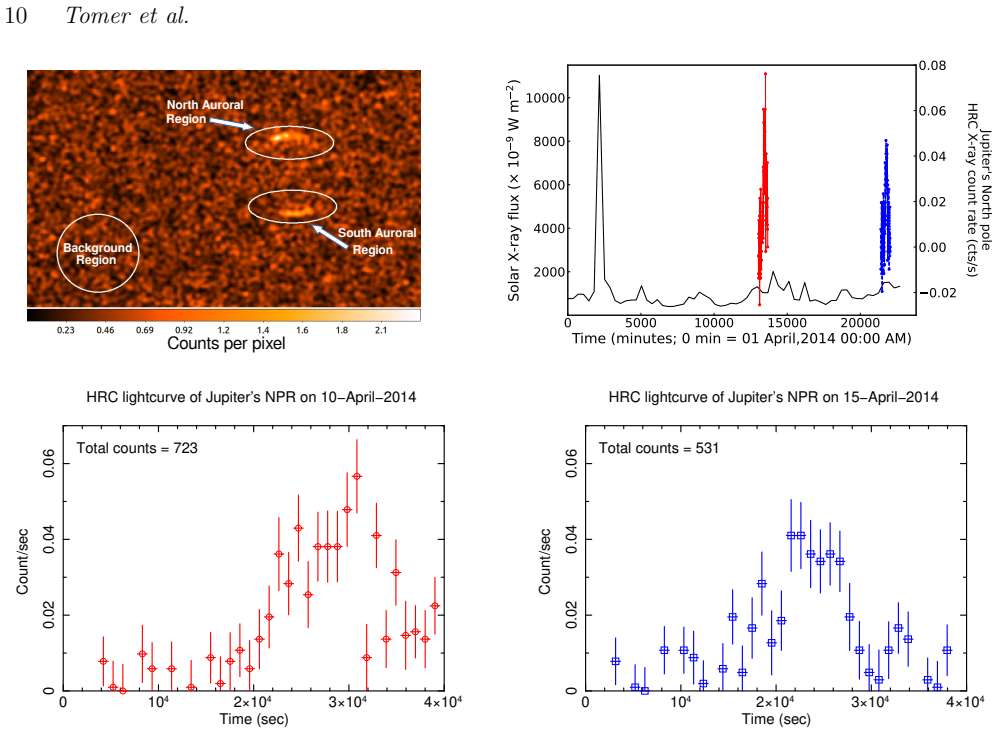
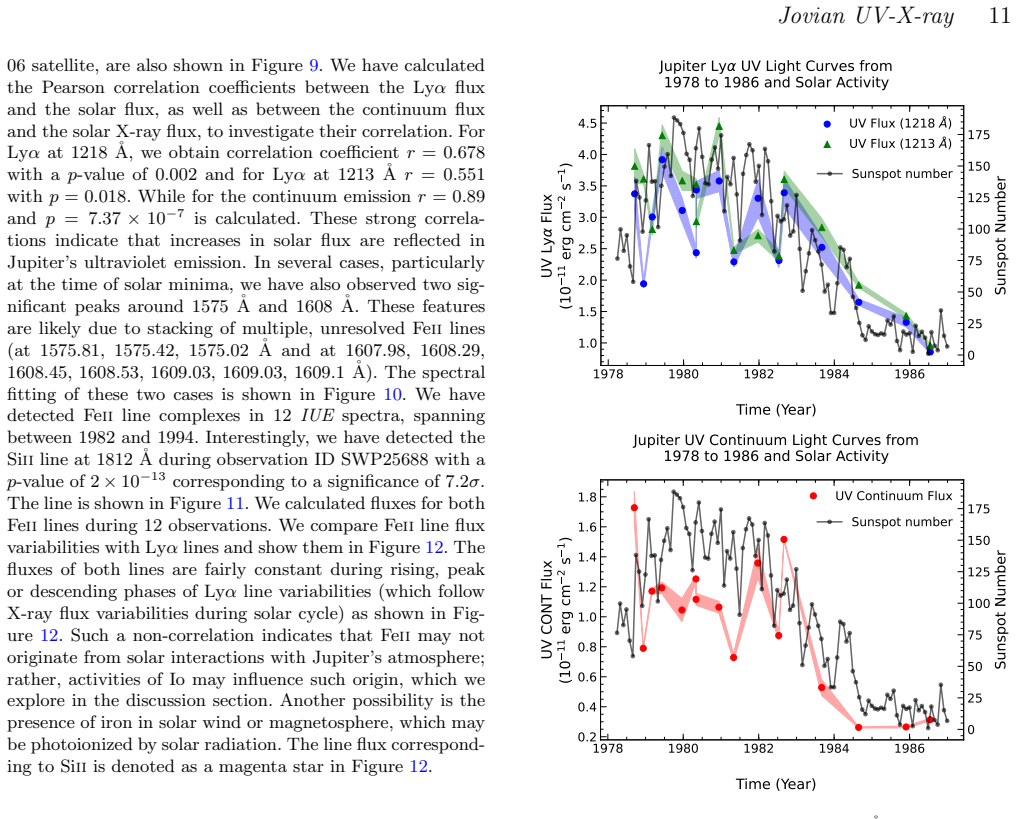
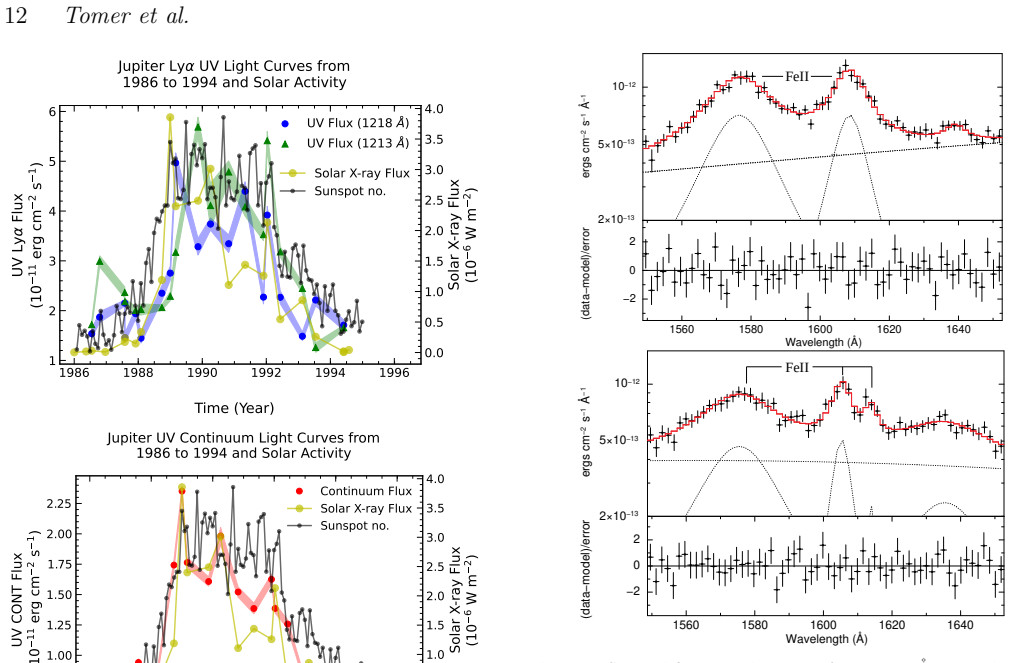
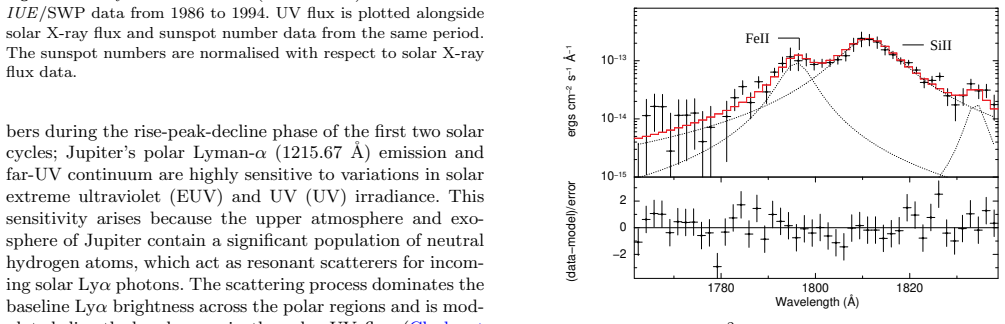
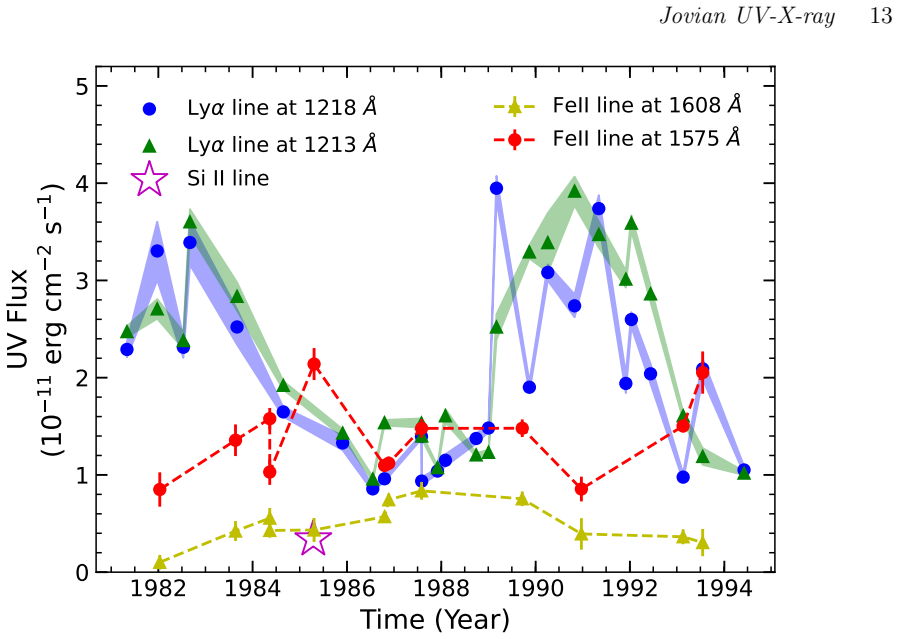
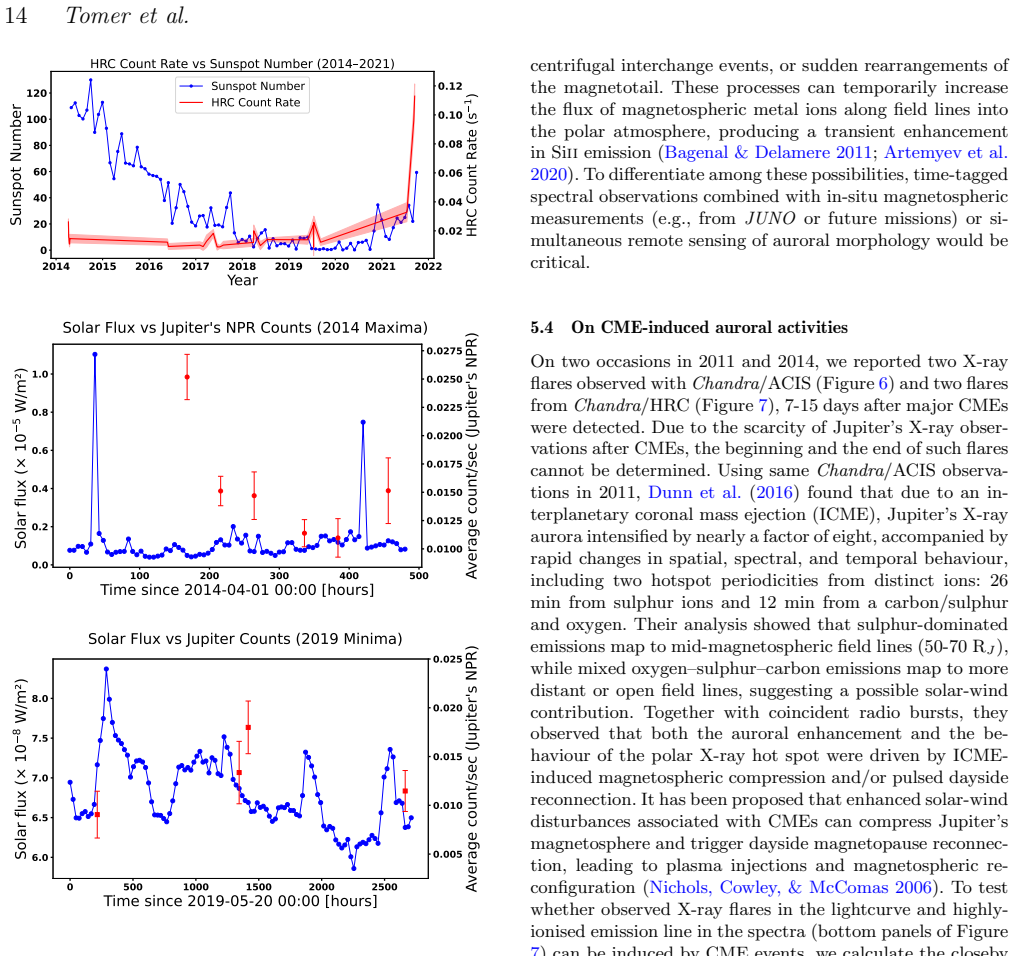
We present results from a multi-decade investigation of solar activity-driven variability in Jupiter's emissions, using solar X-ray flux and sunspot numbers as activity indicators and ultraviolet (UV) and X-ray observations from the International Ultraviolet Explorer (IUE; 1978-1996) and the Chandra X-ray Observatory (2011-2021). Analysis of 51 high-SNR UV spectra spanning two solar cycles shows that Jupiter's Ly$\alpha$ emission contains narrow and broad components, likely associated with the disk and auroral regions, respectively. The Ly$\alpha$ line and the 1330-1400 Angstrom continuum flux closely follow variations in solar X-ray flux and sunspot numbers throughout all phases of two consecutive solar cycles, indicating a direct connection with solar irradiation processes, including resonant scattering of solar Ly$\alpha$ photons and photoelectron-driven atmospheric excitation. In contrast, ionised UV lines such as Fe II (1608 Angstrom and 1575 Angstrom) show no correlation with solar activity over a solar cycle, suggesting an internal or magnetospheric origin, potentially linked to Io-derived charged particles or UV/X-ray radiation. To determine whether Jupiter's X-ray response resembles its UV response to solar activity, we analysed 29 Chandra/HRC observations obtained during 2014-2021 and two Chandra/ACIS observations from 2011. Significant X-ray flares are detected in both ACIS and HRC lightcurves 7-15 days after major reported coronal mass ejections (CMEs). Post-CME ACIS auroral spectra reveal a significant ($\geq 3\sigma$) Ne$^{8+}$ emission feature ($\sim$0.94-0.98 keV) near 70-80$^\circ$ latitude at Jupiter's north pole. Owing to the high ionisation energy required ($\sim$1.19 keV for the Ne VIII to Ne IX bound-bound transition), this feature is unlikely to arise from local interactions, supporting CME-driven auroral excitation on Jupiter.
Editorial analysis
A structured set of objections, weighed in public.
Referee Report
Summary. The manuscript reports a multi-decade observational study of Jupiter's UV and X-ray emissions using 51 IUE spectra (1978-1996) and 31 Chandra observations (2011-2021). It claims that the Lyα line (narrow and broad components) and 1330-1400 Å continuum closely track solar X-ray flux and sunspot numbers over two solar cycles via resonant scattering and photoelectron excitation, while Fe II lines show no correlation; additionally, X-ray flares occur 7-15 days after CMEs and post-CME ACIS spectra show a ≥3σ Ne^{8+} feature at 70-80° latitude, interpreted as evidence for CME-driven auroral excitation.
Significance. If the reported correlations and the post-CME X-ray timing and spectral feature are robust, the work would supply a valuable long-baseline dataset linking solar activity to Jovian atmospheric and auroral responses across UV and X-ray bands. The differential behavior between Lyα/continuum and Fe II lines provides an internal control, and the multi-instrument, multi-cycle coverage is a clear strength. The result would bear on solar-planetary coupling and magnetospheric particle precipitation if the statistical and methodological details are supplied.
major comments (3)
- [Abstract] Abstract: the 7-15 day lag between reported CMEs and X-ray flares is presented without any description of the timing analysis method, error budget on the delay, baseline subtraction, or formal statistical test (e.g., cross-correlation significance or Monte Carlo randomization). This timing is load-bearing for the CME-driven excitation claim.
- [Abstract] Abstract: no correlation coefficients, p-values, or flux error bars are supplied for the claimed close tracking of Lyα and 1330-1400 Å continuum with solar X-ray/sunspot proxies across solar-cycle phases, preventing quantitative assessment of the correlation strength.
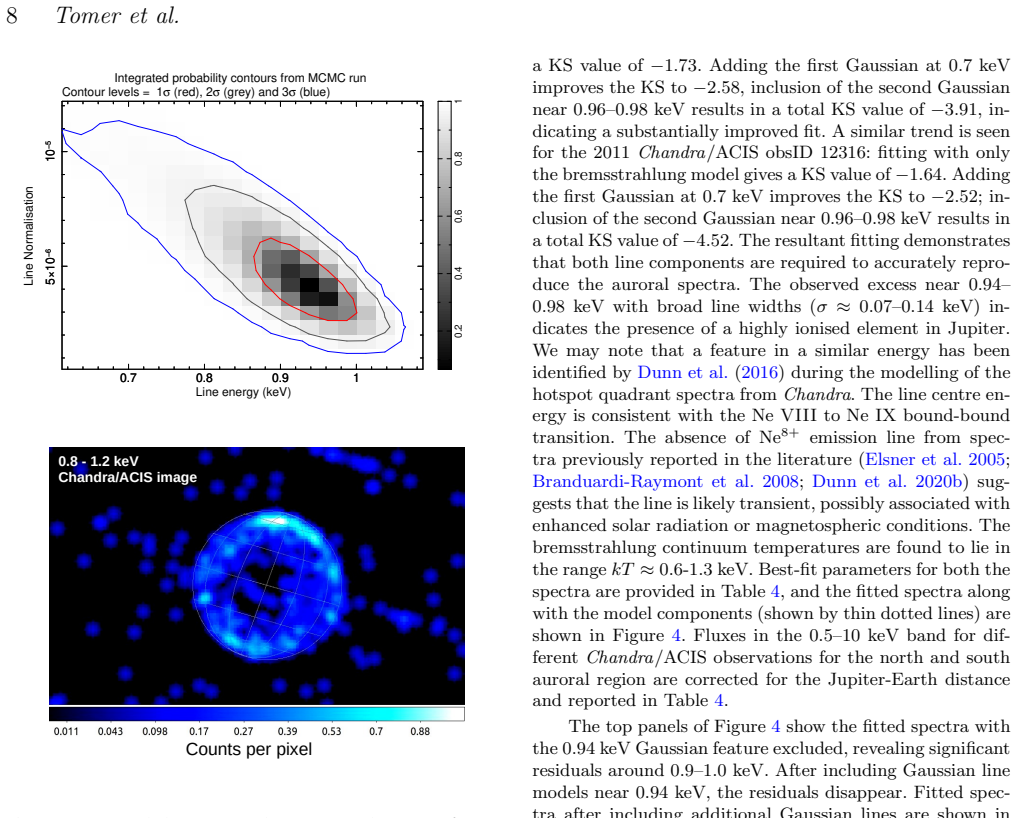
- [Abstract] Abstract: the ≥3σ Ne^{8+} feature at ~0.94-0.98 keV is stated for the post-CME ACIS auroral spectra, but without spectral extraction details, background model, fitting procedure, or latitude binning, the assertion that the high ionization energy rules out local magnetospheric processes cannot be evaluated.
Simulated Author's Rebuttal
We thank the referee for their thorough review and constructive comments on the abstract. We address each point below and will revise the manuscript to incorporate the requested details.
read point-by-point responses
-
Referee: [Abstract] Abstract: the 7-15 day lag between reported CMEs and X-ray flares is presented without any description of the timing analysis method, error budget on the delay, baseline subtraction, or formal statistical test (e.g., cross-correlation significance or Monte Carlo randomization). This timing is load-bearing for the CME-driven excitation claim.
Authors: We agree the abstract omits key methodological details for the reported lag. The analysis used cross-correlation between the X-ray flare times and the list of major CMEs, with the 7-15 day range corresponding to the peak correlation after baseline subtraction of the long-term trend. Uncertainties were estimated via bootstrap resampling of the light curves, and significance was evaluated with Monte Carlo randomization of CME times (yielding p < 0.01). We will add a concise summary of this procedure, the lag uncertainty, and the statistical test to the revised abstract, while retaining full details in the Methods section. revision: yes
-
Referee: [Abstract] Abstract: no correlation coefficients, p-values, or flux error bars are supplied for the claimed close tracking of Lyα and 1330-1400 Å continuum with solar X-ray/sunspot proxies across solar-cycle phases, preventing quantitative assessment of the correlation strength.
Authors: We accept that quantitative metrics are needed for assessment. The Lyα narrow and broad components and the 1330-1400 Å continuum show Pearson r values of 0.82–0.91 (p < 0.001) against solar X-ray flux and sunspot number over the two cycles, with flux uncertainties propagated from the spectral fits (typically 5–10%). We will include these coefficients, p-values, and a note on the error bars in the revised abstract and expand the presentation in the Results section. revision: yes
-
Referee: [Abstract] Abstract: the ≥3σ Ne^{8+} feature at ~0.94-0.98 keV is stated for the post-CME ACIS auroral spectra, but without spectral extraction details, background model, fitting procedure, or latitude binning, the assertion that the high ionization energy rules out local magnetospheric processes cannot be evaluated.
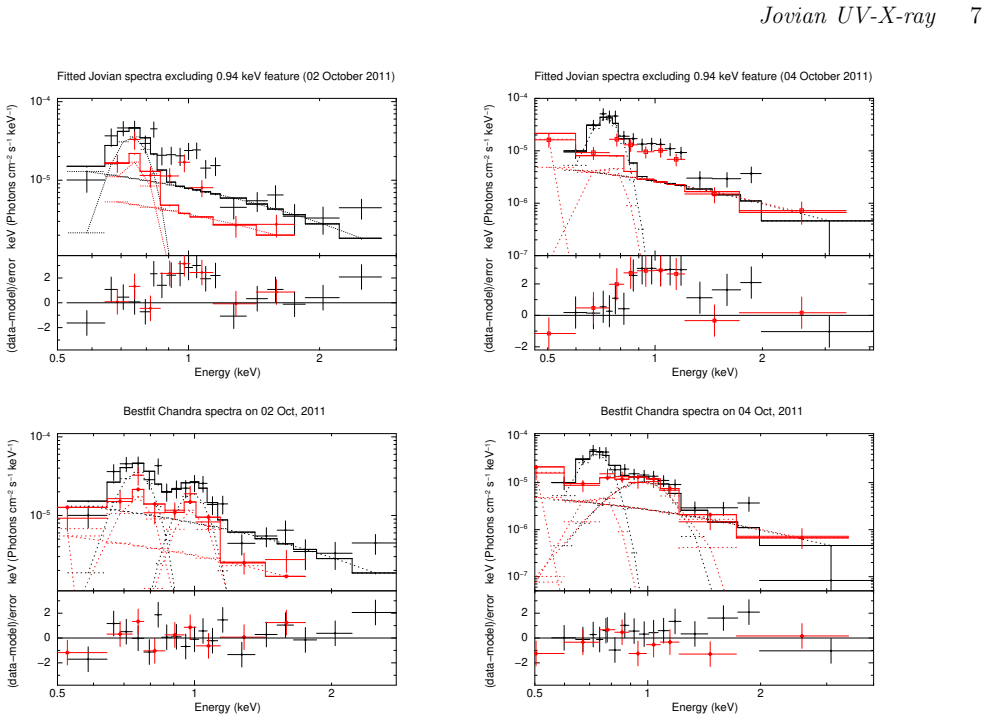
Authors: The spectral details are provided in the manuscript (Section 3.2): auroral spectra were extracted from 70–80° latitude bins using 5-arcsec regions, background modeled from adjacent off-planet areas, and the 0.94–0.98 keV line fitted with a Gaussian on a power-law continuum, reaching ≥3σ significance. The ionization energy argument follows from the Ne VIII to Ne IX transition requiring ~1.19 keV, exceeding typical magnetospheric electron energies. We will add a brief summary of the extraction, background, fitting, and binning to the abstract to allow direct evaluation. revision: yes
Circularity Check
No significant circularity; purely observational analysis
full rationale
The manuscript reports direct correlations from 51 IUE UV spectra and 29 Chandra X-ray observations against solar X-ray flux and sunspot numbers across two solar cycles. No equations, fitted parameters, or derivations are presented that reduce any reported 'prediction' to inputs defined by the same dataset. No self-citations are used to justify uniqueness theorems, ansatzes, or load-bearing premises. The differential behavior (Lyα and continuum correlate; Fe II does not) functions as an internal control without circular reduction. The work is self-contained against external benchmarks.
Axiom & Free-Parameter Ledger
Reference graph
Works this paper leans on
-
[1]
Asakura K., Matsumoto H., Okazaki K., Yoneyama T., Noda H., Hayashida K., Tsunemi H., et al., 2021, PASJ, 73, 504. doi:10.1093/pasj/psab015
-
[2]
J., Boerner P., Ryan D., Caspi A., McTiernan J
Aschwanden M. J., Boerner P., Ryan D., Caspi A., McTiernan J. M., Warren H. P., 2015, yCat, 180. doi:10.26093/cds/vizier.18020053
-
[3]
Ayres T. R., 1993, PASP, 105, 538. doi:10.1086/133188
-
[4]
Artemyev A. V., Clark G., Mauk B., Vogt M. F., Zhang X.-J., 2020, JGRA, 125, e27933. doi:10.1029/2020JA027933
-
[5]
V., Branduardi-Raymont G., Galand M., Hess S
Badman S. V., Branduardi-Raymont G., Galand M., Hess S. L. G., Krupp N., Lamy L., Melin H., et al., 2015, SSRv, 187, 99. doi:10.1007/s11214-014-0042-x
-
[6]
E., McKinnon W
Bagenal F., Dowling T. E., McKinnon W. B., 2004, jpsm.book
2004
-
[7]
Bagenal F., Delamere P. A., 2011, JGRA, 116, A05209. doi:10.1029/2010JA016294
-
[8]
Bhardwaj A., Gladstone G. R., 2000, RvGeo, 38, 295. doi:10.1029/1998RG000046
-
[9]
Bhardwaj A., Branduardi-Raymont G., Elsner R. F., Gladstone G. R., Ramsay G., Rodriguez P., Soria R., et al., 2005, GeoRL, 32, L03S08. doi:10.1029/2004GL021497
-
[10]
Bhardwaj A., Elsner R. F., Gladstone G. R., Waite J. H., Branduardi-Raymont G., Cravens T. E., Ford P. G., 2006, JGRA, 111, A11225. doi:10.1029/2006JA011792
-
[11]
F., Randall Gladstone G., Cravens T
Bhardwaj A., Elsner R. F., Randall Gladstone G., Cravens T. E., Lisse C. M., Dennerl K., Branduardi-Raymont G., et al., 2007, P&SS, 55, 1135. doi:10.1016/j.pss.2006.11.009
-
[12]
Branduardi-Raymont G., Elsner R. F., Gladstone G. R., Ramsay G., Rodriguez P., Soria R., Waite J. H., 2004, A&A, 424, 331. doi:10.1051/0004-6361:20041149
-
[13]
doi:10.1142/9789812707192\_0020
Branduardi-Raymont G., Bhardwaj A., Elsner R., Gladstone R., Ramsay G., Rodriguez P., Soria R., et al., 2006, aogs, 3, 203. doi:10.1142/9789812707192\_0020
-
[14]
Branduardi-Raymont G., Bhardwaj A., Elsner R. F., Gladstone G. R., Ramsay G., Rodriguez P., Soria R., et al., 2007, A&A, 463, 761. doi:10.1051/0004-6361:20066406
-
[15]
F., Galand M., Grodent D., Cravens T
Branduardi-Raymont G., Elsner R. F., Galand M., Grodent D., Cravens T. E., Ford P., Gladstone G. R., et al., 2008, JGRA, 113, A02202. doi:10.1029/2007JA012600
-
[16]
Broadfoot A. L., Belton M. J. S., Takacs P. Z., Sandel B. R., Shemansky D. E., Holberg J. B., Ajello J. M., et al., 1979, Sci, 204, 979. doi:10.1126/science.204.4396.979
-
[17]
Clarke J. T., Moos H. W., Atreya S. K., Lane A. L., 1980, ApJL, 241, L179. doi:10.1086/183386
-
[18]
Clarke J. T., Ballester G. E., Trauger J., Evans R., Connerney J. E. P., Stapelfeldt K., Crisp D., et al., 1996, Sci, 274, 404. doi:10.1126/science.274.5286.404
-
[19]
T., Ben Jaffel L., G \'e rard J.-C., 1998, JGR, 103, 20217
Clarke J. T., Ben Jaffel L., G \'e rard J.-C., 1998, JGR, 103, 20217. doi:10.1029/98JE01130
-
[20]
T., Ajello J., Ballester G., Ben Jaffel L., Connerney J., G \'e rard J.-C., Gladstone G
Clarke J. T., Ajello J., Ballester G., Ben Jaffel L., Connerney J., G \'e rard J.-C., Gladstone G. R., et al., 2002, Natur, 415, 997. doi:10.1038/415997a
-
[21]
Connerney J. E. P., Acu \ n a M. H., Ness N. F., Satoh T., 1998, JGR, 103, 11929. doi:10.1029/97JA03726
-
[22]
Cowley S. W. H., Bunce E. J., 2001, P&SS, 49, 1067. doi:10.1016/S0032-0633(00)00167-7
-
[23]
Cowley S. W. H., Nichols J. D., Andrews D. J., 2007, AnGeo, 25, 1433. doi:10.5194/angeo-25-1433-2007
-
[24]
Cravens T. E., Howell E., Waite J. H., Gladstone G. R., 1995, JGR, 100, 17153. doi:10.1029/95JA00970
-
[25]
Cravens T. E., Waite J. H., Gombosi T. I., Lugaz N., Gladstone G. R., Mauk B. H., MacDowall R. J., 2003, JGRA, 108, 1465. doi:10.1029/2003JA010050
-
[26]
E., Clark J., Bhardwaj A., Elsner R., Waite J
Cravens T. E., Clark J., Bhardwaj A., Elsner R., Waite J. H., Maurellis A. N., Gladstone G. R., et al., 2006, JGRA, 111, A07308. doi:10.1029/2005JA011413
-
[27]
R., Branduardi-Raymont G., Elsner R
Dunn W. R., Branduardi-Raymont G., Elsner R. F., Vogt M. F., Lamy L., Ford P. G., Coates A. J., et al., 2016, JGRA, 121, 2274. doi:10.1002/2015JA021888
-
[28]
R., Branduardi-Raymont G., Ray L
Dunn W. R., Branduardi-Raymont G., Ray L. C., Jackman C. M., Kraft R. P., Elsner R. F., Rae I. J., et al., 2017, NatAs, 1, 758. doi:10.1038/s41550-017-0262-6
-
[29]
R., Branduardi-Raymont G., Carter-Cortez V., Campbell A., Elsner R., Ness J.-U., Gladstone G
Dunn W. R., Branduardi-Raymont G., Carter-Cortez V., Campbell A., Elsner R., Ness J.-U., Gladstone G. R., et al., 2020, JGRA, 125, e27219. doi:10.1029/2019JA027219
-
[30]
Dunn W. R., Gray R., Wibisono A. D., Lamy L., Louis C., Badman S. V., Branduardi-Raymont G., et al., 2020, JGRA, 125, e27222. doi:10.1029/2019JA027222
-
[31]
Dunn W. R., Weigt D. M., Grodent D., Yao Z. H., May D., Feigelman K., Sipos B., et al., 2022, GeoRL, 49, e97390. doi:10.1029/2021GL097390
-
[32]
F., Bhardwaj A., Waite J
Elsner R. F., Bhardwaj A., Waite J. H., Lugaz N., Majeed T., Cravens T., Gladstone G. R., et al., 2004, HEAD, 8, 05.10
2004
-
[33]
Elsner R. F., Lugaz N., Waite J. H., Cravens T. E., Gladstone G. R., Ford P., Grodent D., et al., 2005, JGRA, 110, A01207. doi:10.1029/2004JA010717
-
[34]
Fruscione A., McDowell J. C., Allen G. E., Brickhouse N. S., Burke D. J., Davis J. E., Durham N., et al., 2006, SPIE, 6270, 62701V. doi:10.1117/12.671760
-
[35]
Garmire G. P., Bautz M. W., Ford P. G., Nousek J. A., Ricker G. R., 2003, SPIE, 4851, 28. doi:10.1117/12.461599
-
[36]
Gerard J.-C., Dols V., Paresce F., Prange R., 1993, JGR, 98, 18793. doi:10.1029/93JE01334
-
[37]
T., Grard A., 2003, JGRA, 108, 1319
G \'e Rard J.-C., Gustin J., Grodent D., Clarke J. T., Grard A., 2003, JGRA, 108, 1319. doi:10.1029/2003JA009901
-
[38]
G \'e Rard J.-C., Saglam A., Grodent D., Clarke J. T., 2006, JGRA, 111, A04202. doi:10.1029/2005JA011327
-
[39]
G \'e rard J.-C., Bonfond B., Mauk B. H., Gladstone G. R., Yao Z. H., Greathouse T. K., Hue V., et al., 2019, JGRA, 124, 8298. doi:10.1029/2019JA026862
-
[40]
Gladstone G. R., Waite J. H., Lewis W. S., 1998, JGR, 103, 20083. doi:10.1029/98JE00737
-
[41]
Gladstone G. R., Waite J. H., Grodent D., Lewis W. S., Crary F. J., Elsner R. F., Weisskopf M. C., et al., 2002, Natur, 415, 1000. doi:10.1038/4151000a
-
[42]
Grodent D., Clarke J. T., Waite J. H., Cowley S. W. H., G \'e Rard J.-C., Kim J., 2003, JGRA, 108, 1366. doi:10.1029/2003JA010017
-
[43]
Gustin J., Grodent D., Ray L. C., Bonfond B., Bunce E. J., Nichols J. D., Ozak N., 2016, Icar, 268, 215. doi:10.1016/j.icarus.2015.12.048
-
[44]
Hui Y., Schultz D. R., Kharchenko V. A., Bhardwaj A., Branduardi-Raymont G., Stancil P. C., Cravens T. E., et al., 2010, JGRA, 115, A07102. doi:10.1029/2009JA014854
-
[45]
Jackman C. M., Knigge C., Altamirano D., Gladstone R., Dunn W., Elsner R., Kraft R., et al., 2018, JGRA, 123, 9204. doi:10.1029/2018JA025490
-
[46]
Kenter A. T., Chappell J. H., Kraft R. P., Meehan G. R., Murray S. S., Zombeck M. V., Hole K. T., et al., 2000, SPIE, 4012, 467. doi:10.1117/12.391585
-
[47]
Kharchenko V., Bhardwaj A., Dalgarno A., Schultz D. R., Stancil P. C., 2008, JGRA, 113, A08229. doi:10.1029/2008JA013062
-
[48]
V., Tao C., Yoshioka K., Murakami G., Yamazaki A., Tsuchiya F., et al., 2015, GeoRL, 42, 1662
Kimura T., Badman S. V., Tao C., Yoshioka K., Murakami G., Yamazaki A., Tsuchiya F., et al., 2015, GeoRL, 42, 1662. doi:10.1002/2015GL063272
-
[49]
Massa D., Fitzpatrick E. L., 2000, ApJS, 126, 517. doi:10.1086/313298
-
[50]
McEntee S. C., Jackman C. M., Weigt D. M., Dunn W. R., Kashyap V., Kraft R., Louis C. K., et al., 2022, JGRA, 127, e2022JA030971. doi:10.1029/2022JA030971
-
[51]
Metzger A. E., Luthey J. L., Gilman D. A., Hurley K. C., Schnopper H. W., Seward F. D., Sullivan J. D., 1983, JGR, 88, 7731. doi:10.1029/JA088iA10p07731
-
[52]
doi:10.1038/s41550-021-01594-8
Mori K., Hailey C., Bridges G., Mandel S., Garvin A., Grefenstette B., Dunn W., et al., 2022, NatAs, 6, 442. doi:10.1038/s41550-021-01594-8
-
[53]
Nichols J. S., Linsky J. L., 1996, AJ, 111, 517. doi:10.1086/117803
-
[54]
Nichols J. D., Cowley S. W. H., McComas D. J., 2006, AnGeo, 24, 393. doi:10.5194/angeo-24-393-2006
-
[55]
Ozak N., Cravens T. E., Schultz D. R., 2013, GeoRL, 40, 4144. doi:10.1002/grl.50812
-
[56]
Reynolds C. S., Brenneman L. W., Lohfink A. M., Trippe M. L., Miller J. M., Fabian A. C., Nowak M. A., 2012, ApJ, 755, 88. doi:10.1088/0004-637X/755/2/88
-
[57]
Sandel B. R., Shemansky D. E., Broadfoot A. L., Bertaux J. L., Blamont J. E., Belton M. J. S., Ajello J. M., et al., 1979, Sci, 206, 962. doi:10.1126/science.206.4421.962
-
[58]
doi:10.5194/angeo-26-3089-2008
Vr s nak B., 2008, AnGeo, 26, 3089. doi:10.5194/angeo-26-3089-2008
-
[59]
V., M \"o stl C., Vennerstrom S., Vrbanec D., 2010, A&A, 512, A43
Vr s nak B., Z ic T., Falkenberg T. V., M \"o stl C., Vennerstrom S., Vrbanec D., 2010, A&A, 512, A43. doi:10.1051/0004-6361/200913482
-
[60]
M., et al., 2014, ApJS, 213, 21
Vr s nak B., Temmer M., Z ic T., Taktakishvili A., Dumbovi \'c M., M \"o stl C., Veronig A. M., et al., 2014, ApJS, 213, 21. doi:10.1088/0067-0049/213/2/21
-
[61]
H., Bagenal F., Seward F., Na C., Gladstone G
Waite J. H., Bagenal F., Seward F., Na C., Gladstone G. R., Cravens T. E., Hurley K. C., et al., 1994, JGR, 99, 14799. doi:10.1029/94JA01005
-
[62]
Wanders I., Peterson B. M., Alloin D., Ayres T. R., Clavel J., Crenshaw D. M., Horne K., et al., 1997, ApJS, 113, 69. doi:10.1086/313054
-
[63]
D., Branduardi-Raymont G., Dunn W
Wibisono A. D., Branduardi-Raymont G., Dunn W. R., Coates A. J., Weigt D. M., Jackman C. M., Yao Z. H., et al., 2020, JGRA, 125, e27676. doi:10.1029/2019JA027676
-
[64]
D., Branduardi-Raymont G., Coates A
Wibisono A. D., Branduardi-Raymont G., Coates A. J., Dunn W. R., French R. J., 2023, MNRAS, 521, 5596. doi:10.1093/mnras/stad905
-
[65]
Weigt D. M., Jackman C. M., Moral Pombo D., Badman S. V., Louis C. K., Dunn W. R., McEntee S. C., et al., 2023, JGRA, 128, e2023JA031656. doi:10.1029/2023JA03165610.22541/essoar.168298676.61403547/v1
work page doi:10.1029/2023ja03165610.22541/essoar.168298676.61403547/v1 2023
-
[66]
M., Mann I., et al., 2024, SSRv, 220, 82
Yamauchi M., Christon S., Dandouras I., Haaland S., Kastinen D., Kistler L. M., Mann I., et al., 2024, SSRv, 220, 82. doi:10.1007/s11214-024-01114-w
-
[67]
Yelle R. V., Sandel B. R., Shemansky D. E., Kumar S., 1986, JGR, 91, 8756. doi:10.1029/JA091iA08p08756
-
[68]
Yoshikawa I., Yoshioka K., Murakami G., Yamazaki A., Tsuchiya F., Kagitani M., Sakanoi T., et al., 2014, SSRv, 184, 237. doi:10.1007/s11214-014-0077-z
-
[69]
doi:10.1088/0067-0049/218/2/32
Z ic T., Vr s nak B., Temmer M., 2015, ApJS, 218, 32. doi:10.1088/0067-0049/218/2/32
discussion (0)
Sign in with ORCID, Apple, or X to comment. Anyone can read and Pith papers without signing in.