Ranking football teams via the higher-order decomposition of performance networks
Pith reviewed 2026-06-26 11:26 UTC · model grok-4.3
The pith
A linear combination of Hodge-derived metric ratings, optimized per league, improves prediction of football standings over single metrics.
A machine-rendered reading of the paper's core claim, the machinery that carries it, and where it could break.
Core claim
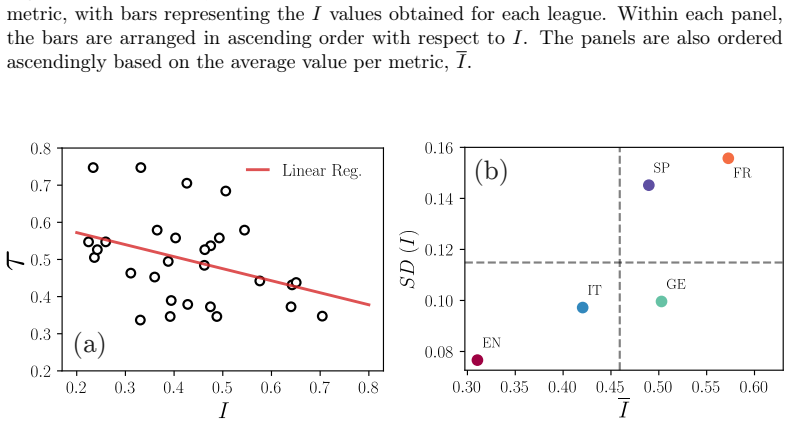
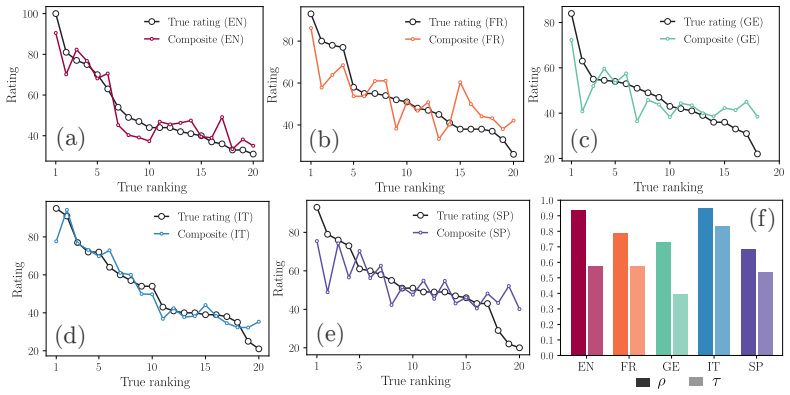
Metric-specific performance networks are constructed from relative indicators; their Hodge gradient components supply per-metric team ratings whose correlations with league position are strong yet league- and metric-dependent. The solenoidal-to-total energy ratio quantifies cyclic inconsistencies that structurally cap the gradient's ability to recover the observed hierarchy, mapping leagues into distinct regimes. A linear composite of these ratings, fitted league by league, increases predictive power and exposes the relative contribution of each performance indicator within each league's competitive structure.
What carries the argument
The gradient component extracted by Hodge decomposition of each metric-specific weighted performance network, which yields a potential whose differences approximate observed directed flows.
If this is right
- Each league possesses a characteristic solenoidal-to-total energy ratio that fingerprints its competition style.
- The composite rating quantifies the league-specific importance of different performance metrics.
- The framework supplies rankings that complement outcome-based tables by incorporating latent performance structure.
- The same network-plus-decomposition pipeline can be applied to other team sports with rich event logs.
Where Pith is reading between the lines
- Repeating the analysis on additional seasons would test whether the fitted metric weights remain stable or shift with tactical trends.
- When cycles dominate, alternative decompositions or inclusion of higher-order motifs might recover more of the ranking signal.
- The method could extend to ranking players within teams or to non-sport competitive systems that generate directed event data.
Load-bearing premise
Relative performance indicators from event data can be encoded as weighted graphs whose gradient component under Hodge decomposition reflects team strength even when cyclic flows are present.
What would settle it
Derive composite weights from one season's data and test whether those weights produce higher correlations with the next season's final table than any single metric or the official points system.
Figures

read the original abstract
We propose a unified methodological framework to quantify team performance in elite football by combining event-level performance metrics, higher-order network representations, and algebraic ranking methods. Using data from the 2017--2018 season of the five major European leagues, we construct metric-specific weighted graphs in which teams are connected through relative performance indicators. These graphs are analyzed via Hodge decomposition, and the gradient component is used to derive metric-based team ratings. The resulting rankings are systematically compared with the true league standings using Pearson and Kendall correlation measures, revealing strong metric- and league-dependent effects. Furthermore, by analyzing the ratio between solenoidal and total flow energies, we show that local cyclic dynamics structurally limit the gradient component's capacity to reconstruct the ranking. This topological inconsistency acts as a structural fingerprint of each league's ``competition style'' successfully mapping the studied systems into distinct regimes: highly hierarchical structures (England and Italy), tactical parity driven by generalized loops (Germany), and pockets of localized chaos (France and Spain). Lastly, we introduce a composite rating obtained as a parsimonious linear combination of metric-based ratings, optimized separately for each league. This composite approach significantly improves predictive power and allows the relative importance of different performance indicators to be quantified in a league-specific manner. Our results demonstrate how higher-order network methods provide a flexible and interpretable framework to uncover latent performance structures in football, offering a complementary perspective to outcome-based rankings and a general approach applicable to other oppositional sports.
Editorial analysis
A structured set of objections, weighed in public.
Referee Report
Summary. The paper constructs metric-specific weighted graphs from 2017-2018 event data in five major European football leagues, applies Hodge decomposition to extract gradient-based team ratings, compares these to league standings via Pearson and Kendall correlations, quantifies the limiting effect of solenoidal flows on ranking reconstruction, and introduces a league-specific linear combination of the metric ratings whose weights are optimized to maximize correlation with the same season's standings.
Significance. If the composite rating were shown to generalize beyond the fitting data, the approach would offer a network-based method to quantify the relative contribution of different performance indicators in a league-dependent way and to characterize competition styles via the solenoidal-to-total flow ratio. The Hodge decomposition step itself is standard and the mapping of leagues into hierarchical vs. cyclic regimes is potentially useful, but these strengths are currently undercut by the in-sample nature of the composite optimization.
major comments (3)
- [Abstract / composite rating paragraph] Abstract and the composite-rating section: the linear weights for the composite rating are optimized separately per league to improve Pearson/Kendall correlation with the 2017-2018 league table; because this optimization and the reported improvement are performed on the identical data used for evaluation, the claimed gain in predictive power is tautological for any non-trivial linear model and cannot be interpreted as evidence of genuine out-of-sample improvement or of league-specific indicator importance.
- [Abstract] Abstract: no error bars, bootstrap intervals, or sample-size information are supplied for the reported Pearson and Kendall correlations, nor is any temporal hold-out, cross-validation, or subsequent-season test described; without these, it is impossible to assess whether the metric-based or composite rankings outperform a null model or the raw standings.
- [solenoidal flow analysis paragraph] The claim that the solenoidal-to-total flow ratio acts as a 'structural fingerprint' of league style is presented as a finding, yet the paper provides no statistical test that this ratio differs significantly across leagues after accounting for the number of teams and matches; the mapping of England/Italy as hierarchical, Germany as loop-driven, and France/Spain as chaotic therefore rests on visual or qualitative inspection rather than a quantified result.
minor comments (2)
- [Methods] Notation for the Hodge decomposition (gradient vs. solenoidal components) should be introduced with explicit equations rather than descriptive text only.
- [Data description] The manuscript should state the exact number of matches and events per league and per metric so that readers can judge the effective sample size underlying each correlation.
Simulated Author's Rebuttal
We thank the referee for the constructive comments that highlight key limitations in the current presentation. We have revised the manuscript to clarify the in-sample character of the composite optimization, to add bootstrap intervals for the reported correlations, and to qualify the solenoidal-ratio mapping as exploratory. We address each point below.
read point-by-point responses
-
Referee: [Abstract / composite rating paragraph] Abstract and the composite-rating section: the linear weights for the composite rating are optimized separately per league to improve Pearson/Kendall correlation with the 2017-2018 league table; because this optimization and the reported improvement are performed on the identical data used for evaluation, the claimed gain in predictive power is tautological for any non-trivial linear model and cannot be interpreted as evidence of genuine out-of-sample improvement or of league-specific indicator importance.
Authors: We agree that the optimization is performed on the same season's data and that the reported improvement cannot be interpreted as out-of-sample predictive gain. The composite was intended only to illustrate league-dependent metric contributions in an exploratory, in-sample sense. We have revised the abstract and the composite-rating section to remove all references to 'predictive power' and to state explicitly that the weights and the resulting correlation improvement are in-sample. revision: yes
-
Referee: [Abstract] Abstract: no error bars, bootstrap intervals, or sample-size information are supplied for the reported Pearson and Kendall correlations, nor is any temporal hold-out, cross-validation, or subsequent-season test described; without these, it is impossible to assess whether the metric-based or composite rankings outperform a null model or the raw standings.
Authors: We accept that uncertainty quantification is needed. Bootstrap confidence intervals for the Pearson and Kendall correlations will be added to the revised manuscript. However, the study is a single-season descriptive analysis; temporal hold-out, cross-validation, or subsequent-season tests would require additional seasons' data that are outside the present scope. revision: partial
-
Referee: [solenoidal flow analysis paragraph] The claim that the solenoidal-to-total flow ratio acts as a 'structural fingerprint' of league style is presented as a finding, yet the paper provides no statistical test that this ratio differs significantly across leagues after accounting for the number of teams and matches; the mapping of England/Italy as hierarchical, Germany as loop-driven, and France/Spain as chaotic therefore rests on visual or qualitative inspection rather than a quantified result.
Authors: We acknowledge that the league mapping rests on the computed ratios and qualitative comparison rather than a formal statistical test. With only five leagues, any test that also accounts for differing numbers of teams and matches has limited power. In the revision we will report the exact ratio values, describe the mapping as exploratory, and add a brief discussion of the small-sample limitation. revision: partial
- Out-of-sample evaluation (temporal hold-out, cross-validation, or subsequent-season tests) cannot be performed without additional seasons' data beyond the single 2017-2018 season used in the study.
Circularity Check
Composite rating weights fitted in-sample to 2017-2018 league standings make reported predictive gain tautological
specific steps
-
fitted input called prediction
[Abstract (final paragraph)]
"Lastly, we introduce a composite rating obtained as a parsimonious linear combination of metric-based ratings, optimized separately for each league. This composite approach significantly improves predictive power and allows the relative importance of different performance indicators to be quantified in a league-specific manner."
The linear weights are chosen by optimizing correlation with the 2017-2018 league table on the identical data used for all prior metric ratings and for the final evaluation. The claimed improvement in predictive power is therefore the direct numerical consequence of the in-sample fit rather than an out-of-sample test.
full rationale
The paper constructs metric-specific graphs from 2017-2018 event data, applies Hodge decomposition to extract gradient ratings, and compares them to the same season's final standings via Pearson/Kendall correlation. It then introduces a linear combination whose league-specific weights are optimized to improve those same correlations. Because the optimization target and the evaluation target are identical and drawn from the identical dataset, any reported improvement is guaranteed by the fitting step itself and does not constitute an independent prediction. No cross-validation, temporal hold-out, or out-of-sample season is described in the provided text. The core Hodge-gradient construction itself shows no circular reduction; the circularity is isolated to the composite-rating claim.
Axiom & Free-Parameter Ledger
free parameters (1)
- linear combination weights for composite rating
axioms (1)
- domain assumption Event-level performance metrics can be aggregated into relative performance indicators that form weighted graphs between teams.
Reference graph
Works this paper leans on
-
[1]
Fragility of chess positions: Measure, universality, and tipping points.Physical Review E, 111(1):014314, 2025
Marc Barthelemy. Fragility of chess positions: Measure, universality, and tipping points.Physical Review E, 111(1):014314, 2025
2025
-
[2]
Safe leads and lead changes in competitive team sports.Physical Review E, 91(6):062815, 2015
A Clauset, M Kogan, and S Redner. Safe leads and lead changes in competitive team sports.Physical Review E, 91(6):062815, 2015
2015
-
[3]
Javier M Buldú, Javier Busquets, Ignacio Echegoyen, and F Seirul. lo. Defining a historic football team: Using network science to analyze guardiola’s fc barcelona.Scientific reports, 9(1):13602, 2019
2019
-
[4]
Anoma- lous diffusion and long-range correlations in the score evolution of the game of cricket.Physical Review E, 86(2):022102, 2012
Haroldo V Ribeiro, Satyam Mukherjee, and Xiao Han T Zeng. Anoma- lous diffusion and long-range correlations in the score evolution of the game of cricket.Physical Review E, 86(2):022102, 2012
2012
-
[5]
Simple mechanism rules the dynamics of volleyball
Andrés Chacoma and Orlando V Billoni. Simple mechanism rules the dynamics of volleyball. Journal of Physics: Complexity, 3(3):035006, 2022
2022
-
[6]
Probabilistic model for padel games dynamics
Andrés Chacoma and Orlando V Billoni. Probabilistic model for padel games dynamics. Chaos, Solitons & Fractals, 174:113784, 2023
2023
-
[7]
Emergent complexity in the decision-makingprocessofchess players
Andrés Chacoma and Orlando V Billoni. Emergent complexity in the decision-makingprocessofchess players. ScientificReports, 15(1):23234, 2025
2025
-
[8]
On the role of chance in fencing tournaments: An agent-based approach
Chiara Zappalá, Alessandro Pluchino, Andrea Rapisarda, Alessio Emanuele Biondo, and Pawel Sobkowicz. On the role of chance in fencing tournaments: An agent-based approach. Plos one, 17(5):e0267541, 2022
2022
-
[9]
The relative age effect in under-18 basketball: Effects on perfor- mance according to playing position.PloS one, 13(7):e0200408, 2018
Sergio J Ibáñez, Aitor Mazo, Juarez Nascimento, and Javier García- Rubio. The relative age effect in under-18 basketball: Effects on perfor- mance according to playing position.PloS one, 13(7):e0200408, 2018
2018
-
[10]
Using markov chains to identify player’s performance in bad- minton
Javier Galeano, Miguel-Ángel Gómez, Fernando Rivas, and Javier M Buldú. Using markov chains to identify player’s performance in bad- minton. Chaos, Solitons & Fractals, 165:112828, 2022. 25
2022
-
[11]
Sports teams as complex adaptive systems: manipulating player numbers shapes behaviours during football small-sided games
Pedro Silva, Luís Vilar, Keith Davids, Duarte Araújo, and Júlio Gar- ganta. Sports teams as complex adaptive systems: manipulating player numbers shapes behaviours during football small-sided games. SpringerPlus, 5(1):191, 2016
2016
-
[12]
Understanding a player’s decision-making process in team sports: a systematic review of empirical evidence.Sports, 9(5):65, 2021
Michael Ashford, Andrew Abraham, and Jamie Poolton. Understanding a player’s decision-making process in team sports: a systematic review of empirical evidence.Sports, 9(5):65, 2021
2021
-
[13]
Spatial and tem- poral entropies in the spanish football league: A network science per- spective
Johann H Martínez, David Garrido, José L Herrera-Diestra, Javier Bus- quets, Ricardo Sevilla-Escoboza, and Javier M Buldú. Spatial and tem- poral entropies in the spanish football league: A network science per- spective. Entropy, 22(2):172, 2020
2020
-
[14]
Footballplayers’strengthtrainingmethodusingimageprocessing based on machine learning.Plos one, 18(6):e0287433, 2023
Xiaoxiang Cao, Xiaodong Zhao, Huan Tang, Nianchun Fan, and Fateh Zereg. Footballplayers’strengthtrainingmethodusingimageprocessing based on machine learning.Plos one, 18(6):e0287433, 2023
2023
-
[15]
Theory and data analysis of player and team ball possession time in football.Physical Review E, 109(1):014305, 2024
Ken Yamamoto, Seiya Uezu, Keiichiro Kagawa, Yoshihiro Yamazaki, and Takuma Narizuka. Theory and data analysis of player and team ball possession time in football.Physical Review E, 109(1):014305, 2024
2024
-
[16]
Modeling ball possession dynamics in the game of football
A Chacoma, Nahuel Almeira, Juan Ignacio Perotti, and Orlando Vito Billoni. Modeling ball possession dynamics in the game of football. Physical Review E, 102(4):042120, 2020
2020
-
[17]
Stochastic model for football’s collective dynamics.Physical Review E, 104(2):024110, 2021
A Chacoma, N Almeira, JI Perotti, and OV Billoni. Stochastic model for football’s collective dynamics.Physical Review E, 104(2):024110, 2021
2021
-
[18]
Data-driven approach to defining football styles in major leagues
Andres Chacoma and Orlando V Billoni. Data-driven approach to defining football styles in major leagues. Chaos, Solitons & Fractals, 200:116926, 2025
2025
-
[19]
Charac- terizing the spatial structures of competing football teams
Guy Amichay, Hugo Silva, João Brito, and Rui Marcelino. Charac- terizing the spatial structures of competing football teams. Scientific Reports, 15(1):35217, 2025
2025
-
[20]
Passing networks and tactical action in football: A systematic review
Sergio Caicedo-Parada, Carlos Lago-Peñas, and Enrique Ortega-Toro. Passing networks and tactical action in football: A systematic review. 26 International Journal of Environmental Research and Public Health, 17(18):6649, 2020
2020
-
[21]
Robust- ness of football passing networks against continuous node and link re- movals
Genki Ichinose, Tomohiro Tsuchiya, and Shunsuke Watanabe. Robust- ness of football passing networks against continuous node and link re- movals. Chaos, Solitons & Fractals, 147:110973, 2021
2021
-
[22]
Exploring team passing networks and player movement dynamics in youth association football.PloS one, 12(1):e0171156, 2017
Bruno Gonçalves, Diogo Coutinho, Sara Santos, Carlos Lago-Penas, Ser- gio Jiménez, and Jaime Sampaio. Exploring team passing networks and player movement dynamics in youth association football.PloS one, 12(1):e0171156, 2017
2017
-
[23]
Complexity emerges in measures of the marking dynamics in football games.Physical Review E, 106(4):044308, 2022
A Chacoma, OV Billoni, and MN Kuperman. Complexity emerges in measures of the marking dynamics in football games.Physical Review E, 106(4):044308, 2022
2022
-
[24]
Identification and optimization of high-performance passing networks in football.Physical Review E, 111(4):044313, 2025
Andrés Chacoma. Identification and optimization of high-performance passing networks in football.Physical Review E, 111(4):044313, 2025
2025
-
[25]
Motif analysis and pass- ing behavior in football passing networks.Chaos, Solitons & Fractals, 190:115750, 2025
Ming-Xia Li, Li-Gong Xu, and Wei-Xing Zhou. Motif analysis and pass- ing behavior in football passing networks.Chaos, Solitons & Fractals, 190:115750, 2025
2025
-
[26]
Using a bayesian network to classify time to return to sport based on football injury epidemiological data.PloS one, 20(3):e0314184, 2025
Kate KY Yung, Paul PY Wu, Karen aus der Fünten, Anne Heckst- eden, and Tim Meyer. Using a bayesian network to classify time to return to sport based on football injury epidemiological data.PloS one, 20(3):e0314184, 2025
2025
-
[27]
Rank analysis of incomplete block designs: I
RA Bradley and ME Terry. Rank analysis of incomplete block designs: I. The method of paired comparisons.Biometrika, 39(3/4):324–337, 1952
1952
-
[28]
Statistical ranking and combinatorial hodge theory.Mathematical Programming, 127(1):203–244, 2011
Xiaoye Jiang, Lek-Heng Lim, Yuan Yao, and Yinyu Ye. Statistical ranking and combinatorial hodge theory.Mathematical Programming, 127(1):203–244, 2011
2011
-
[29]
Juan I. Perotti. Analysis of the inference of ratings and rankings in com- plex networks using discrete exterior calculus on higher-order networks. Phys. Rev. E, 111:034306, Mar 2025
2025
-
[30]
A public data 27 set of spatio-temporal match events in soccer competitions.Scientific data, 6(1):236, 2019
Luca Pappalardo, Paolo Cintia, Alessio Rossi, Emanuele Massucco, Paolo Ferragina, Dino Pedreschi, and Fosca Giannotti. A public data 27 set of spatio-temporal match events in soccer competitions.Scientific data, 6(1):236, 2019
2019
-
[31]
McRobert
Javier Fernandez-Navarro, Luis Fradua, Asier Zubillaga, and Allistair P. McRobert. Influence of contextual variables on styles of play in soccer. International Journal of Performance Analysis in Sport, 18(3):423–436, 2018
2018
-
[32]
Grady and Jonathan R
Leo J. Grady and Jonathan R. Polimeni.Discrete Calculus: Applied Analysis on Graphs for Computational Science. Springer, 2010
2010
-
[33]
Hodge laplacians on graphs.SIAM Review, 62(3):685– 715, 2020
Lek-Heng Lim. Hodge laplacians on graphs.SIAM Review, 62(3):685– 715, 2020
2020
-
[34]
Higher-Order Networks
Ginestra Bianconi. Higher-Order Networks. Elements in the Structure and Dynamics of Complex Networks. Cambridge University Press, 2021
2021
-
[35]
A new measure of rank correlation
Maurice G Kendall. A new measure of rank correlation. Biometrika, 30(1-2):81–93, 1938
1938
-
[36]
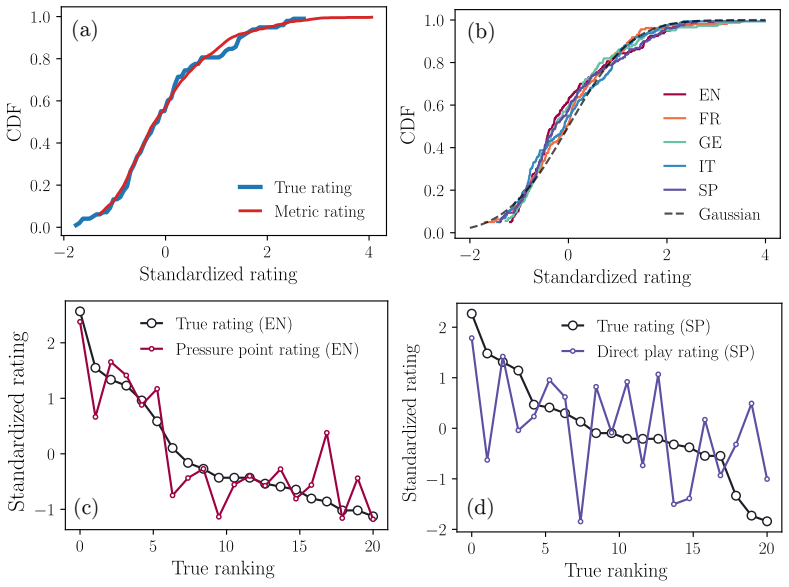
Arpad E. Elo. The Rating of Chess Players, Past and Present. Arco Publishing, New York, 1978. 28 (a) (b) Figure 1: Statistics of the true rating. (a) Comparison between the cumulative distribution function (CDF) of the true rating values and the distribution obtained from the proposed model. (b) Relationship between the empirical quantiles and those obtai...
1978
discussion (0)
Sign in with ORCID, Apple, or X to comment. Anyone can read and Pith papers without signing in.