Application of Machine Learning for the Identification of 2D Colloidal Assemblies: A Case Study on Particles of Distinct Shapes
Pith reviewed 2026-06-26 06:17 UTC · model grok-4.3
The pith
Machine learning models trained only on synthetic images produce 43 percent average error when identifying real colloidal particle assemblies.
A machine-rendered reading of the paper's core claim, the machinery that carries it, and where it could break.
Core claim
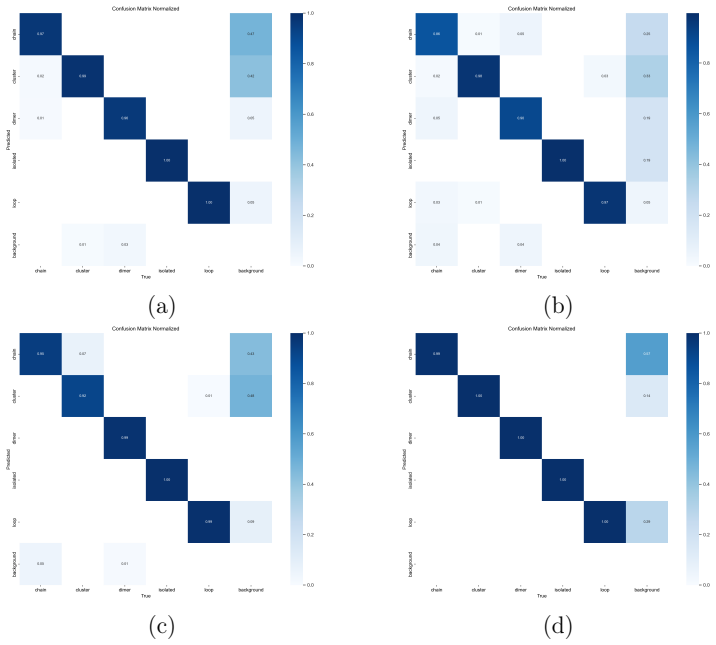
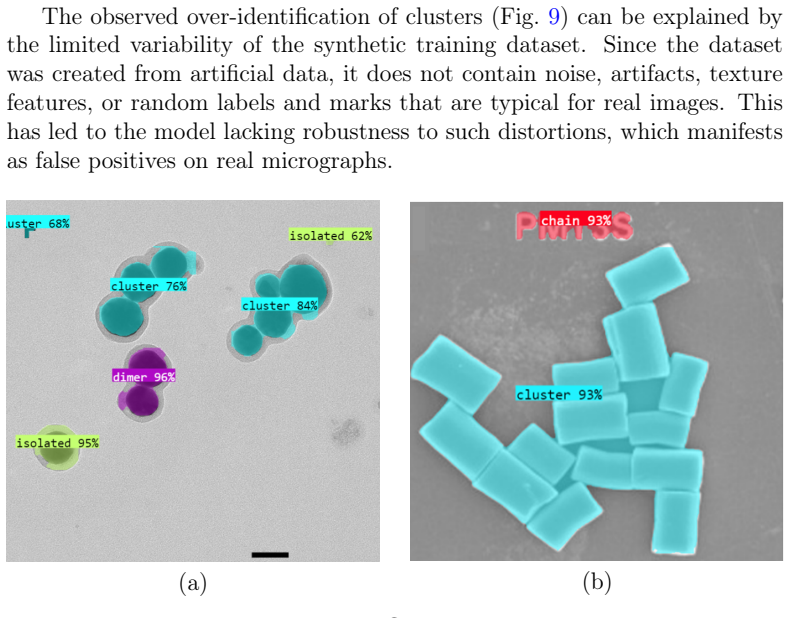
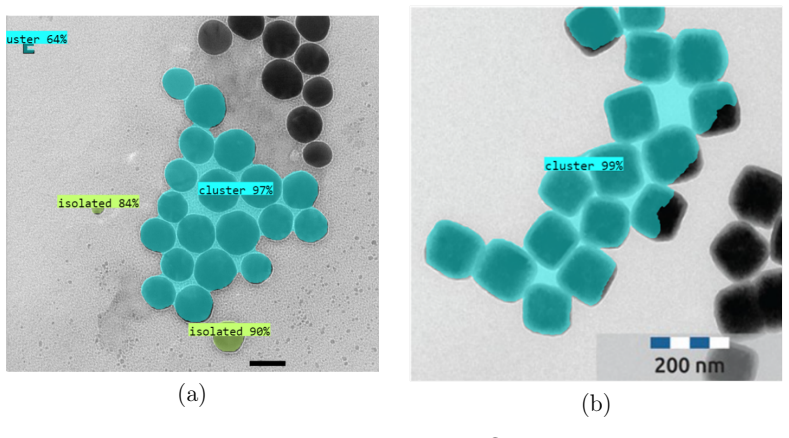
Models trained exclusively on synthetic datasets achieve near-perfect recognition on artificial images but exhibit an average error of 43.1 percent when applied to experimental images of colloidal assemblies, with errors ranging from 20 percent for spheres to 58.5 percent for cuboids.
What carries the argument
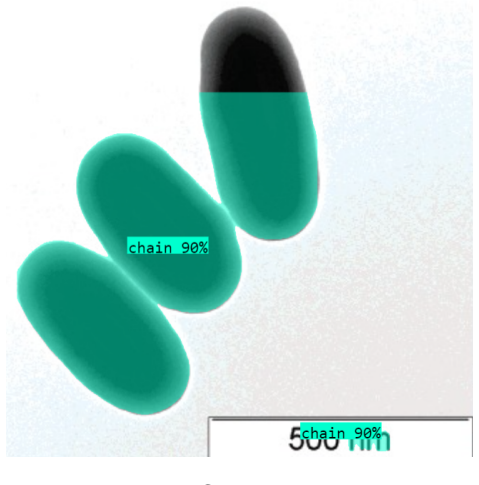
The YOLO object detection model trained on shape-specific synthetic datasets to classify colloidal configurations into isolated particles, dimers, chains, clusters, and loops.
If this is right
- Recognition performance degrades significantly when moving from synthetic to experimental images.
- Error rates depend on particle geometry, lowest for spheres and highest for cuboids.
- Preparing datasets based on experimental images is required to improve prediction accuracy.
- The trained models and synthetic datasets are released for public use in an information system.
Where Pith is reading between the lines
- Domain adaptation methods that align synthetic and real image distributions could reduce the observed transfer gap.
- Particle shape may serve as a predictor for how much real data is needed to reach usable accuracy.
- The released models provide a baseline for testing whether mixed synthetic-real training sets close the performance difference.
Load-bearing premise
Models trained exclusively on synthetic datasets can feasibly recognize configurations in real experimental images.
What would settle it
Retraining the models on datasets that include experimental images and measuring the resulting error rate on a held-out set of experimental images; an average error remaining near 43 percent would confirm the reported limitation of synthetic-only training.
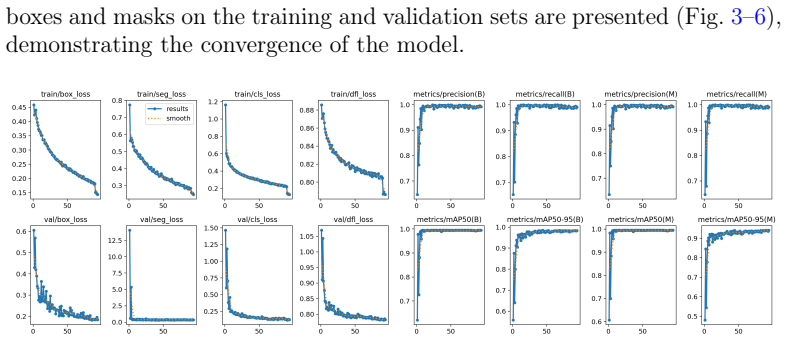
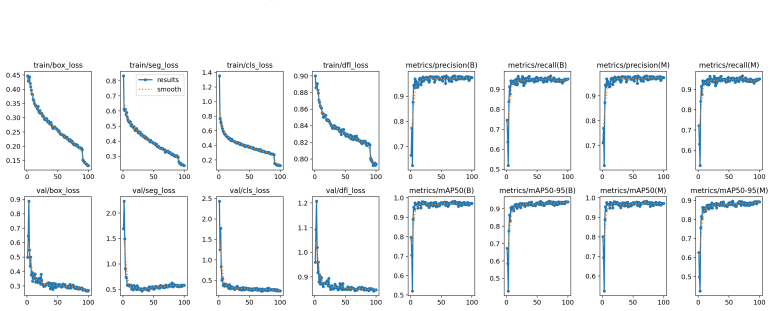
Figures
read the original abstract
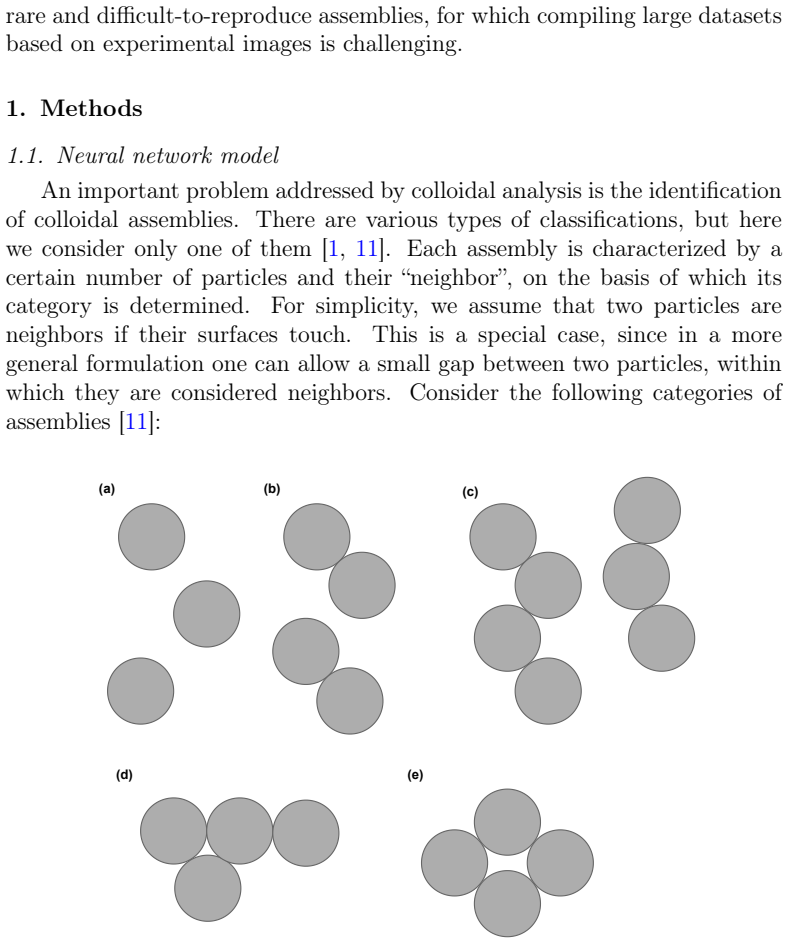
This work addresses the problem of identifying colloidal monolayer assemblies using particles of various shapes (two-dimensional coatings): spheres, ellipsoids, cuboids, and rods. The following classification of assemblies is considered: isolated particles, dimers, chains, clusters, and loops. The YOLO model was chosen as the identification method. Synthetic datasets were prepared for each of the four particle shapes to train the models. The paper discusses the application of models trained on synthetic data to experimental images. An analysis was carried out on the feasibility of using such models for recognizing configurations in real images. While recognition on artificial images is nearly perfect, tests on experimental images showed a significant deviation. The average error across all particle types was 43.1%, but a considerable spread in values is observed: from 20% for spheres to 58.5% for cuboids, indicating the algorithm's selective sensitivity to object geometry. The created datasets and trained models are freely available for use. The corresponding modules have been integrated into the previously developed information system (https://isanm.space/). To further improve prediction results, it is necessary to prepare datasets based on experimental images.
Editorial analysis
A structured set of objections, weighed in public.
Referee Report
Summary. The manuscript applies YOLO models to identify 2D colloidal monolayer assemblies (isolated particles, dimers, chains, clusters, loops) for four particle shapes (spheres, ellipsoids, cuboids, rods). Models are trained solely on synthetic image datasets generated for each shape. The central result is that recognition is nearly perfect on held-out synthetic test images, but application to experimental images produces an average error of 43.1% (ranging from 20% for spheres to 58.5% for cuboids). The authors interpret this as evidence of selective sensitivity to object geometry, conclude that experimental training data are required, and release the synthetic datasets, trained models, and integrated modules for an existing information system (https://isanm.space/).
Significance. If the reported performance gap is substantiated, the work supplies a concrete, quantitative demonstration of the synthetic-to-real domain shift in colloidal image analysis. This is useful for the soft-matter community because it directly motivates the collection of labeled experimental datasets rather than relying on simulation alone. The open release of datasets and models, together with integration into an existing platform, is a clear strength that supports reproducibility and extension by others.
major comments (1)
- [Abstract] Abstract and results sections: The error rates on experimental images (average 43.1%, 20% spheres to 58.5% cuboids) are the load-bearing evidence for the central claim of significant deviation and geometry-dependent sensitivity. The manuscript does not define the error metric (e.g., per-particle classification error, assembly-level mismatch, or detection IoU threshold), the number of experimental images or particles evaluated, or any baseline comparison (e.g., to human annotation accuracy or conventional image-processing methods). These omissions leave the quantitative claim defensible but not fully substantiated.
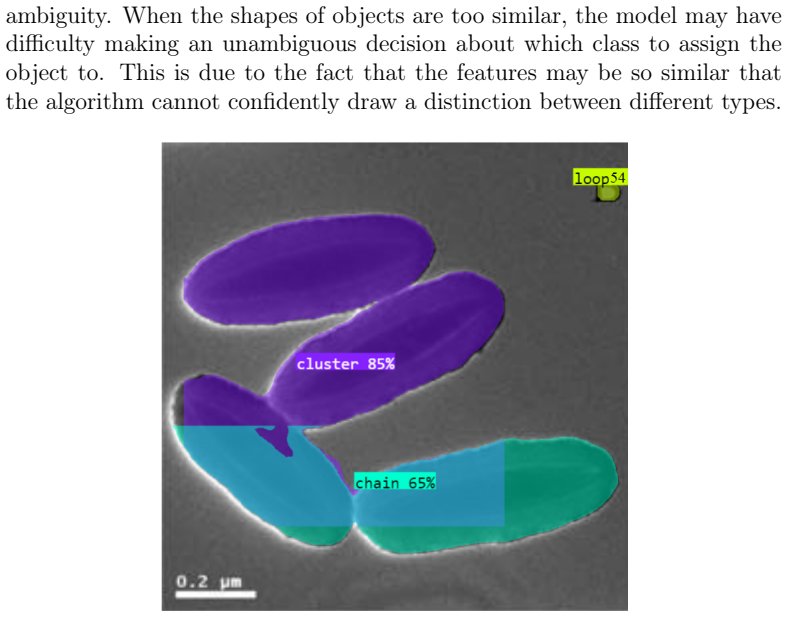
minor comments (1)
- [Methods] The description of the five assembly classes (isolated particles, dimers, chains, clusters, loops) would benefit from a supplementary figure showing representative labeled examples for each class and shape to improve clarity and reproducibility.
Simulated Author's Rebuttal
We thank the referee for the careful review and for recognizing the value of our quantitative demonstration of the synthetic-to-real domain shift. We address the single major comment below and will revise the manuscript to address the noted omissions.
read point-by-point responses
-
Referee: [Abstract] Abstract and results sections: The error rates on experimental images (average 43.1%, 20% spheres to 58.5% cuboids) are the load-bearing evidence for the central claim of significant deviation and geometry-dependent sensitivity. The manuscript does not define the error metric (e.g., per-particle classification error, assembly-level mismatch, or detection IoU threshold), the number of experimental images or particles evaluated, or any baseline comparison (e.g., to human annotation accuracy or conventional image-processing methods). These omissions leave the quantitative claim defensible but not fully substantiated.
Authors: We agree that the manuscript does not explicitly define the error metric, report the scale of the experimental evaluation, or provide baseline comparisons, and that these details are required to fully substantiate the central quantitative claims. In the revised manuscript we will add, in both the abstract and results sections: a precise definition of the error metric, the number of experimental images and particles evaluated, and comparisons against human annotation accuracy as well as conventional image-processing methods. These additions will be made without altering the reported error values. revision: yes
Circularity Check
No significant circularity
full rationale
The paper is an empirical case study reporting measured recognition performance of YOLO models. Synthetic datasets are generated to train the models; held-out synthetic test images yield near-perfect accuracy while experimental images yield 20–58.5 % error (average 43.1 %). These numbers are direct empirical measurements on separate image sets; no equations, fitted parameters, derivations, or self-citation chains are invoked to obtain the central results. The recommendation to collect experimental training data follows directly from the observed gap rather than from any internal reduction to the training inputs. The work is therefore self-contained against external benchmarks.
Axiom & Free-Parameter Ledger
Reference graph
Works this paper leans on
-
[1]
V. Lotito, T. Zambelli, Approaches to self-assembly of colloidal mono- layers: A guide for nanotechnologists, Advances in Colloid and Interface Science 246 (2017) 217–274.doi:10.1016/j.cis.2017.04.003
-
[2]
M. A. Klatt, J. Lovrić, D. Chen, S. C. Kapfer, F. M. Schaller, P. W. A. Schönhöfer, B. S. Gardiner, A.-S. Smith, G. E. Schröder- Turk, S. Torquato, Universal hidden order in amorphous cellular ge- ometries, Nature Communications 10 (1) (Feb. 2019).doi:10.1038/ s41467-019-08360-5
2019
-
[3]
A. Pal, A. Gope, Texture identification in liquid crystal-protein droplets using evaporative drying, generalized additive modeling, and K-means Clustering, The European Physical Journal E 47 (5) (May 2024).doi: 10.1140/epje/s10189-024-00429-4. 19
-
[4]
A. Pal, A. Gope, M. Yanagisawa, From droplet to diagnosis: spatio- temporal pattern recognition in drying biofluids, Advanced Intelligent Systems 8 (2) (Nov. 2025).doi:10.1002/aisy.202500550
-
[5]
W. Mickel, S. C. Kapfer, G. E. Schröder-Turk, K. Mecke, Shortcomings of the bond orientational order parameters for the analysis of disordered particulate matter, The Journal of Chemical Physics 138 (4) (Jan. 2013). doi:10.1063/1.4774084
-
[6]
D. Sukhoverkhova, V. Mozolenko, L. Shchur, Phase probabilities in first- order transitions using machine learning, Physical Review E 112 (4) (Oct. 2025).doi:10.1103/h9cg-cc4r
-
[7]
A. W. Long, A. L. Ferguson, Nonlinear machine learning of patchy col- loid self-assembly pathways and mechanisms, The Journal of Physical Chemistry B 118 (15) (2014) 4228–4244.doi:10.1021/jp500350b
-
[8]
H. Carstensen, V. Kapaklis, M. Wolff, Statistical analysis of phase for- mation in 2D colloidal systems, The European Physical Journal E 41 (1) (Jan. 2018).doi:10.1140/epje/i2018-11615-x
-
[9]
J. M. Newby, A. M. Schaefer, P. T. Lee, M. G. Forest, S. K. Lai, Convo- lutional neural networks automate detection for tracking of submicron- scale particles in 2D and 3D, Proceedings of the National Academy of Sciences 115 (36) (2018) 9026–9031.doi:10.1073/pnas.1804420115
-
[10]
E. Boattini, M. Dijkstra, L. Filion, Unsupervised learning for local struc- ture detection in colloidal systems, The Journal of Chemical Physics 151 (15) (Oct. 2019).doi:10.1063/1.5118867
-
[11]
V. Lotito, T. Zambelli, A journey through the landscapes of small parti- cles in binary colloidal assemblies: Unveiling structural transitions from isolated particles to clusters upon variation in composition, Nanomate- rials 9 (7) (2019) 921.doi:10.3390/nano9070921
-
[12]
Y. Shi, L. Liu, J. Huang, J. Xiong, S. Zhong, G. Zhu, X. Li, Z. He, T. Pan, H. Xin, B. Li, Adaptive opto-thermal-hydrodynamic manipula- tion and polymerization (AOTHMAP) for 4D colloidal patterning, Ad- vanced Materials 36 (52) (Nov. 2024).doi:10.1002/adma.202412895. 20
-
[13]
2026).doi:10.1140/epje/ s10189-026-00560-4
L.T.Khusainova, K.S.Kolegov, Identificationof2Dcolloidalassemblies in images: a threshold processing method versus machine learning, The European Physical Journal E 49 (3) (Feb. 2026).doi:10.1140/epje/ s10189-026-00560-4
-
[14]
Roboflow, Roboflow: Computer vision tools for developers and enter- prises,https://roboflow.com, accessed on 15 January 2024 (2025)
I. Roboflow, Roboflow: Computer vision tools for developers and enter- prises,https://roboflow.com, accessed on 15 January 2024 (2025)
2024
-
[15]
L. T. Khusainova, S. A. Kolegova, K. S. Kolegov, Colloidal cluster analysis, gPL-3.0 licence (2026). URLhttps://github.com/prelydia/colloidal-cluster-analysis-of-different-shapes. git
2026
-
[16]
R. T. Busch, F. Karim, J. Weis, Y. Sun, C. Zhao, E. S. Vasquez, Op- timization and structural stability of gold nanoparticle–antibody bio- conjugates, ACS Omega 4 (12) (2019) 15269–15279.doi:10.1021/ acsomega.9b02276
2019
-
[17]
M. Li, J. Guo, C. Zhang, Y. Che, Y. Yi, B. Liu, Uniform col- loidal polymer rods by stabilizer-assisted liquid-crystallization-driven self-assembly, Angewandte Chemie International Edition 62 (49) (Oct. 2023).doi:10.1002/anie.202309914
-
[18]
M. Rosenberg, F. Dekker, J. G. Donaldson, A. P. Philipse, S. S. Kan- torovich, Self-assembly of charged colloidal cubes, Soft Matter 16 (18) (2020) 4451–4461.doi:10.1039/c9sm02189b
-
[19]
S. Sacanna, L. Rossi, B. W. M. Kuipers, A. P. Philipse, Fluorescent monodisperse silica ellipsoids for optical rotational diffusion studies, Langmuir 22 (4) (2006) 1822–1827.doi:10.1021/la052484o
-
[20]
L. Li, D. Qin, X. Yang, G. Liu, Synthesis of ellipsoidal hematite/polymer/titania hybrid materials and the corresponding hol- low ellipsoidal particles, Polym. Chem. 1 (3) (2010) 289–295.doi: 10.1039/b9py00230h
-
[21]
P. Fränti, R. Mariescu-Istodor, Soft precision and recall, Pattern Recog- nition Letters 167 (2023) 115–121.doi:10.1016/j.patrec.2023.02. 005. 21
-
[22]
L. T. Khusainova, K. S. Kolegov, Information system for analy- sis of nanostructure morphology: education and research, Interna- tional Journal of Information Technology (Jul. 2025).doi:10.1007/ s41870-025-02658-y. 22
2025
discussion (0)
Sign in with ORCID, Apple, or X to comment. Anyone can read and Pith papers without signing in.