Interferometric HI Intensity Mapping of the Late Time Universe with SKA-Mid
Pith reviewed 2026-06-25 23:08 UTC · model grok-4.3
The pith
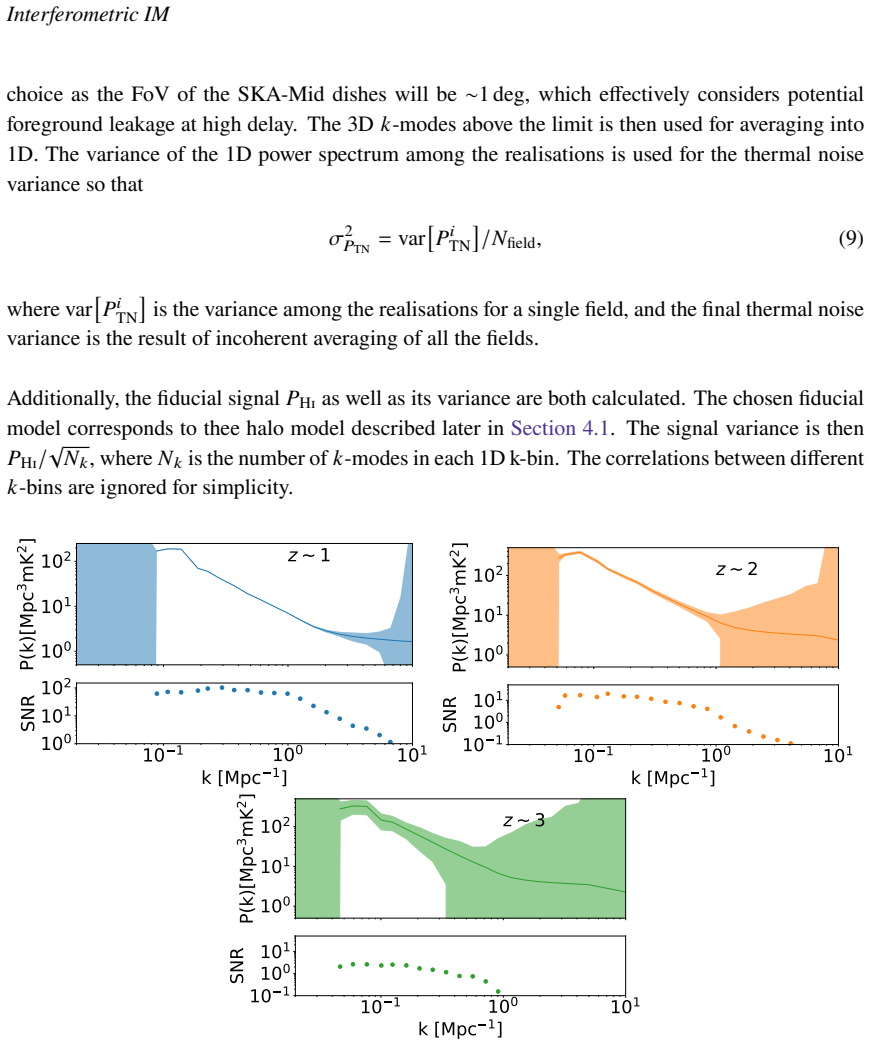
SKA-Mid AA4 is forecasted to measure the HI power spectrum with high significance from redshift 1 to 3 at nonlinear scales near 1 Mpc^{-1}.
A machine-rendered reading of the paper's core claim, the machinery that carries it, and where it could break.
Core claim
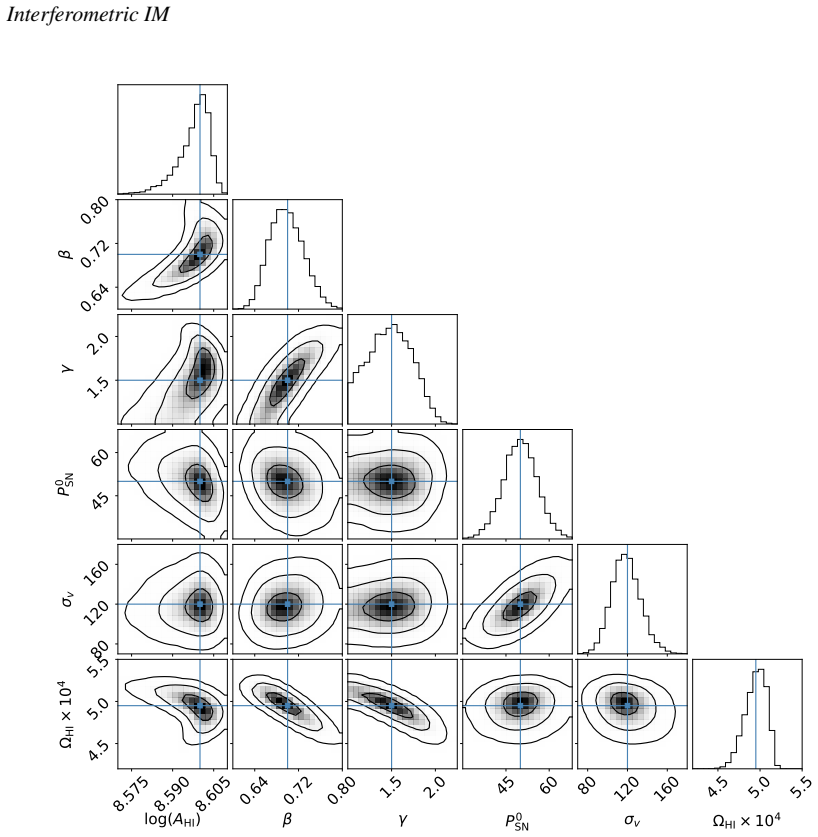
The paper states that the interferometric methodology validated on MeerKAT data can be applied to SKA-Mid, with forecasts indicating that SKA-Mid AA4 will measure the HI power spectrum at high statistical significance across z ~ 1.0 to z ~ 3.0 near k ~ 1.0 Mpc^{-1}. These measurements can constrain the properties of HI galaxies and thereby provide a novel probe of galaxy evolution in the interval 1.0 ≲ z ≲ 3.0.
What carries the argument
Interferometric extraction of the 21 cm HI power spectrum at small angular separations, extended from MeerKAT validation to SKA-Mid forecasts.
If this is right
- High-significance HI power spectrum measurements become available from z ~ 1 to z ~ 3 at nonlinear scales.
- These measurements directly constrain the clustering and abundance properties of HI galaxies.
- A new observational route opens for studying galaxy evolution through the neutral hydrogen content at 1 ≲ z ≲ 3.
- The same data set supplies a large-scale structure tracer independent of optical galaxy surveys.
Where Pith is reading between the lines
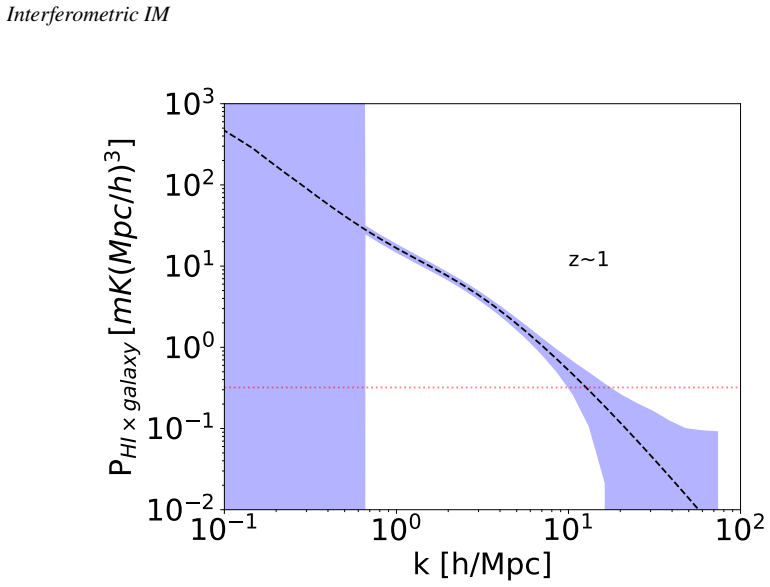
- The forecasts imply that SKA-Mid data could be combined with other tracers to separate astrophysical from cosmological signals in the same redshift range.
- If the measurements succeed, they would allow direct tests of models for how neutral gas is distributed inside galaxies at cosmic noon.
- The approach could be extended to cross-correlations with other intensity mapping experiments or galaxy surveys once SKA-Mid data arrive.
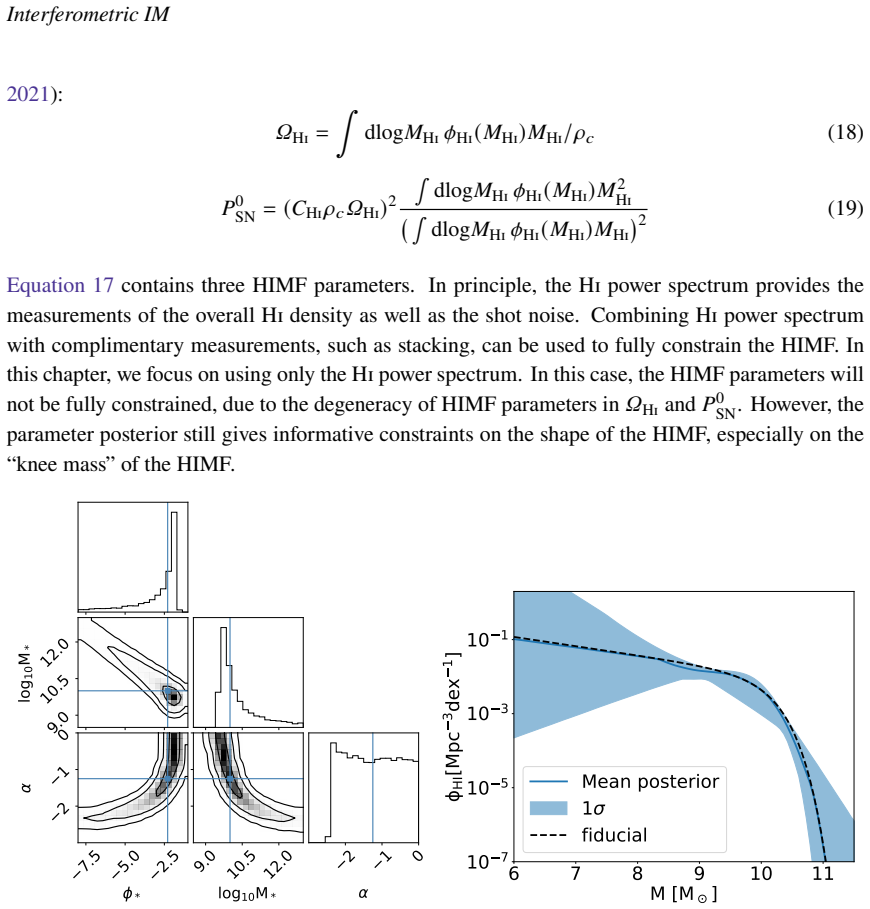
Load-bearing premise
The foreground removal and calibration methods that worked on MeerKAT data will continue to work on SKA-Mid without introducing new dominant systematics that reduce the forecasted sensitivity.
What would settle it
SKA-Mid AA4 observations that return HI power spectrum uncertainties substantially larger than the forecast at k ~ 1 Mpc^{-1} across z = 1–3, indicating that unaccounted systematics dominate.
Figures
read the original abstract
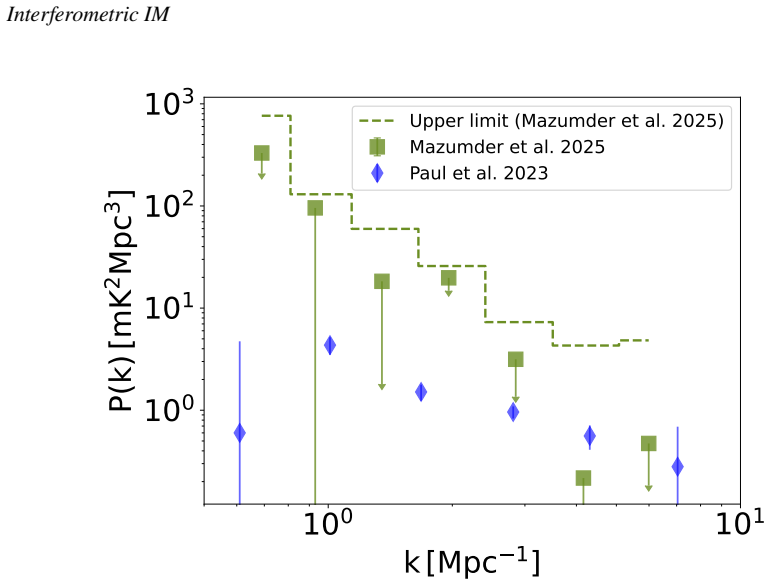
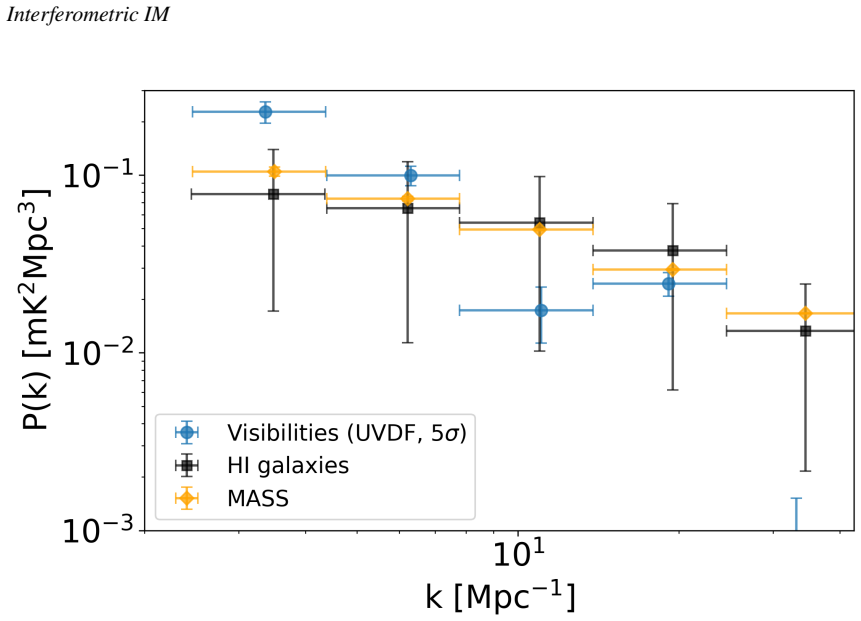
We discuss the progress towards using the SKA-Mid for interferometric neutral hydrogen (HI) intensity mapping surveys. By mapping the distribution of cosmic HI distribution through the 21cm line, SKA-Mid will be able to measure the HI power spectrum at small angular separations in interferometric mode. We review the measurements made from the precursor MeerKAT telescope, using the MeerKAT DEEP2 as well as the MIGHTEE survey data, yielding tentative detection as well as upper limits on HI clustering. The methodology for MeerKAT can be naturally extended to SKA-Mid. Forecasts suggest that SKA-Mid AA4 will be able to measure the HI power spectrum with high statistical significance across a wide range of redshifts from $z\sim1.0$ to $z\sim 3.0$, around nonlinear scales $k\sim 1.0\,{\rm Mpc}^{-1}$. The precise measurements can be used to constrain the properties of HI galaxies, providing a novel window into probing galaxy evolution at $1.0\lesssim z \lesssim 3.0$.
Editorial analysis
A structured set of objections, weighed in public.
Referee Report
Summary. The manuscript reviews tentative HI clustering detections and upper limits from MeerKAT DEEP2 and MIGHTEE data, argues that the same foreground removal and calibration methodology extends naturally to SKA-Mid, and presents forecasts that SKA-Mid AA4 will achieve high-significance measurements of the HI power spectrum at nonlinear scales k∼1 Mpc^{-1} over 1≲z≲3, thereby constraining HI galaxy properties and galaxy evolution.
Significance. If the forecasts are robust, the work would establish SKA-Mid as a powerful instrument for interferometric 21 cm intensity mapping at intermediate redshifts, providing a new observational window on HI galaxy evolution that complements optical surveys. The connection to existing MeerKAT results strengthens the case for continuity in analysis techniques.
major comments (2)
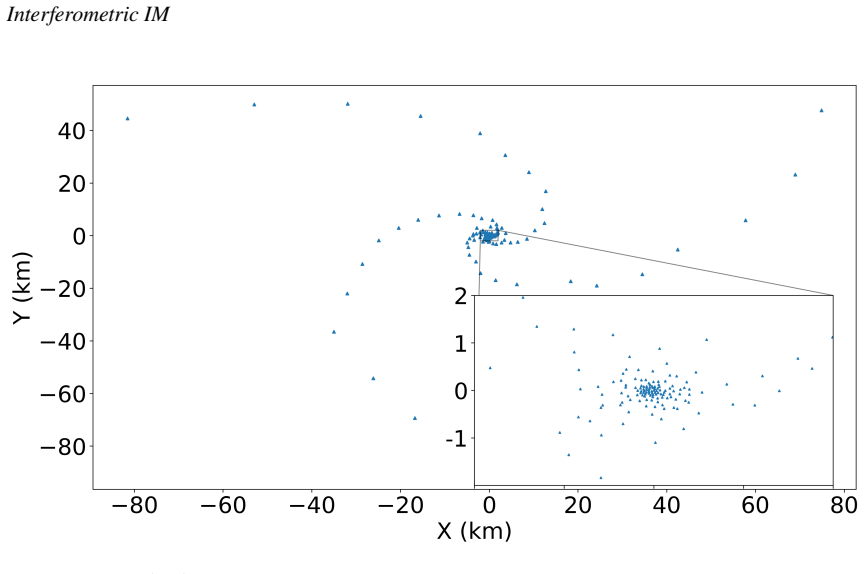
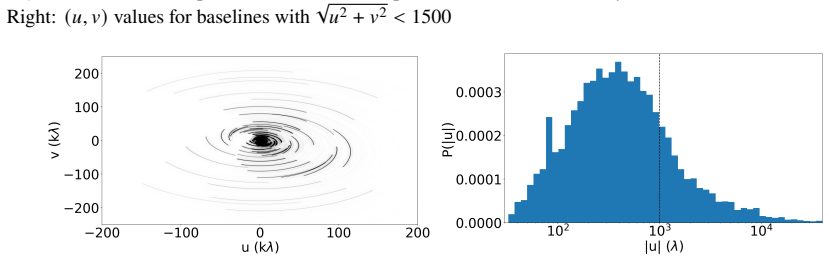
- [SKA-Mid forecasts section] Section presenting SKA-Mid forecasts: the central claim that SKA-Mid AA4 will measure the HI power spectrum with high statistical significance at k∼1 Mpc^{-1} rests on the assertion that MeerKAT DEEP2/MIGHTEE methodology 'can be naturally extended'. The manuscript supplies no quantitative propagation of differences in baseline density, primary beam, and RFI environment into the forecasted error budget or residual foreground bias at the quoted nonlinear scales.
- [Error modeling / forecast assumptions] Section on error modeling: no explicit error budget or sensitivity scaling is shown that accounts for the altered uv-coverage of SKA-Mid relative to MeerKAT, which directly affects the ability to isolate the HI signal at k∼1 Mpc^{-1} after foreground subtraction.
minor comments (2)
- [Abstract] The abstract states the forecast result without referencing the specific assumptions or scaling relations used, which would help readers evaluate the claims at first reading.
- Notation for the HI power spectrum and bias parameters is introduced without a dedicated definitions subsection, making cross-references to the MeerKAT results less immediate.
Simulated Author's Rebuttal
We thank the referee for their thoughtful review and for highlighting areas where the SKA-Mid forecast section requires greater rigor. We address each major comment below and will revise the manuscript to incorporate the requested quantitative details.
read point-by-point responses
-
Referee: [SKA-Mid forecasts section] Section presenting SKA-Mid forecasts: the central claim that SKA-Mid AA4 will measure the HI power spectrum with high statistical significance at k∼1 Mpc^{-1} rests on the assertion that MeerKAT DEEP2/MIGHTEE methodology 'can be naturally extended'. The manuscript supplies no quantitative propagation of differences in baseline density, primary beam, and RFI environment into the forecasted error budget or residual foreground bias at the quoted nonlinear scales.
Authors: We agree that the manuscript would be strengthened by an explicit quantitative propagation of array differences. The current forecasts scale the MeerKAT sensitivity and foreground-cleaning performance using standard interferometric relations (e.g., baseline density scaling with number of antennas and uv-coverage), but these steps are not shown in detail. We will add a dedicated subsection (or appendix) that tabulates the changes in baseline density, primary beam size, and expected RFI impact between MeerKAT and SKA-Mid AA4, together with the resulting effect on the thermal noise and residual foreground bias at k∼1 Mpc^{-1}. This will make the 'natural extension' claim fully traceable. revision: yes
-
Referee: [Error modeling / forecast assumptions] Section on error modeling: no explicit error budget or sensitivity scaling is shown that accounts for the altered uv-coverage of SKA-Mid relative to MeerKAT, which directly affects the ability to isolate the HI signal at k∼1 Mpc^{-1} after foreground subtraction.
Authors: The referee correctly identifies that an explicit error budget comparing the two arrays is absent. The error modeling section currently presents the MeerKAT-derived covariance and then applies a simple scaling for SKA-Mid collecting area and integration time, without showing the intermediate uv-coverage calculation. We will revise this section to include (i) a brief derivation of the sensitivity scaling that incorporates the denser short-baseline coverage of SKA-Mid and (ii) a quantitative estimate of how this improves foreground isolation at nonlinear scales. The revised text will also state the assumptions (e.g., identical calibration and foreground-removal algorithms) so that readers can assess their validity. revision: yes
Circularity Check
No circularity; forecasts are projections from independent MeerKAT data
full rationale
The paper's derivation consists of reviewing MeerKAT DEEP2/MIGHTEE results and stating that the same methodology extends to SKA-Mid AA4 to produce forecasts for HI power spectrum measurements. No equations, fitted parameters, or self-citations are shown that reduce any claimed prediction to an input by construction. The central claim is a standard sensitivity forecast resting on external validation from precursor observations, which is independent of the target result.
Axiom & Free-Parameter Ledger
Reference graph
Works this paper leans on
-
[1]
doi: 10.3847/ 1538-4357/acb13f
ISSN 1538-4357. doi: 10.3847/ 1538-4357/acb13f. URLhttp://dx.doi.org/10.3847/1538-4357/acb13f. S. E. I. Bosman et al.MNRAS, 514(1):55–76, July
-
[2]
doi: 10.1093/mnras/stac1046. R.Braunetal.arXive-prints,art.arXiv:1912.12699,Dec.2019. doi: 10.48550/arXiv.1912.12699. A. Chakraborty et al.The Astrophysical Journal Letters, 907(1):L7, jan
-
[3]
doi: 10.3847/ 2041-8213/abd17a. URLhttps://dx.doi.org/10.3847/2041-8213/abd17a. Z. Chen, L. Wolz, M. Spinelli, and S. G. Murray.MNRAS, 502(4):5259–5276, Apr
-
[4]
CHIME Collaboration et al.arXiv e-prints, art
doi: 10.1093/mnras/stab386. CHIME Collaboration et al.arXiv e-prints, art. arXiv:2309.04404, Sept
-
[5]
CHIME Collaboration et al.arXiv e-prints, art
doi: 10.48550/ arXiv.2309.04404. CHIME Collaboration et al.arXiv e-prints, art. arXiv:2511.19620, Nov
-
[6]
doi: 10.48550/ arXiv.2511.19620. A. Cooray and R. Sheth.Phys. Rep., 372(1):1–129, Dec
-
[7]
doi: 10.1016/S0370-1573(02) 00276-4. D. Crichton et al.Journal of Astronomical Telescopes, Instruments, and Systems, 8:011019, Jan
-
[8]
doi: 10.1117/1.JATIS.8.1.011019. S. Cunnington&Wang et al. InAdvancing Astrophysics with the SKA – II (AASKAII)
-
[9]
doi: 10.3847/1538-4365/aae387. K. M. A. Elahi et al. InAdvancing Astrophysics with the SKA – II (AASKAII)
-
[10]
doi: 10.1051/0004-6361/202038071. K. M. Gorski et al.ApJ, 622(2):759–771, apr
-
[11]
doi: 10.1086/427976. URLhttps://doi. org/10.1086%2F427976. I. Heywood et al.MNRAS, 509(2):2150–2168, Jan
work page internal anchor Pith review doi:10.1086/427976
-
[12]
doi: 10.1093/mnras/stab3021. I. Heywood et al.MNRAS, 534(1):76–96, Oct
-
[13]
doi: 10.1093/mnras/stae2081. J. C. Jackson.MNRAS, 156:1P, Jan
-
[14]
doi: 10.1093/mnras/156.1.1P. M. Jarvis et al. InProceedings of MeerKAT Science: On the Pathway to the SKA — PoS(MeerKAT2016), volume 277, page 006,
-
[16]
doi: 10.22323/1.277.0006. N. Kaiser.MNRAS, 227:1–21, July
-
[17]
doi: 10.1093/mnras/227.1.1. 21 Interferometric IM M. R. Krumholz, C. F. McKee, and J. Tumlinson.ApJ, 699(1):850–856, July
-
[18]
URLhttps://doi.org/10.1093/mnras/stad2441
doi: 10.1093/mnras/stad2441. URLhttps://doi.org/10.1093/mnras/stad2441. Z. Li et al.MNRAS, 534(3):1801–1815, Nov
-
[19]
doi: 10.1093/mnras/stae2182. N. Maddox et al.A&A, 646:A35, Feb
-
[20]
doi: 10.1051/0004-6361/202039655. A. M. Matthews, J. J. Condon, W. D. Cotton, and T. Mauch.ApJ, 909(2):193, Mar. 2021a. doi: 10.3847/1538-4357/abdd37. A. M. Matthews, J. J. Condon, W. D. Cotton, and T. Mauch.ApJ, 914(2):126, June 2021b. doi: 10.3847/1538-4357/abfaf6. T. Mauch et al.ApJ, 888(2):61, Jan
-
[21]
doi: 10.3847/1538-4357/ab5d2d. J.Mayoretal. InAdvancingAstrophysicswiththeSKA–II(AASKAII).2026. arXivsearch: Report number AASKAII/Mayor01. A. Mazumder et al.MNRAS, 541(1):476–493, July
-
[22]
doi: 10.1093/mnras/staf975. M. F. Morales.ApJ, 619(2):678–683, Feb
-
[23]
doi: 10.1086/426730. A. Nasirudin et al. InAdvancing Astrophysics with the SKA – II (AASKAII)
-
[24]
doi: 10.1088/0004-637X/753/1/81. S. Paul et al.ApJ, 833(2):213, Dec
-
[25]
doi: 10.3847/1538-4357/833/2/213. S.Paul,M.G.Santos,Z.Chen,andL.Wolz.arXive-prints,art.arXiv:2301.11943,Jan.2023. doi: 10.48550/arXiv.2301.11943. Planck Collaboration et al.A&A, 641:A6, Sept
work page internal anchor Pith review Pith/arXiv arXiv doi:10.3847/1538-4357/833/2/213 2023
-
[26]
doi: 10.1051/0004-6361/201833910. P. Schechter.ApJ, 203:297–306, Jan
-
[27]
doi: 10.1086/154079. N. Thyagarajan et al.ApJ, 804(1):14, May
-
[28]
doi: 10.1088/0004-637X/804/1/14. J. Tinker et al.ApJ, 688(2):709–728, Dec
-
[29]
doi: 10.1086/591439. J. L. Tinker et al.ApJ, 724(2):878–886, Dec
work page internal anchor Pith review doi:10.1086/591439
-
[30]
doi: 10.1088/0004-637X/724/2/878. J. Townsend et al.arXiv e-prints, art. arXiv:2602.23055, Feb
-
[31]
InCanadianLongRangePlanforAstronomyandAstrophysicsWhitePapers, volume 2020, page 28, Oct
K.Vanderlindeetal. InCanadianLongRangePlanforAstronomyandAstrophysicsWhitePapers, volume 2020, page 28, Oct
2020
-
[32]
doi: 10.5281/zenodo.3765414. F. Villaescusa-Navarro et al.ApJ, 866(2):135, Oct
-
[33]
doi: 10.3847/1538-4357/aadba0. L. Wolz, C. Blake, and J. S. B. Wyithe.MNRAS, 470(3):3220–3226, Sept
-
[34]
doi: 10.3847/1538-4357/ab88b1. 22
discussion (0)
Sign in with ORCID, Apple, or X to comment. Anyone can read and Pith papers without signing in.