REVIEW 2 major objections 5 minor 2 cited by
Time-dependent weighted directed networks of cryptocurrency interaction from high-frequency returns
T0 review · 2 major / 5 minor · reviewed 2026-07-14 · grok-4.5
Pith's one-line read Weekly Granger-causality networks of 1-minute crypto returns show Ethereum as the persistent top influencer while Bitcoin declines and the top-five ranks turn over repeatedly.
desk verdict Solid longer-horizon GC-network extension of Scagliarini et al.; ETH-dominant ranking with high turnover is the real empirical payload, but N-growth + fixed FDR makes the time series only partly comparable. read the letter →
The pith
A machine-rendered reading of the paper's core claim, the machinery that carries it, and where it could break.
The reading
What carries the argument
Time-dependent directed weighted networks whose edges are the log-variance-ratio Granger-causality strengths (after ADF stationarity screening and Benjamini–Hochberg FDR control at q = 0.05) computed on one-minute log-returns inside non-overlapping weekly windows; nodal out-strength is then used as the ranking measure of influence.
What would settle it
Recompute the same weekly networks with a non-linear or transfer-entropy causality measure (or with higher-order residualization beyond the first principal component) and check whether Ethereum’s continuous top ranking and the observed top-five turnover of seventeen assets disappear.
Extended reading notes
Core claim
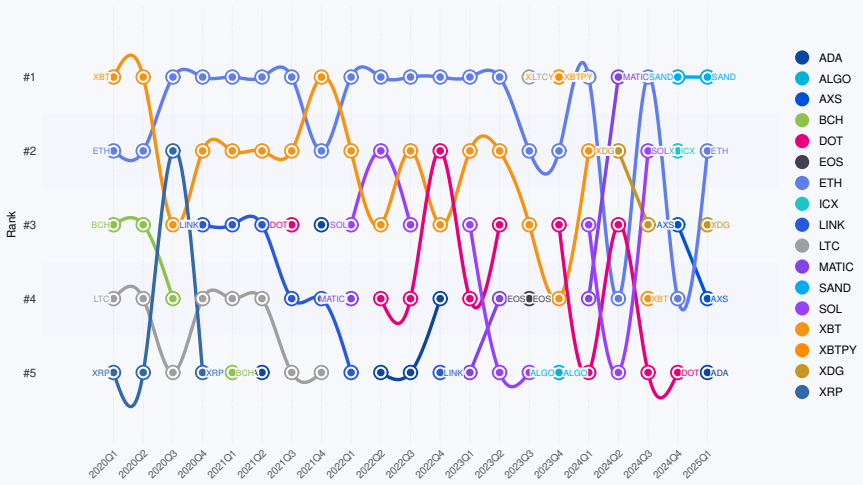
Ranking cryptocurrencies by nodal out-strength in weekly Granger-causality networks of one-minute log-returns reveals a dynamically evolving hierarchy: Ethereum remains the most influential asset across 2020–2025, Bitcoin’s relative influence declines, and seventeen distinct assets occupy the top-five positions, demonstrating a competitive and non-stable organization of market influence.
Load-bearing premise
That statistically significant linear Granger causality on one-minute returns, even after stationarity filtering and false-discovery control, is a faithful measure of directed influence rather than an artifact of residual common factors or the linear VAR specification itself.
Editorial extensions
If this is right
- Market-influence rankings cannot be treated as stable; any monitoring system must be recomputed on short horizons.
- Ethereum’s sustained out-strength dominance supplies a quantitative counterpart to narratives of its technological maturation.
- Bitcoin’s gradual loss of relative out-strength indicates that market leadership is not locked to the oldest or largest asset.
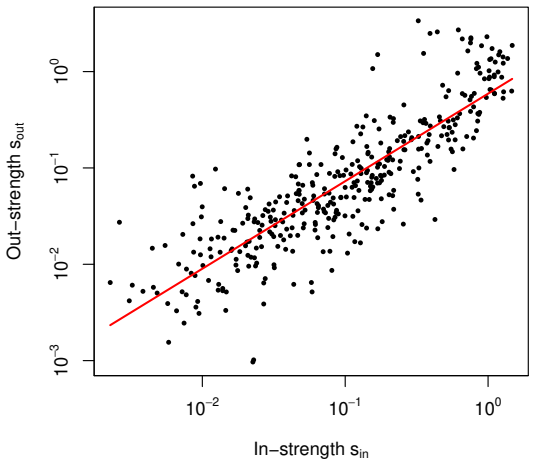
- The sub-linear in-strength–out-strength scaling implies an intrinsic asymmetry in how influence is received versus transmitted across the crypto market.
- Seventeen distinct top-five occupants over five years quantify the competitive turnover of the ecosystem.
Reading between the lines
- If out-strength rankings continue to turn over this rapidly, portfolio-risk models that treat a fixed set of “systemic” cryptos as permanent hubs will systematically mis-estimate contagion paths.
- The same weekly Granger pipeline could be applied to traditional equity or FX markets to test whether the absence of super-stable nodes is crypto-specific or a general high-frequency phenomenon.
- Combining the price-based influence networks with wallet-level transaction networks (as the authors themselves suggest) would allow a direct test of whether price leadership coincides with on-chain fund-flow leadership.
Signed reviews
Editorial analysis
A structured set of objections, weighed in public.
Referee Report
Summary. The manuscript constructs weekly directed, weighted networks of cryptocurrencies from statistically significant Granger-causal links among 1-minute log-returns (Kraken, Jan 2020–Mar 2025, 275 windows). After ADF stationarity filtering and Benjamini–Hochberg FDR control (q=0.05), link weights are the log residual-variance ratios of restricted versus full VARs (BIC lag selection). The authors report heavy-tailed normalized returns, heavy-tailed weight and strength distributions, a sublinear scaling sout∼sin^α (α≈0.91) that survives a volume covariate, and a quarterly ranking by N-normalized out-strength in which Ethereum remains #1, Bitcoin declines, and 17 distinct assets occupy the top five, interpreted as a competitive, non-stable hierarchy of influence. A PC1-removal robustness check leaves out-strengths and weights essentially unchanged (Spearman ρ≈0.999/0.995).
Significance. If the temporal rankings are comparable, the paper supplies a longer-horizon, higher-resolution extension of earlier GC-network studies of crypto (notably Scagliarini et al.), documenting a clear shift of dominance from Bitcoin toward Ethereum and substantial top-five turnover. Strengths include systematic stationarity testing, explicit FDR control, BIC lag selection, a volume-controlled regression for the sublinear scaling, and a transparent common-factor robustness check. These elements make the work a useful empirical contribution to the network analysis of high-frequency crypto markets, provided the comparability of the ranking measure across a growing asset universe is secured.
major comments (2)
- Results §4 / Fig. 5: the central ranking claim rests on quarterly averages of out-strength normalized by contemporaneous N. Because N grows from ~30 to ~390, the number of pairwise tests rises by two orders of magnitude while the BH threshold (q=0.05) is held fixed; detection power and network density therefore change systematically. The /N normalization does not automatically guarantee that relative out-strengths of incumbents remain comparable. Without a fixed-core or density-matched robustness check, the reported Bitcoin decline and elevated post-2022 turnover may partly reflect the expanding universe and tightening multiple-testing correction rather than pure reorganization of influence.
- Methods §3 and Results §4: linear pairwise Granger causality on 1-minute returns is treated as a faithful measure of directed “influence.” Although the PC1 filter addresses a shared market factor, residual non-stationarity after ADF filtering, possible nonlinear dependence, and the linear VAR specification itself remain unexamined. At least one additional check (e.g., nonlinear GC or a coarser sampling frequency) is needed to support the interpretive leap from statistical predictability to market influence that underpins the hierarchy narrative.
minor comments (5)
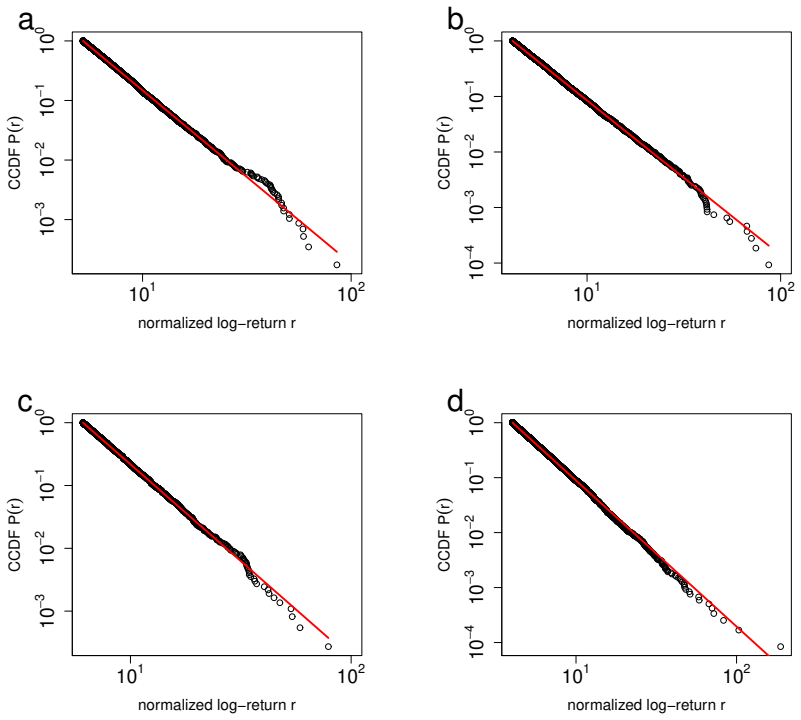
- Fig. 1: power-law exponents are given for only two assets; a short table or statement that the remaining coins yield comparable γ would strengthen the stylized-fact claim.
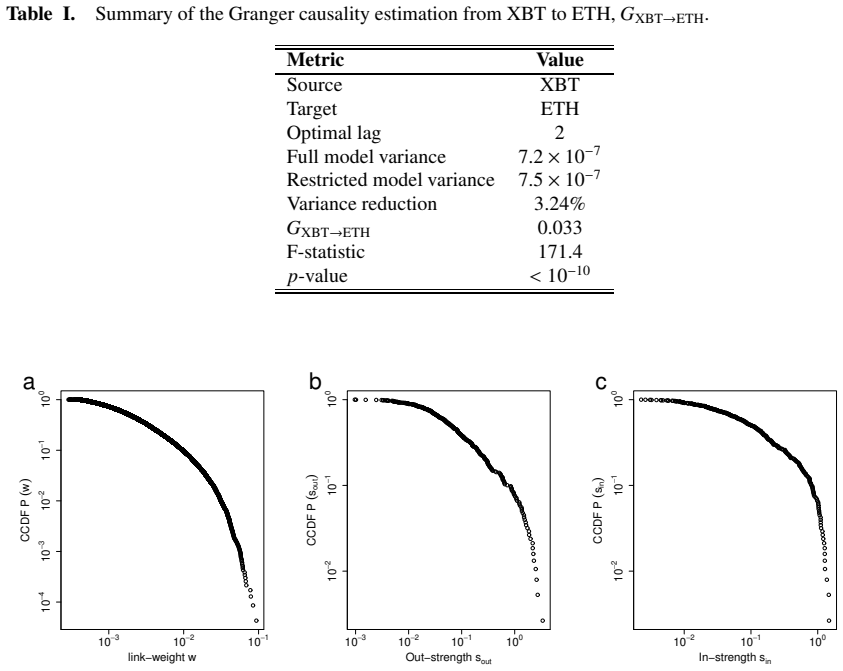
- Eq. (4) and Table I: the variance-reduction percentage and GX→Y are reported for a single illustrative pair; a brief distribution of typical GC strengths across weeks would help the reader gauge effect sizes.
- Fig. 5 caption: the symbol list is helpful but lengthy; a supplementary table mapping tickers to full names would improve readability.
- Introduction and Conclusions: several self-citations to the authors’ wallet-network papers are appropriate but could be condensed to avoid redundancy with the price-based focus of the present work.
- Typographical inconsistencies appear in author names and affiliations (e.g., “P eyy ala”, “C hakraborty”, “Insti tutes”); these should be corrected in production.
Circularity Check
Empirical GC-network construction and out-strength ranking; no derivation reduces to its inputs by construction. Minor non-load-bearing self-citations of authors' prior wallet-network papers.
full rationale
The paper's central claims are empirical summaries of directed weighted networks built from pairwise linear Granger causality (Eqs. 2-4) on 1-minute log-returns, after ADF stationarity filtering and Benjamini-Hochberg FDR control (Eq. 5). Nodal out-strength is the sum of retained GC weights; quarterly ranking (Fig. 5) is simply the time-averaged, N-normalized ordering of those strengths. Nothing is predicted from a fitted parameter that is then re-used as input, nor is any uniqueness or scaling relation imported by self-citation as a forced premise. The sublinear sout ~ sin^alpha fit (Fig. 4, alpha=0.909) and the PC1-residual robustness check (Fig. 6) are post-hoc observations, not circular predictions. Self-citations [5-9] appear only in the introduction as complementary wallet-level work and do not enter the price-based GC pipeline or the ranking result. The comparison to Scagliarini et al. [4] is external. Methodological concerns about changing N and FDR power affect temporal comparability but are not circularity. Derivation chain is self-contained against the data.
Assumptions & free parameters
free parameters (4)
- FDR level q =
0.05
- maximum lag for BIC =
10
- weekly window length =
10080 minutes
- ADF significance level =
0.01
assumptions (4)
- domain assumption Linear Granger causality on log-returns quantifies directed predictive influence between assets.
- domain assumption Log-returns that pass the ADF test at α=0.01 are sufficiently stationary for VAR estimation.
- standard math Benjamini–Hochberg FDR at q=0.05 adequately controls false-positive directed links under the multiple-testing regime.
- ad hoc to paper Nodal out-strength is a valid scalar proxy for a cryptocurrency’s overall market influence.
Cite this review
Pith. "Pith review of Time-dependent weighted directed networks of cryptocurrency interaction from high-frequency returns." pith.science (2026). https://pith.science/paper/CXPCZSE7
@misc{pith2026260625466,
  author       = {Pith},
  title        = {Pith review of: Time-dependent weighted directed networks of cryptocurrency interaction from high-frequency returns},
  year         = {2026},
  howpublished = {\url{https://pith.science/paper/CXPCZSE7}},
  note         = {Machine review of arXiv:2606.25466}
}
read the original abstract
We investigate the evolving structure of interactions in cryptocurrency markets using a network-based framework constructed from high-frequency price data spanning 2020-2025. Directed and weighted networks are constructed from statistically significant Granger causal relationships between cryptocurrency log-returns, enabling us to quantify the flow of influence across assets. We find that normalized returns exhibit heavy-tailed distributions, consistent with the presence of large intermittent fluctuations and in line with stylized facts of financial markets. The resulting networks display pronounced heterogeneity in link weights and nodal strengths, indicating that a small subset of cryptocurrencies contributes disproportionately to market dynamics. By ranking cryptocurrencies based on their nodal out-strength, we uncover a dynamically evolving hierarchy of influence. Ethereum consistently emerges as the most influential asset, while Bitcoin shows a gradual decline in its relative importance. The ranking structure exhibits substantial temporal variability, with multiple cryptocurrencies entering and exiting the top positions over time. Our findings reveal a highly competitive and non-stable organization of the cryptocurrency ecosystem.
Figures

Figures from the paper (3 more)

Forward citations
Cited by 2 Pith papers
-
Measuring the engine of a liquidation cascade: subcritical branching inside a first-order transition
The record October 2025 liquidation cascade ran deeply subcritical (branching ratio about 0.1-0.2) within its venue, and the crash transition is first-order rather than critical.
-
Sectoral inter-dependencies drive the loss of structural balance in signed financial networks
In the S&P 500, crisis-driven structural imbalance is concentrated in cross-sector triadic interactions, while within-sector structures remain balanced, and this imbalance is statistically associated with supply-chain...
Reference graph
Works this paper leans on
-
[1]
Easwaran, M
S. Easwaran, M. Dixit and S. Sinha, Bitcoin dynamics: the inverse square law of price fluctuatio ns and other stylized facts , in Econophysics and data driven modelling of market dynamics , Cham: Springer International Publishing (2015), 121-128
2015
-
[2]
Beguˇ si´ c, Z
S. Beguˇ si´ c, Z. Kostanjˇ car, H.E. Stanley and B. Podobnik, Physica A: Statistical Mechanics and its Appli- cations, 510, 400 (2018)
2018
-
[3]
Kakinaka and K
S. Kakinaka and K. Umeno, Journal of the Physical Society of Japan, 89(2), 024802 (2020)
2020
-
[4]
Scagliarini, G
T. Scagliarini, G. Pappalardo,A. E. Biondo, A. Pluchino , A. Rapisarda, and S. Stramaglia, Scientific Re- ports 12 (1), 18483 (2022)
2022
-
[5]
Chakraborty, T
A. Chakraborty, T. Hatsuda and Y . Ikeda Scientific Report s 13, 4718 (2023)
2023
-
[6]
Chakraborty, T
A. Chakraborty, T. Hatsuda and Y . Ikeda Physica A: Statis tical Mechanics and its Applications, 639, 129686 (2024)
2024
-
[7]
Chakraborty, T
A. Chakraborty, T. Hatsuda and Y . Ikeda JPS Conf. Proc. 40, 011003 (2023)
2023
-
[8]
Chakraborty and Y
A. Chakraborty and Y . Ikeda JPS Conf. Proc. 43, 011010 (2024)
2024
Show all 22 references
-
[9]
Ikeda and A Chakraborty, JPS Conf
Y . Ikeda and A Chakraborty, JPS Conf. Proc. 40, 011004 (2023)
2023
-
[10]
Laloux, P
L. Laloux, P . Cizeau, J. P . Bouchaud, and M Potters, PRL 83, 1467 (1999)
1999
-
[11]
Plerou, P
V . Plerou, P . Gopikrishnan, B. Rosenow, L. A. N. Amaral, and H. E. Stanley, PRL 83, 1471 (1999)
1999
-
[12]
Chakraborty, S
A. Chakraborty, S. Easwaran, and S. Sinha, Phys. A: Stat . Mech. its Appl. 509, 599 (2018)
2018
-
[13]
Chakraborty, S
A. Chakraborty, S. Easwaran, and S. Sinha, Acta Phys. Po lonica A 138, 105 (2020)
2020
-
[14]
Hamilton, J. D. (2020). Time series analysis. Princeto n university press
2020
-
[15]
C. W . J. Granger, Econometrica 37, 424 (1969)
1969
-
[16]
Ghoshal and A
G. Ghoshal and A. L. Barab´ asi, Nature communications 2(1), 394 (2011)
2011
-
[17]
https://support.kraken.com/articles/360047543791-do wnloadable-historical-marke t-data-time-and-sales-
-
[18]
Dickey and W .A
D.A. Dickey and W .A. Fuller, Journal of the American Sta tistical Association 74, 427 (1979)
1979
-
[19]
Schwarz, The annals of statistics 461 (1978)
G. Schwarz, The annals of statistics 461 (1978)
1978
-
[20]
Benjamini, and Y
Y . Benjamini, and Y . Hochberg, J. Roy. Statist. Soc. Ser. B 57(1) 289 (1995)
1995
-
[21]
Gopikrishnan, M
P . Gopikrishnan, M. Meyer, L. N. Amaral and H. E. Stanley, The European Physical Journal B-Condensed Matter and Complex Systems 3(2) 139 (1998)
1998
-
[22]
R. K. Pan and S. Sinha, Physica A: Statistical Mechanics and Its Applications 387, 2055 (2008). 11
Reviewed July 14, 2026 · model on record in the stance chip above.
Discussion (0). Continue with ORCID to comment.