Single object observations: Large telescopes vs. multiple small telescopes
Pith reviewed 2026-06-26 04:16 UTC · model grok-4.3
The pith
Arrays of small seeing-limited telescopes are generally more cost-effective than single large ones for single-object observations.
A machine-rendered reading of the paper's core claim, the machinery that carries it, and where it could break.
Core claim
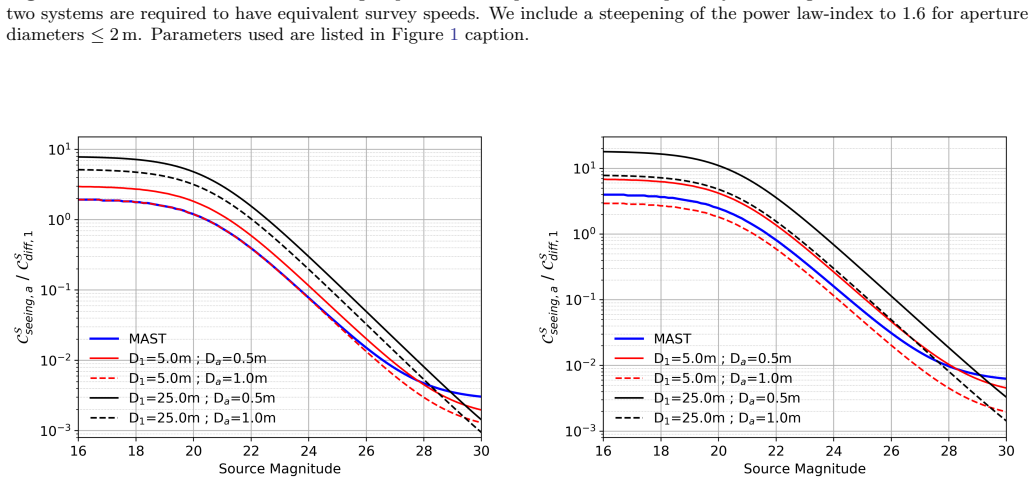
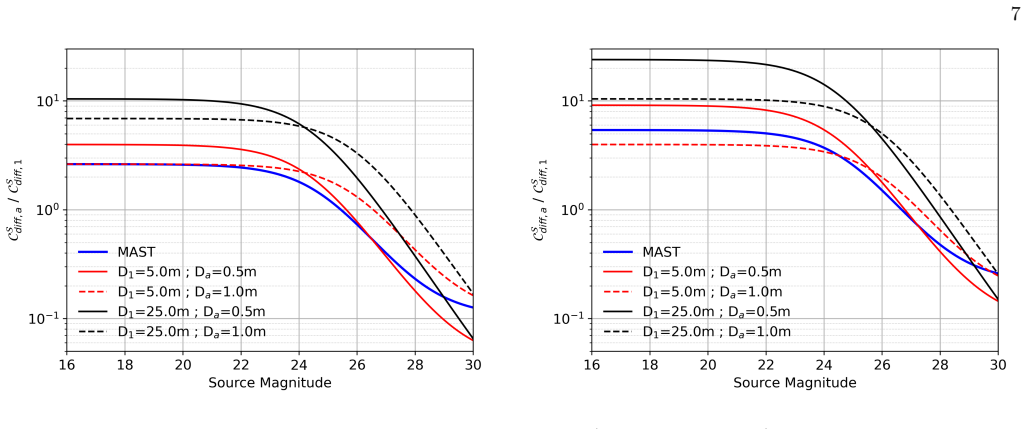
For unresolved single-object observations, arrays of seeing-limited telescopes are generally more cost-effective than a single seeing-limited telescope. When matched in survey speed, a single diffraction-limited telescope outperforms an array of small seeing-limited telescopes only for targets fainter than ∼20–24 mag, while a single large diffraction-limited telescope becomes more cost-effective than an array of smaller diffraction-limited telescopes only for targets fainter than ∼26–28 mag.
What carries the argument
survey speed per unit cost, used as the performance metric to rank single seeing-limited telescopes, single diffraction-limited telescopes, arrays of seeing-limited telescopes, and arrays of diffraction-limited telescopes.
Load-bearing premise
The exact numerical values chosen for telescope construction costs, maintenance expenses, and the transition points between seeing-limited and background-dominated regimes.
What would settle it
Direct measurement of survey speed per unit cost achieved by an operational array of small seeing-limited telescopes versus a single large seeing-limited telescope on targets between 18 and 22 magnitudes.
Figures
read the original abstract
A significant fraction of large-telescope observing time is devoted to single-object spectroscopy and photometry. We compare the cost-effectiveness of different telescope architectures, including single seeing- and diffraction-limited telescopes and arrays of seeing-limited or diffraction-limited telescopes. We use the survey speed per unit cost as the performance metric. For single telescopes with equal collecting area, diffraction-limited operation becomes more cost-effective once seeing-limited observations enter the background-dominated regime, typically at visible magnitudes of $\sim20$. For unresolved single-object observations, arrays of seeing-limited telescopes are generally more cost-effective than a single seeing-limited telescope. When matched in survey speed, a single diffraction-limited telescope outperforms an array of small seeing-limited telescopes only for targets fainter than $\sim20$--$24\,$mag, while a single large diffraction-limited telescope becomes more cost-effective than an array of smaller diffraction-limited telescopes only for targets fainter than $\sim26$--$28\,$mag. We conclude with a discussion on aspects related to the minimum telescope size and maintenance of telescope arrays. These conclusions are sensitive to the specific assumptions and system parameters adopted for each architecture and should therefore be interpreted with appropriate caution. Our results motivate the development of telescope arrays such as MAST and LFAST and may inform the design of future optical facilities.
Editorial analysis
A structured set of objections, weighed in public.
Referee Report
Summary. The paper compares cost-effectiveness of single seeing-limited or diffraction-limited telescopes versus arrays of smaller telescopes for unresolved single-object spectroscopy and photometry. Using survey speed per unit cost as the metric, it finds that arrays of seeing-limited telescopes are generally more cost-effective than a single equivalent seeing-limited telescope; a single diffraction-limited telescope outperforms an array of small seeing-limited ones only for targets fainter than ~20–24 mag; and a single large diffraction-limited telescope becomes preferable to an array of smaller diffraction-limited ones only below ~26–28 mag. The work concludes by discussing minimum telescope size and array maintenance, while noting that all thresholds are sensitive to adopted cost, performance, and background parameters.
Significance. If the underlying cost and performance models can be made transparent and reproducible, the quantitative crossover magnitudes would provide a useful framework for evaluating architectural trade-offs in optical/IR facility design and could inform decisions on projects such as MAST or LFAST. The emphasis on survey-speed-per-cost is a reasonable metric for single-object work, but the absence of explicit parameter values and exhaustive sensitivity tables limits the result’s immediate applicability.
major comments (2)
- [Abstract] Abstract and main text: the reported magnitude thresholds (20–24 mag and 26–28 mag) are produced by inserting specific numerical values for cost per collecting area, maintenance overhead, background-domination onset, and throughput/image-quality factors. No table or section lists these adopted values or shows how far the thresholds move under plausible variations, so the central ordering claims cannot be verified or falsified from the manuscript.
- [Abstract] The claim that arrays are “generally more cost-effective” rests on the particular functional form chosen for survey speed per unit cost; without the explicit equations and the numerical coefficients used to generate the crossover points, it is impossible to assess whether the ordering is robust or an artifact of the chosen parameterization.
minor comments (1)
- [Abstract] The abstract states that conclusions “should therefore be interpreted with appropriate caution,” but the manuscript does not provide the concrete parameter list or sensitivity plots that would allow readers to perform that interpretation.
Simulated Author's Rebuttal
We thank the referee for the detailed review and for identifying the need for greater transparency in the modeling parameters and equations. We agree that the central claims require explicit documentation of the adopted values and functional forms to allow verification. We will revise the manuscript to include these elements, along with sensitivity tests, while preserving the cautionary language already present in the abstract.
read point-by-point responses
-
Referee: [Abstract] Abstract and main text: the reported magnitude thresholds (20–24 mag and 26–28 mag) are produced by inserting specific numerical values for cost per collecting area, maintenance overhead, background-domination onset, and throughput/image-quality factors. No table or section lists these adopted values or shows how far the thresholds move under plausible variations, so the central ordering claims cannot be verified or falsified from the manuscript.
Authors: We agree that the specific parameter values and their sensitivity must be documented. In the revised version we will add a new subsection (likely in Section 2 or 3) that tabulates all numerical inputs (cost per unit area, maintenance factors, background onset magnitudes, throughput and image-quality coefficients) together with the equations used to compute survey speed per unit cost. We will also include a short sensitivity table or set of curves showing how the reported crossover magnitudes (20–24 and 26–28) shift when each parameter is varied by ±20–50 %. This will make the ordering claims directly verifiable. revision: yes
-
Referee: [Abstract] The claim that arrays are “generally more cost-effective” rests on the particular functional form chosen for survey speed per unit cost; without the explicit equations and the numerical coefficients used to generate the crossover points, it is impossible to assess whether the ordering is robust or an artifact of the chosen parameterization.
Authors: The functional form follows from the standard definitions of survey speed (signal-to-noise per unit time) and cost scaling; the equations are already present in the methods but were not highlighted with numerical coefficients. We will extract and display the full set of equations with all coefficients in a dedicated “Model Equations” subsection, cross-referenced to the parameter table. This will allow readers to reproduce the crossover points and test alternative parameterizations. revision: yes
Circularity Check
No significant circularity; results are explicit parameter-driven comparisons
full rationale
The paper computes magnitude crossover points (∼20–28 mag) by comparing survey speed per unit cost across single vs. array architectures in seeing-limited and diffraction-limited regimes. These thresholds are produced by inserting external numerical assumptions for cost per collecting area, maintenance overhead, background domination onset, and throughput factors; the abstract explicitly flags sensitivity to those choices. No step reduces by construction to a fitted quantity defined by the output, no self-definitional relation appears (e.g., no X defined via Y that is then “predicted”), and no load-bearing self-citation or uniqueness theorem is invoked. The derivation therefore remains self-contained against external cost and performance benchmarks rather than tautological.
Axiom & Free-Parameter Ledger
Reference graph
Works this paper leans on
-
[1]
2022, in Society of Photo-Optical Instrumentation Engineers (SPIE) Conference Series, Vol
Angel, R., Bender, C., Berkson, J., et al. 2022, in Society of Photo-Optical Instrumentation Engineers (SPIE) Conference Series, Vol. 12182, Ground-based and Airborne Telescopes IX, ed. H. K. Marshall, J. Spyromilio, & T. Usuda, 121821U, doi: 10.1117/12.2629655
-
[2]
Ben-Ami, S., Ofek, E. O., Polishook, D., et al. 2023, arXiv e-prints, arXiv:2304.02719, doi: 10.48550/arXiv.2304.02719
-
[3]
2024, in American Astronomical Society Meeting Abstracts, Vol
Bender, C., Angel, R., Berkson, J., et al. 2024, in American Astronomical Society Meeting Abstracts, Vol. 243, American Astronomical Society Meeting Abstracts, 237.04
2024
-
[4]
S., Bentz, M., Gonzalez, A., et al
Eikenberry, S. S., Bentz, M., Gonzalez, A., et al. 2019, arXiv e-prints, arXiv:1907.08273. https://arxiv.org/abs/1907.08273
Pith/arXiv arXiv 2019
-
[5]
Fucik, J., Steidel, C. C., Holden, B., et al. 2024, in Proceedings of SPIE, Vol. 13096, Ground-based and Airborne Instrumentation for Astronomy X (SPIE), 130968Z, doi: 10.1117/12.3020284
-
[6]
2024, in Society of Photo-Optical Instrumentation Engineers (SPIE) Conference Series, Vol
Irani, I., Ben-Ami, S., Sofer-Rimalt, Y., et al. 2024, in Society of Photo-Optical Instrumentation Engineers (SPIE) Conference Series, Vol. 13094, Ground-based and Airborne Telescopes X, ed. H. K. Marshall, J. Spyromilio, & T. Usuda, 1309453, doi: 10.1117/12.3018423
-
[7]
Law, N. M., Corbett, H., Galliher, N. W., et al. 2022, PASP, 134, 035003, doi: 10.1088/1538-3873/ac4811
-
[8]
1980, A&A, 89, 41
Lindegren, L. 1980, A&A, 89, 41
1980
-
[9]
Males, J. R., Close, L. M., Haffert, S. Y., & et al. 2024, in Proc. SPIE, Vol. 13097, Adaptive Optics Systems IX, ed. D. Schmidt, L. Schreiber, & E. Vernet (SPIE), 1309709, doi: 10.1117/12.3020048
-
[10]
Nir, G., Zackay, B., & Ofek, E. O. 2019, AJ, 158, 70, doi: 10.3847/1538-3881/ab27c7
-
[11]
Ofek, E. O. 2019, PASP, 131, 054504, doi: 10.1088/1538-3873/ab04df
-
[12]
Ofek, E. O., & Ben-Ami, S. 2020, arXiv e-prints, arXiv:2011.04674. https://arxiv.org/abs/2011.04674
arXiv 2020
-
[13]
O., Ben-Ami, S., Polishook, D., et al
Ofek, E. O., Ben-Ami, S., Polishook, D., et al. 2023, PASP, 135, 065001, doi: 10.1088/1538-3873/acd8f0 11
-
[14]
Ofek, E. O., Spitzer, S. A., & Nir, G. 2024, AJ, 168, 147, doi: 10.3847/1538-3881/ad644b
-
[15]
Oke, J. B., Cohen, J. G., Carr, M., et al. 1995, PASP, 107, 375, doi: 10.1086/133562 Sofer Rimalt, Y., Ben-Ami, S., Ofek, E., et al. 2024a, arXiv e-prints, arXiv:2408.16822, doi: 10.48550/arXiv.2408.16822 Sofer Rimalt, Y., Ben-Ami, S., Ofek, E., et al. 2024b, in Society of Photo-Optical Instrumentation Engineers (SPIE) Conference Series, Vol. 13096, Groun...
-
[16]
Bryant, K. Motohara, & J. R. D. Vernet, 130968V, doi: 10.1117/12.3020206 van Belle, G. T., Meinel, A. B., & Meinel, M. P. 2004, in Society of Photo-Optical Instrumentation Engineers (SPIE) Conference Series, Vol. 5489, Proc. SPIE, ed. J. Oschmann, Jacobus M., 563–570, doi: 10.1117/12.552181
-
[17]
Young, A. T. 1967, AJ, 72, 747, doi: 10.1086/110303
-
[18]
Zackay, B., & Ofek, E. O. 2017, ApJ, 836, 187, doi: 10.3847/1538-4357/836/2/187
discussion (0)
Sign in with ORCID, Apple, or X to comment. Anyone can read and Pith papers without signing in.