How Good Can Linear Models Be for Time-Series Forecasting?
Pith reviewed 2026-06-30 09:30 UTC · model grok-4.3
The pith
Tuned Ridge regression with optimized preprocessing beats prior linear models and exceeds Transformers on six of eight time-series benchmarks.
A machine-rendered reading of the paper's core claim, the machinery that carries it, and where it could break.
Core claim
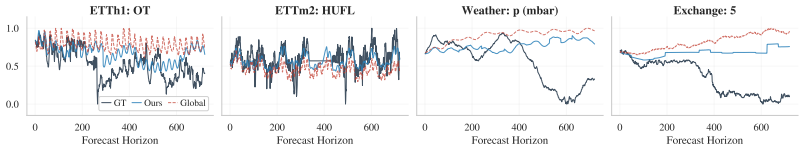
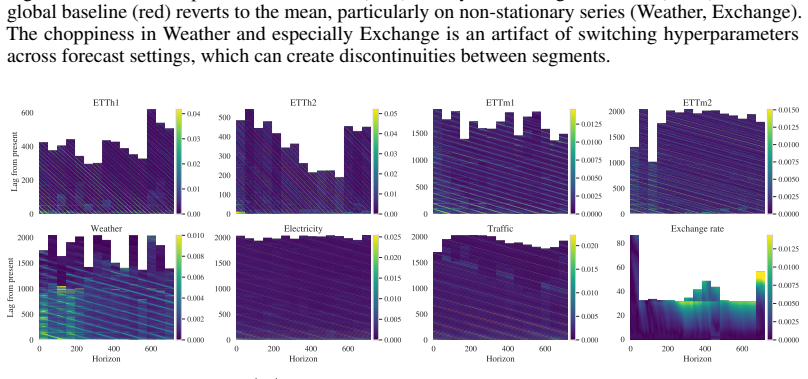
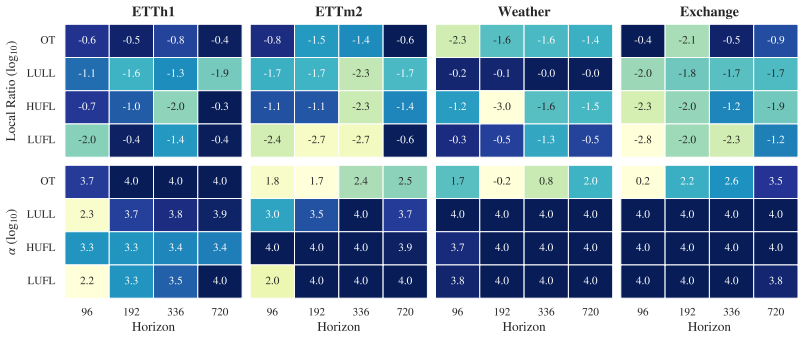
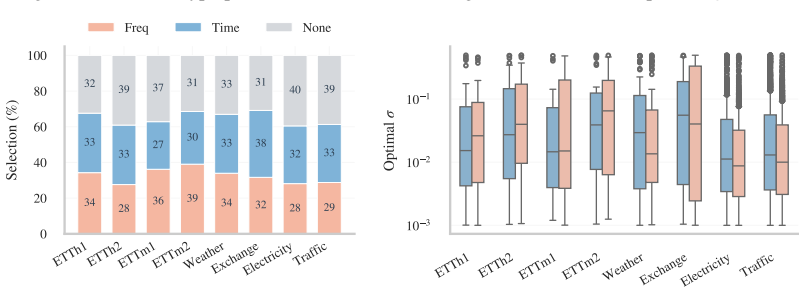
Ridge regression models achieve superior accuracy once context length is chosen in a series-specific and often non-monotonic way, normalization is performed over a learned trailing fraction of the lookback window rather than the whole window, regularization strength and augmentation are tuned, and the degree of cross-series parameter sharing is allowed to vary from fully shared to fully per-series. These choices let the linear models surpass earlier linear forecasters on most dataset-horizon pairs and exceed Transformer, MLP, and CNN baselines on six of the eight benchmarks while remaining fully interpretable.
What carries the argument
Ridge regression as a closed-form, weight-interpretable testbed that directly reveals the effect of each preprocessing hyperparameter.
If this is right
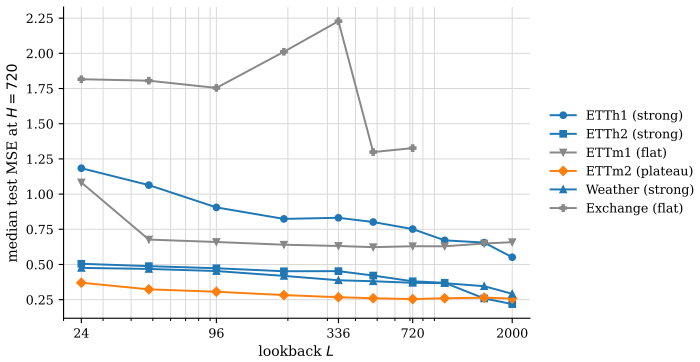
- Optimal lookback length follows dataset-specific power laws that can be positive or negative and often shrinks rather than grows with forecast horizon.
- Normalizing over a learned trailing fraction of the context window is almost always better than normalizing over the entire window.
- Series inside the same dataset frequently disagree on the best hyperparameters, so the optimal amount of cross-series sharing ranges from none to full.
- The fitted hyperparameters themselves act as diagnostics that surface structures larger models would otherwise bury inside their parameters.
Where Pith is reading between the lines
- The same preprocessing search could be applied to other linear or near-linear forecasters to test whether the gains generalize beyond Ridge.
- If preprocessing dominates, then foundation-model training budgets might be reallocated toward data curation and input normalization rather than parameter count.
- The observed non-monotonic and series-specific lookback lengths suggest that fixed-context designs common in large models may be systematically suboptimal.
Load-bearing premise
The hyperparameter search over context length, normalization, regularization, and augmentation never saw the test data, and the eight benchmarks are representative of settings where larger models could still win.
What would settle it
A single new dataset or benchmark where, after identical hyperparameter search, any Transformer, MLP, or CNN still outperforms the tuned Ridge model by a clear margin.
Figures
read the original abstract
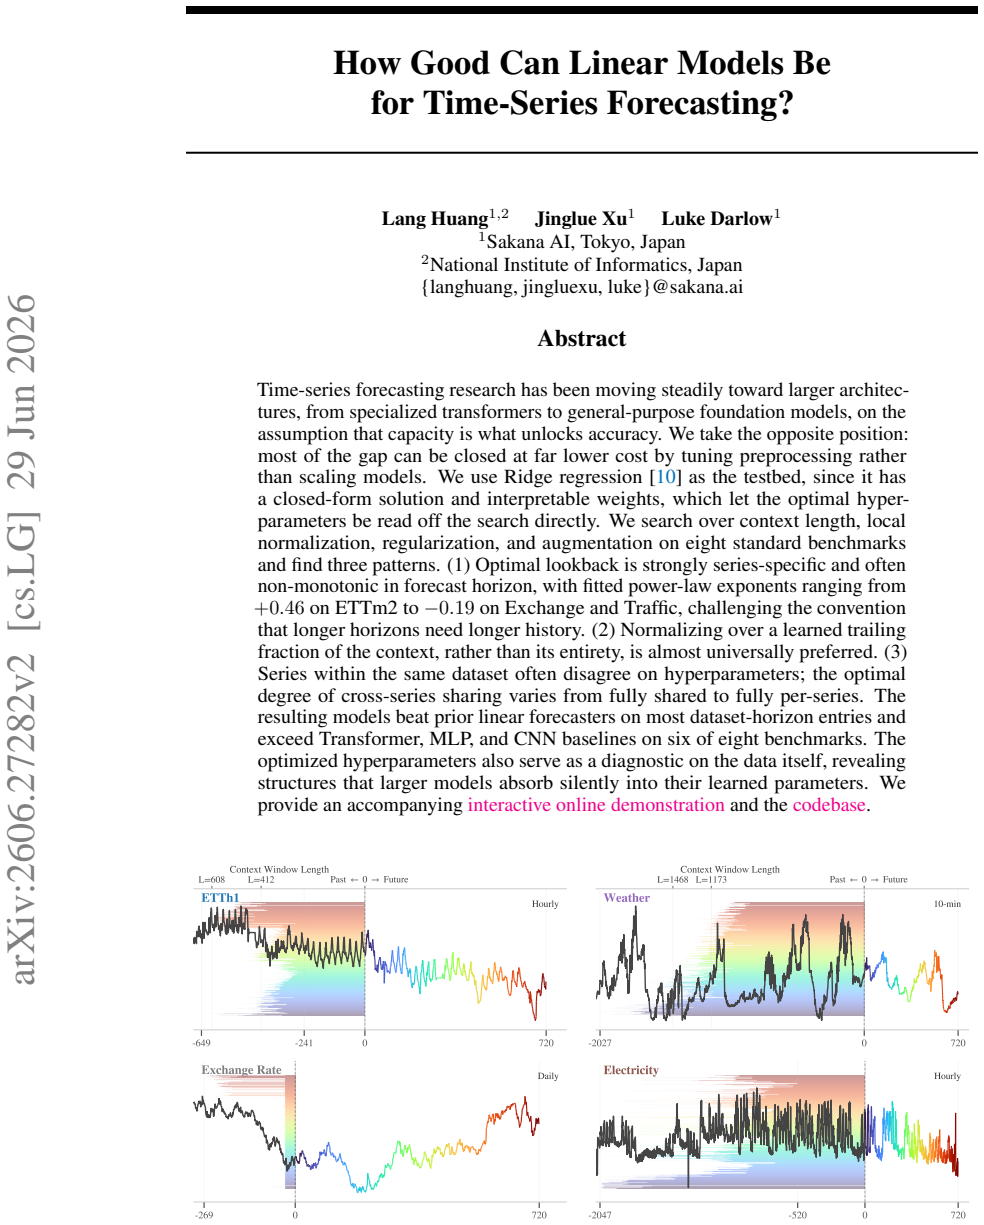
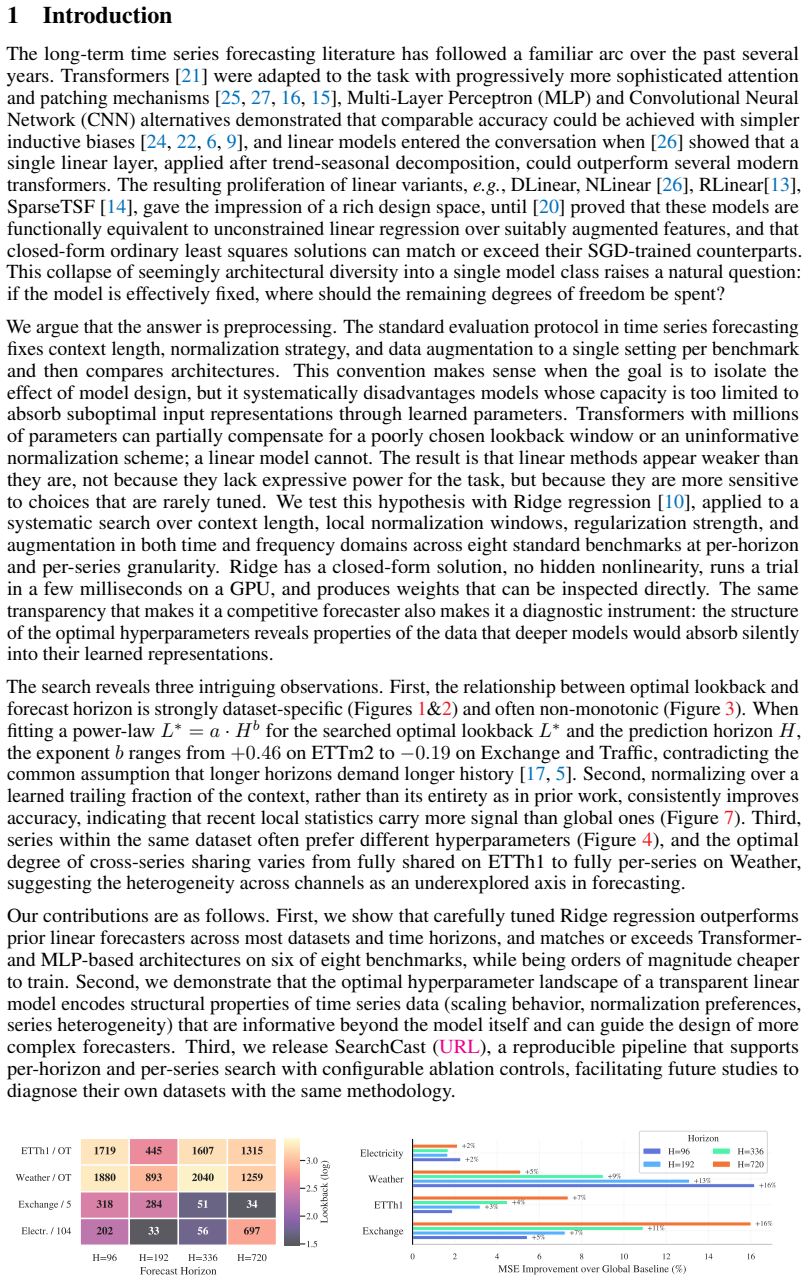
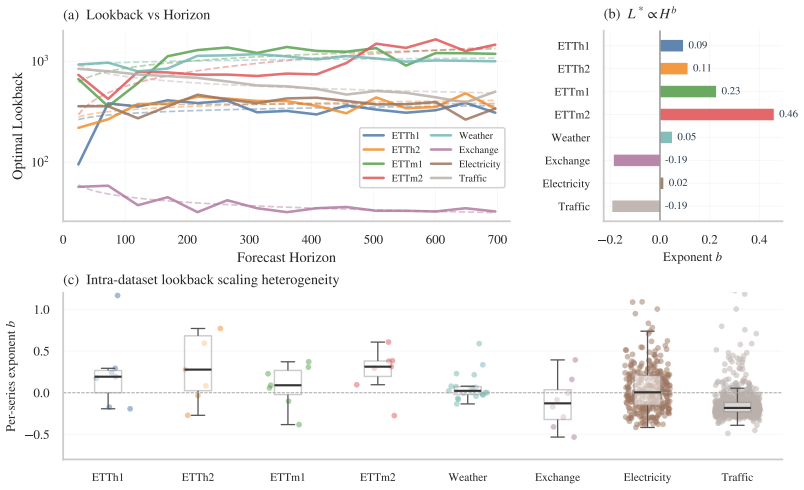
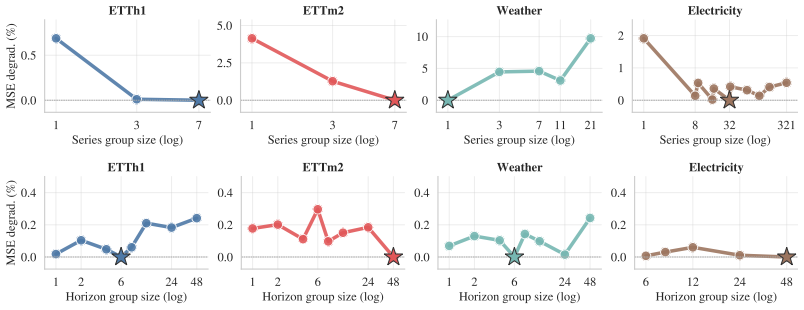
Time-series forecasting research has been moving steadily toward larger architectures, from specialized transformers to general-purpose foundation models, on the assumption that capacity is what unlocks accuracy. We take the opposite position: most of the gap can be closed at far lower cost by tuning preprocessing rather than scaling models. We use Ridge regression as the testbed, since it has a closed-form solution and interpretable weights, which let the optimal hyperparameters be read off the search directly. We search over context length, local normalization, regularization, and augmentation on eight standard benchmarks and find three patterns. (1) Optimal lookback is strongly series-specific and often non-monotonic in forecast horizon, with fitted power-law exponents ranging from $+0.46$ on ETTm2 to $-0.19$ on Exchange and Traffic, challenging the convention that longer horizons need longer history. (2) Normalizing over a learned trailing fraction of the context, rather than its entirety, is almost universally preferred. (3) Series within the same dataset often disagree on hyperparameters; the optimal degree of cross-series sharing varies from fully shared to fully per-series. The resulting models beat prior linear forecasters on most dataset-horizon entries and exceed Transformer, MLP, and CNN baselines on six of eight benchmarks. The optimized hyperparameters also serve as a diagnostic on the data itself, revealing structures that larger models absorb silently into their learned parameters. We provide an accompanying interactive online demonstration and the code at https://sakanaai.github.io/SearchCast/.
Editorial analysis
A structured set of objections, weighed in public.
Referee Report
Summary. The paper claims that Ridge regression with tuned preprocessing (context length, trailing normalization fraction, regularization, augmentation) can outperform prior linear forecasters on most dataset-horizon pairs and exceed Transformer/MLP/CNN baselines on six of eight standard benchmarks. It reports series-specific optimal lookbacks (with power-law exponents from +0.46 to -0.19), preference for partial-context normalization, and varying degrees of cross-series hyperparameter sharing, positioning these choices as diagnostics on the data and a lower-cost alternative to scaling model capacity. Code and an interactive demo are released.
Significance. If the results are obtained without test leakage, the work shows that substantial forecasting gains are achievable via preprocessing on a closed-form linear model, challenging the emphasis on larger architectures. The explicit release of code and the demo constitute a clear reproducibility strength that allows direct inspection of the search procedure and fitted weights.
major comments (2)
- [Abstract; §4 (Experiments)] The abstract and experimental sections provide no description of the validation protocol (e.g., rolling-origin or strictly held-out splits) used when searching over context length, normalization window fraction, regularization strength, and augmentation parameters. Because the headline result (outperformance on 6/8 benchmarks) rests on these per-series or per-dataset choices, absence of explicit leakage safeguards is load-bearing for the central claim.
- [§4.3 (Results); associated tables] Table entries comparing optimized Ridge models to baselines report point estimates only; no standard errors, multiple random seeds, or Diebold-Mariano tests are mentioned. This weakens the assertion that the linear models “exceed” complex baselines, especially when hyperparameters are themselves selected on validation data.
minor comments (2)
- [§3 (Method)] Notation for the trailing normalization fraction is introduced without an explicit equation; a short definition (e.g., Eq. (X)) would improve clarity when the fraction is later reported per dataset.
- [§4.2 (Hyperparameter Analysis)] The power-law fits for optimal lookback versus horizon are presented without the underlying scatter or R² values; adding these would let readers assess how strongly the data support the reported exponents.
Simulated Author's Rebuttal
We thank the referee for the detailed and constructive report. The two major comments identify important gaps in the experimental description and statistical reporting. We address each below and will revise the manuscript accordingly.
read point-by-point responses
-
Referee: [Abstract; §4 (Experiments)] The abstract and experimental sections provide no description of the validation protocol (e.g., rolling-origin or strictly held-out splits) used when searching over context length, normalization window fraction, regularization strength, and augmentation parameters. Because the headline result (outperformance on 6/8 benchmarks) rests on these per-series or per-dataset choices, absence of explicit leakage safeguards is load-bearing for the central claim.
Authors: We agree that an explicit description of the validation protocol is necessary. The released code implements a rolling-origin validation scheme performed exclusively on the training portion of each series, with the final test window held out and never used for hyperparameter selection or normalization statistics. No test data influences the search. We will add a dedicated subsection in §4 describing this protocol, including the exact train/validation/test split ratios and the fact that all preprocessing statistics are computed only on the training window. revision: yes
-
Referee: [§4.3 (Results); associated tables] Table entries comparing optimized Ridge models to baselines report point estimates only; no standard errors, multiple random seeds, or Diebold-Mariano tests are mentioned. This weakens the assertion that the linear models “exceed” complex baselines, especially when hyperparameters are themselves selected on validation data.
Authors: The current tables report single-run point estimates because Ridge regression with fixed hyperparameters is deterministic. However, we acknowledge that variability arising from hyperparameter search and any stochastic augmentation should be quantified. In the revision we will rerun the full pipeline with multiple random seeds for the augmentation component, report standard deviations across seeds, and add Diebold-Mariano tests against the strongest baseline for each dataset-horizon pair. revision: yes
Circularity Check
No circularity: empirical hyperparameter search on held-out benchmarks with no definitional or self-citation reduction
full rationale
The paper reports results from a direct grid search over context length, normalization fraction, regularization, and augmentation for Ridge regression, then evaluates the tuned models on eight standard time-series benchmarks. No equations, first-principles derivations, or predictions are presented that reduce to fitted parameters or self-citations by construction. The three observed patterns (series-specific lookback, trailing normalization preference, variable cross-series sharing) are post-hoc summaries of the search outcomes rather than inputs redefined as outputs. Self-citation load-bearing, ansatz smuggling, and uniqueness theorems are absent from the provided text. The performance claims rest on standard empirical evaluation rather than tautological re-labeling of inputs.
Axiom & Free-Parameter Ledger
free parameters (4)
- context length
- normalization window fraction
- regularization strength
- augmentation parameters
axioms (2)
- standard math Ridge regression admits a closed-form solution that enables direct reading of optimal hyperparameters
- domain assumption The eight standard benchmarks are sufficient to evaluate general forecasting performance
Reference graph
Works this paper leans on
-
[1]
Abhimanyu
D. Abhimanyu. A decoder-only foundation model for time-series forecasting. InInternational Conference on Machine Learning, 2024
2024
-
[2]
Akiba, S
T. Akiba, S. Sano, T. Yanase, T. Ohta, and M. Koyama. Optuna: A next-generation hyperparameter optimization framework. InProceedings of the 25th ACM SIGKDD international conference on knowledge discovery & data mining, pages 2623–2631, 2019
2019
-
[3]
A. F. Ansari, L. Stella, A. C. Turkmen, X. Zhang, P. Mercado, H. Shen, O. Shchur, S. S. Rangapuram, S. P. Arango, S. Kapoor, et al. Chronos: Learning the language of time series.Transactions on Machine Learning Research, 2024
2024
-
[4]
W. A. Brock, W. D. Dechert, J. A. Scheinkman, and B. LeBaron. A test for independence based on the correlation dimension.Econometric Reviews, 15(3):197–235, 1996
1996
-
[5]
Challu, K
C. Challu, K. G. Olivares, B. N. Oreshkin, F. G. Ramirez, M. M. Canseco, and A. Dubrawski. Nhits: Neural hierarchical interpolation for time series forecasting. InProceedings of the AAAI conference on artificial intelligence, volume 37, pages 6989–6997, 2023
2023
-
[6]
S.-A. Chen, C.-L. Li, N. Yoder, S. O. Arik, and T. Pfister. Tsmixer: An all-mlp architecture for time series forecasting.arXiv preprint arXiv:2303.06053, 2023
-
[7]
R. B. Cleveland, W. S. Cleveland, J. E. McRae, and I. Terpenning. STL: A seasonal-trend decomposition procedure based on loess.Journal of Official Statistics, 6(1):3–73, 1990
1990
-
[8]
Darlow, Q
L. Darlow, Q. Deng, A. Hassan, M. Asenov, R. Singh, A. Joosen, A. Barker, and A. Storkey. Dam: Towards a foundation model for forecasting. InInternational Conference on Learning Representations, 2025
2025
- [9]
-
[10]
A. E. Hoerl and R. W. Kennard. Ridge regression: Biased estimation for nonorthogonal problems. Technometrics, 12:55–67, 1970
1970
-
[11]
R. J. Hyndman and G. Athanasopoulos.Forecasting: Principles and Practice. OTexts, Melbourne, Australia, 3rd edition, 2021
2021
-
[12]
T. Kim, J. Kim, Y . Tae, C. Park, J.-H. Choi, and J. Choo. Reversible instance normalization for accurate time-series forecasting against distribution shift. InInternational Conference on Learning Representations, 2022
2022
-
[13]
Z. Li, S. Qi, Y . Li, and Z. Xu. Revisiting long-term time series forecasting: An investigation on linear mapping.arXiv preprint arXiv:2305.10721, 2023
work page internal anchor Pith review Pith/arXiv arXiv 2023
- [14]
-
[15]
Y . Liu, T. Hu, H. Zhang, H. Wu, S. Wang, L. Ma, and M. Long. itransformer: Inverted transformers are effective for time series forecasting.arXiv preprint arXiv:2310.06625, 2023
work page internal anchor Pith review Pith/arXiv arXiv 2023
-
[16]
Y . Nie, N. H. Nguyen, P. Sinthong, and J. Kalagnanam. A time series is worth 64 words: Long-term forecasting with transformers.arXiv preprint arXiv:2211.14730, 2022
work page internal anchor Pith review Pith/arXiv arXiv 2022
-
[17]
B. N. Oreshkin, D. Carpov, N. Chapados, and Y . Bengio. N-beats: Neural basis expansion analysis for interpretable time series forecasting. InInternational Conference on Learning Representations, 2020
2020
- [18]
-
[19]
Seabold and J
S. Seabold and J. Perktold. statsmodels: Econometric and statistical modeling with python. InProceedings of the 9th Python in Science Conference (SciPy), pages 92–96, 2010
2010
-
[20]
Toner and L
W. Toner and L. Darlow. An analysis of linear time series forecasting models. InProceedings of the 41st International Conference on Machine Learning, pages 48404–48427, 2024
2024
-
[21]
Vaswani, N
A. Vaswani, N. Shazeer, N. Parmar, J. Uszkoreit, L. Jones, A. N. Gomez, Ł. Kaiser, and I. Polosukhin. Attention is all you need.Advances in neural information processing systems, 30, 2017. 10
2017
- [22]
-
[23]
G. Woo, C. Liu, A. Kumar, C. Xiong, S. Savarese, and D. Sahoo. Unified training of universal time series forecasting transformers. InInternational Conference on Machine Learning, 2024
2024
-
[24]
H. Wu, T. Hu, Y . Liu, H. Zhou, J. Wang, and M. Long. Timesnet: Temporal 2d-variation modeling for general time series analysis.arXiv preprint arXiv:2210.02186, 2022
work page internal anchor Pith review Pith/arXiv arXiv 2022
-
[25]
H. Wu, J. Xu, J. Wang, and M. Long. Autoformer: Decomposition transformers with auto-correlation for long-term series forecasting.Advances in neural information processing systems, 34:22419–22430, 2021
2021
-
[26]
A. Zeng, M. Chen, L. Zhang, and Q. Xu. Are transformers effective for time series forecasting? In Proceedings of the AAAI conference on artificial intelligence, volume 37, pages 11121–11128, 2023
2023
-
[27]
more capacity captures more structure
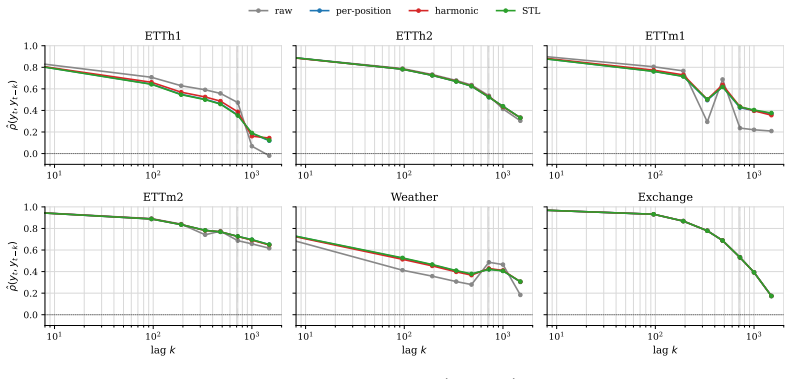
T. Zhou, Z. Ma, Q. Wen, X. Wang, L. Sun, and R. Jin. Fedformer: Frequency enhanced decomposed transformer for long-term series forecasting. InInternational conference on machine learning, pages 27268–27286. PMLR, 2022. 11 A Long-range linear autocorrelation in the benchmark series The per-dataset search of Section 5.1 selects context lengths that differ b...
2022
discussion (0)
Sign in with ORCID, Apple, or X to comment. Anyone can read and Pith papers without signing in.