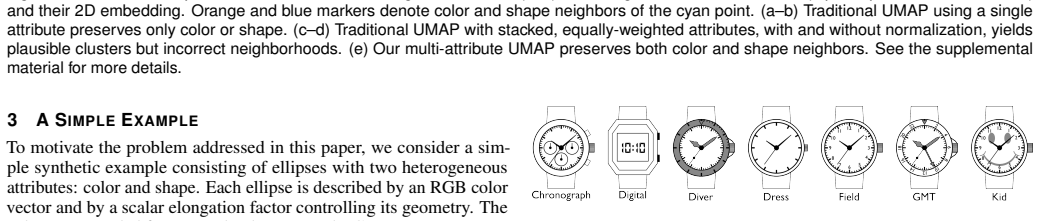
A Multi-Attribute Latent Space for Visual Analysis of Watches
Pith reviewed 2026-06-29 04:22 UTC · model grok-4.3
The pith
An extended UMAP merges separate attribute graphs for color and design with a class-aware term to embed watches so global types separate from local visual neighborhoods.
A machine-rendered reading of the paper's core claim, the machinery that carries it, and where it could break.
Core claim
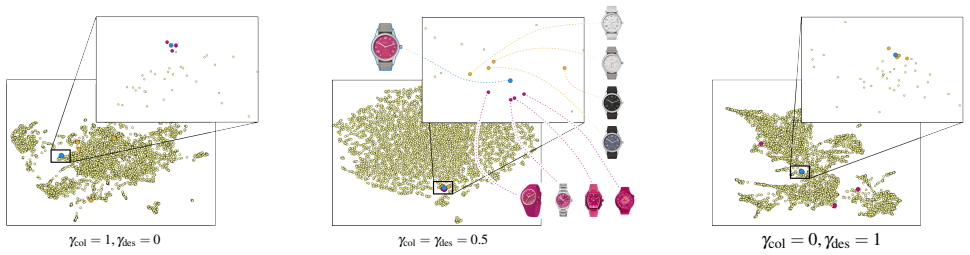
The paper claims that combining attribute-specific neighborhood graphs for dial color and dial design inside a single probabilistic UMAP objective, together with an added class-aware layout term that uses predicted watch type, yields a two-dimensional embedding in which global type structure is separated from local visual neighborhoods; this embedding is then exposed through an interactive interface that supports spatial navigation, metadata filtering, detail inspection, and search-by-example insertion.
What carries the argument
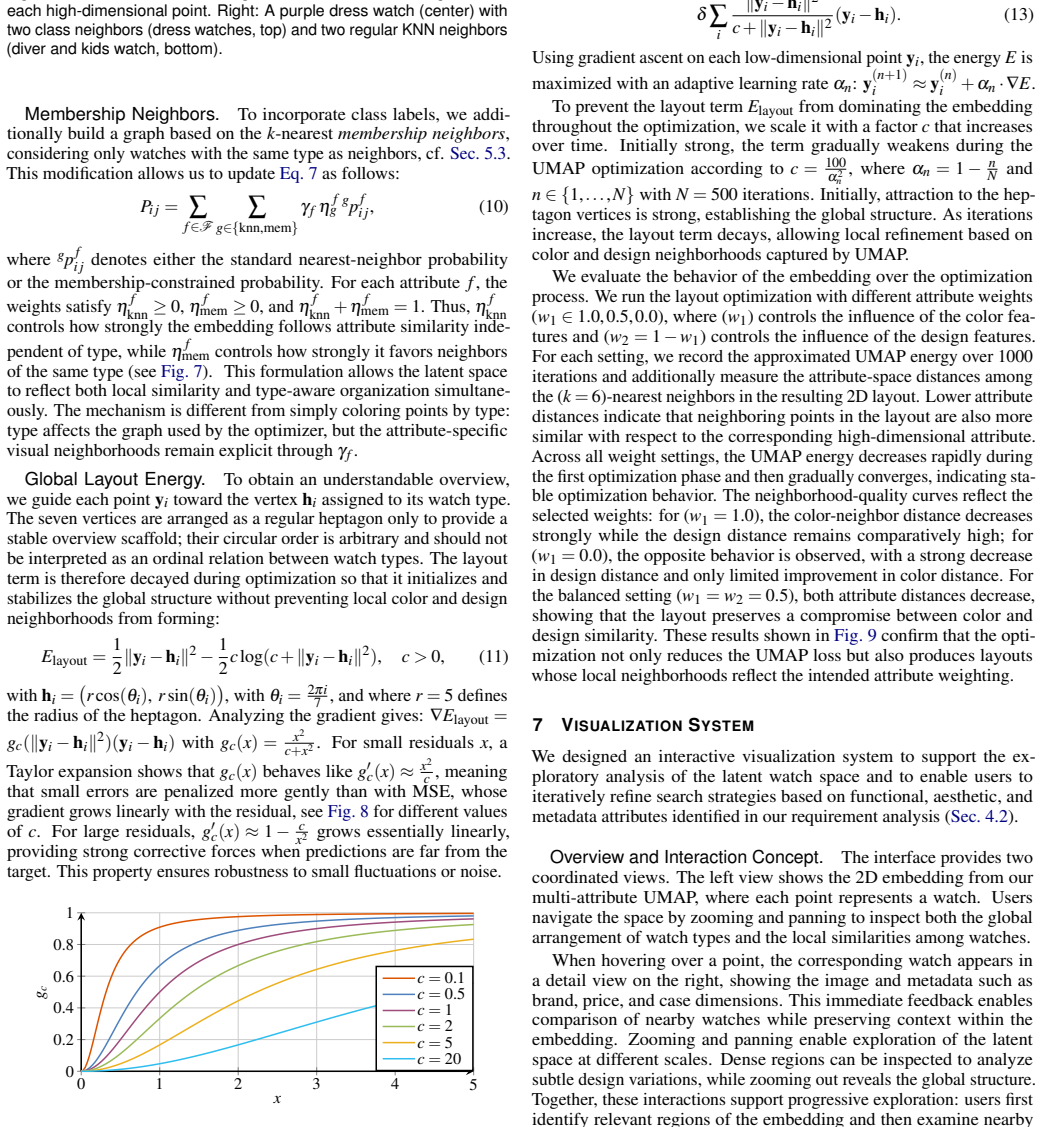
The extended UMAP objective that unifies multiple attribute neighborhood graphs in one probabilistic loss and augments it with a class-aware layout term to enforce separation of watch types.
If this is right
- The interactive interface enables open-ended exploration of visual similarity and stylistic alternatives in wristwatch collections.
- Qualitative feedback from experts and novices indicates the map supports discovery and comparison tasks.
- Parameter analysis and runtime measurements show the embedding remains practical for the tested collection sizes.
- The same design rationale yields concrete implications for applying multi-attribute latent spaces to other heterogeneous visual collections.
- The work surfaces specific limitations in scalability assessment and search-by-example validation that future systems must address.
Where Pith is reading between the lines
- The same graph-unification pattern could be applied to other product domains such as furniture or automobiles to test whether type-versus-visual separation still holds.
- The interface could be connected directly to e-commerce back-ends so that search-by-example results feed into purchase recommendations without leaving the visual map.
- Quantitative cluster-validity metrics computed on the final embedding would provide an objective check on the separation the authors currently judge only qualitatively.
- If the class-aware term dominates the layout, the method may generalize to any collection that already carries a coarse semantic label even when fine-grained visual attributes differ.
Load-bearing premise
The combined neighborhood graphs and class-aware term actually produce a layout that users judge to separate global type structure from local visual neighborhoods in a meaningful way.
What would settle it
A controlled study in which watch experts and novices fail to discover stylistic alternatives or make comparisons more effectively with the map than with ordinary metadata filters would falsify the claim that the system supports discovery and comparison.
Figures
read the original abstract
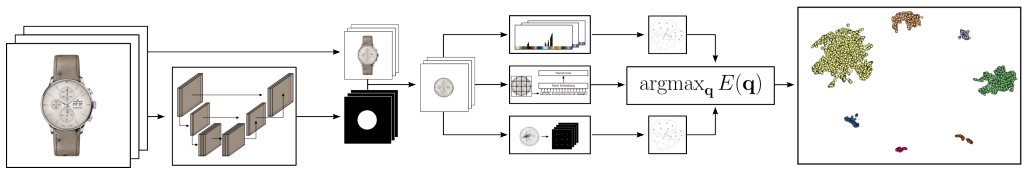
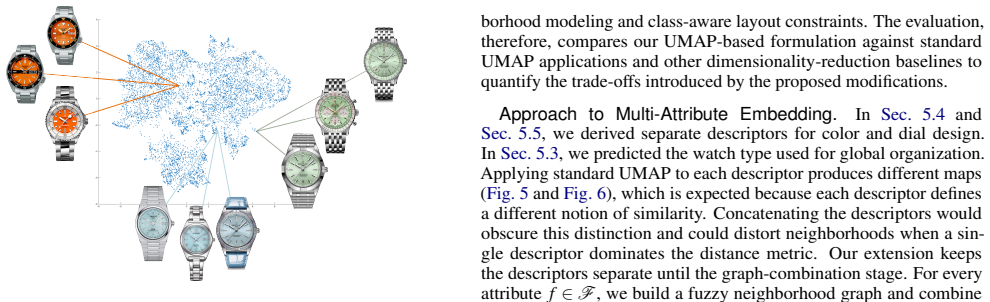
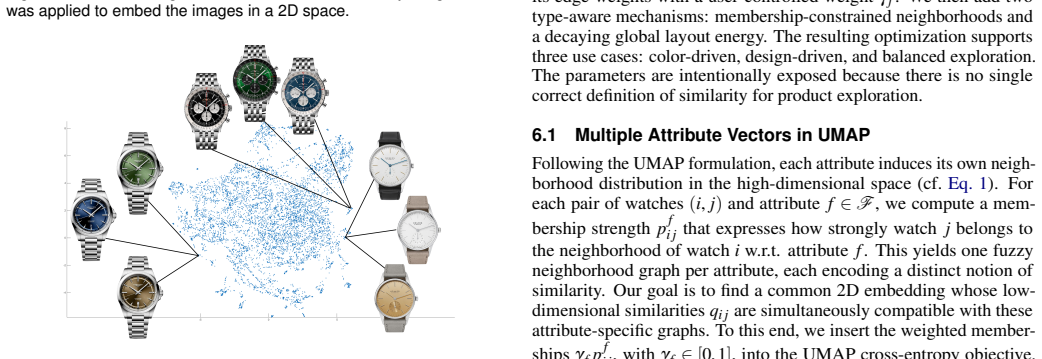
We present a design rationale, embedding model, and interactive visual-analysis system for exploring large wristwatch collections through heterogeneous visual and semantic attributes. The system addresses a common limitation of catalog and e-commerce interfaces: users can filter by metadata, but they receive little support for open-ended exploration of visual similarity, stylistic alternatives, and mixed aesthetic-functional criteria. We therefore represent watches with separate attribute graphs for dial color and dial design, while using watch type as an explicit semantic organizer. Dials are segmented with a U-Net, watch types are predicted with a Vision Transformer, colors are represented through a shared CIELAB reference palette, and dial structure is described with a gradient-based image descriptor. We extend UMAP by combining attribute-specific neighborhood graphs in a unified probabilistic objective and by adding a class-aware layout term that separates global type structure from local visual neighborhoods. The resulting map is exposed in an interactive interface with spatial navigation, metadata filtering, detail inspection, and search-by-example insertion. We evaluate the approach through parameter analysis, runtime measurements, and a qualitative pilot study with watch experts and novices. The results suggest that the system supports discovery and comparison, while also revealing limitations in scalability assessment, search-by-example validation, and the need for broader domain studies. We explicitly discuss these limitations and derive design implications for multi-attribute latent-space visualization across heterogeneous visual collections.
Editorial analysis
A structured set of objections, weighed in public.
Referee Report
Summary. The paper presents a multi-attribute embedding and interactive visualization system for large wristwatch collections. Watches are represented via separate attribute graphs (dial color, dial design) with watch type as an explicit semantic organizer; dials are segmented via U-Net, types predicted via Vision Transformer, colors via CIELAB palette, and structure via gradient descriptor. The core technical step extends UMAP by combining attribute-specific neighborhood graphs into a unified probabilistic objective and adding a class-aware layout term intended to separate global type structure from local visual neighborhoods. The resulting map is presented in an interface supporting spatial navigation, metadata filtering, detail inspection, and search-by-example. Evaluation consists of parameter analysis, runtime measurements, and a qualitative pilot study with experts and novices; the authors conclude that the system supports discovery and comparison while noting limitations in scalability, search validation, and domain breadth.
Significance. If the claimed separation of global semantic structure from local visual neighborhoods can be shown to be both technically sound and user-meaningful, the work would offer a concrete, reusable pattern for multi-attribute latent-space visualization of heterogeneous visual collections. The explicit discussion of limitations and derivation of design implications is a strength. At present, however, the absence of quantitative validation or detailed study protocols limits the strength of the central claim.
major comments (2)
- [Evaluation] Evaluation section: the qualitative pilot study is described only at a high level. No information is given on study design, participant tasks, comparison conditions, instructions, or any quantitative or inter-rater measures. Because the central claim that the extended UMAP supports discovery rests on this study, the lack of these details is load-bearing.
- [Method] Method (UMAP extension): the unified probabilistic objective and class-aware layout term are described conceptually but without equations, pseudocode, or implementation specifics for how attribute graphs are combined or how the layout term is optimized. This prevents assessment of whether the claimed separation is achieved by construction or by the data.
minor comments (1)
- [Abstract] Abstract and Evaluation: the phrase 'parameter analysis' is used without specifying which parameters were varied or what metrics were reported.
Simulated Author's Rebuttal
We thank the referee for the constructive comments, which help clarify how to strengthen the presentation of both the technical method and the evaluation. We address each major comment below.
read point-by-point responses
-
Referee: [Evaluation] Evaluation section: the qualitative pilot study is described only at a high level. No information is given on study design, participant tasks, comparison conditions, instructions, or any quantitative or inter-rater measures. Because the central claim that the extended UMAP supports discovery rests on this study, the lack of these details is load-bearing.
Authors: We agree that the current description of the pilot study is high-level. In the revised manuscript we will expand the Evaluation section with additional details on participant recruitment and backgrounds, the specific tasks and instructions given to experts and novices, the session protocol, and the nature of the collected feedback. We will also explicitly note that the study was exploratory rather than a controlled experiment with quantitative or inter-rater metrics, and we will temper the claims about discovery support accordingly. revision: yes
-
Referee: [Method] Method (UMAP extension): the unified probabilistic objective and class-aware layout term are described conceptually but without equations, pseudocode, or implementation specifics for how attribute graphs are combined or how the layout term is optimized. This prevents assessment of whether the claimed separation is achieved by construction or by the data.
Authors: The manuscript currently presents the UMAP extension at a conceptual level. To allow readers to assess the separation mechanism, the revision will add the explicit mathematical formulation of the unified probabilistic objective (including how attribute-specific graphs are fused) and the class-aware layout term, together with pseudocode for the combined optimization procedure. revision: yes
Circularity Check
No significant circularity detected
full rationale
The paper describes a design choice to extend UMAP by combining attribute-specific neighborhood graphs into a unified objective and adding a class-aware layout term whose explicit purpose is to separate global type structure from local neighborhoods. No equations, derivations, or first-principles results are presented that reduce any claimed prediction or output to fitted parameters or inputs by construction. The separation property follows directly from the stated design of the added term rather than from any self-referential fitting or self-citation chain. Evaluation rests on parameter analysis, runtime measurements, and a qualitative pilot study rather than on any tautological reduction. The central claims therefore remain independent of the inputs they organize.
Axiom & Free-Parameter Ledger
axioms (1)
- domain assumption U-Net segmentation and Vision Transformer type prediction produce sufficiently accurate attribute labels for the subsequent embedding step.
Reference graph
Works this paper leans on
-
[1]
Accessed: 2025-10-04
Chrono24.https://www.chrono24.com/. Accessed: 2025-10-04. 4
2025
-
[2]
S. Bell and K. Bala. Learning visual similarity for product design with convolutional neural networks.ACM Transactions on Graphics, 34(4), art. no. 98, 10 pages, 2015. doi: 10.1145/2766959 2
-
[3]
M. Ben-Menachem. Parallel coordinates: Visual multidimensional geom- etry and its applications.ACM SIGSOFT Software Engineering Notes, 35(3):39, 2010. doi: 10.1145/1764810.1764834 2
-
[4]
E. Bertini, A. Tatu, and D. Keim. Quality metrics in high-dimensional data visualization: An overview and systematization.IEEE Transactions on Visualization and Computer Graphics, 17(12):2203–2212, 2011. doi: 10.1109/TVCG.2011.229 2
-
[5]
D. Bertucci, M. M. Hamid, Y . Anand, A. Ruangrotsakun, D. Tabatabai, M. Perez et al. Dendromap: Visual exploration of large-scale image datasets for machine learning with treemaps.IEEE Trans. Vis. Comput. Graph., 29(1):320–330, 2023. doi: 10.1109/TVCG.2022.3209425 2
-
[6]
J. Brooke. SUS-A quick and dirty usability scale.Usability Evaluation in Industry, 189(194):4–7, 1996. doi: 10.1201/9781498710411-35 11, 15, 17
-
[7]
D. M. Chan, R. Rao, F. Huang, and J. F. Canny. t-SNE-CUDA: GPU- accelerated t-SNE and its applications to modern data. In30th Inter- national Symposium on Computer Architecture and High Performance Computing, pp. 330–338, 2018. doi: 10.1109/CAHPC.2018.8645912 2
-
[8]
N. Dalal and B. Triggs. Histograms of oriented gradients for human detection. InIEEE Computer Society Conference on Computer Vision and Pattern Recognition, vol. 1, pp. 886–893, 2005. doi: 10.1109/CVPR.2005. 177 5
-
[9]
A. Dosovitskiy, L. Beyer, A. Kolesnikov, D. Weissenborn, X. Zhai, T. Un- terthiner et al. An image is worth 16x16 words: Transformers for image recognition at scale, 2021. doi: 10.2139/ssrn.5180447 5
-
[10]
L. Gou, L. Zou, N. Li, M. Hofmann, A. K. Shekar, A. Wendt et al. V ATLD: A Visual Analytics System to Assess, Understand and Improve Traffic Light Detection .IEEE Transactions on Visualization & Computer Graph- ics, 27(02):261–271, 2021. doi: 10.1109/TVCG.2020.3030350 2
-
[11]
X. Han, Z. Wu, P. X. Huang, X. Zhang, M. Zhu, Y . Li et al. Automatic spatially-aware fashion concept discovery. InIEEE International Confer- ence on Computer Vision, pp. 1472–1480, 2017. doi: 10.1109/ICCV.2017 .163 2
-
[12]
J. Heinrich and D. Weiskopf. State of the Art of Parallel Coordinates. In M. Sbert and L. Szirmay-Kalos, eds.,Eurographics 2013 - State of the Art Reports. The Eurographics Association, 2013. doi: 10.2312/conf/EG2013/ stars/095-116 2
-
[13]
Hinderks
A. Hinderks. Design and evaluation of a short version of the user ex- perience questionnaire (UEQ-S).International Journal of Interactive Multimedia and Artificial Intelligence, 4(6):103–108, 2017. doi: 10.9781/ ijimai.2017.09.001 11, 15, 17
2017
-
[14]
M. S. Jain, K. Polanski, C. D. Conde, X. Chen, J. Park, L. Mamanova et al. Multimap: Dimensionality reduction and integration of multimodal data. bioRxiv, 2021. doi: 10.1101/2021.02.16.431421 2
-
[15]
P. Joia, D. Coimbra, J. A. Cuminato, F. V . Paulovich, and L. G. Nonato. Lo- cal affine multidimensional projection.IEEE Transactions on Visualization and Computer Graphics, 17(12):2563–2571, 2011. doi: 10.1109/TVCG. 2011.220 2
-
[16]
K. Liu, H. Skibbe, T. Schmidt, T. Blein, K. Palme, T. Brox et al. Rotation- invariant HOG descriptors using fourier analysis in polar and spherical coordinates.International Journal of Computer Vision, 106(3):342–364,
-
[17]
doi: 10.1007/s11263-013-0634-z 5
-
[18]
S. Liu, D. Maljovec, B. Wang, P. Bremer, and V . Pascucci. Visualizing high-dimensional data: Advances in the past decade.IEEE Transactions on Visualization and Computer Graphics, 23(3):1249–1268, 2017. doi: 10 .1109/TVCG.2016.2640960 2
arXiv 2017
-
[19]
Y . Liu, E. Jun, Q. Li, and J. Heer. Latent space cartography: Visual analysis of vector space embeddings.Computer Graphics Forum, 38(3):67–78,
-
[20]
doi: 10.1111/cgf.13672 2
-
[21]
L. McInnes, J. Healy, and J. Melville. UMAP:Uniform manifold ap- proximation and projection for dimension reduction.arXiv preprint arXiv:1802.03426, 2018. 2, 5, 12
Pith/arXiv arXiv 2018
-
[22]
L. Meng, S. van den Elzen, N. Pezzotti, and A. Vilanova. Class-constrained t-sne: Combining data features and class probabilities.IEEE Transactions on Visualization and Computer Graphics, 30(1):164–174, 2024. doi: 10. 1109/TVCG.2023.3326600 2
arXiv 2024
-
[23]
ChatGPT, 2026
OpenAI. ChatGPT, 2026. Large language model used for language editing and drafting assistance. Accessed: 2026-06-24. 13
2026
-
[24]
N. Pezzotti, B. P. F. Lelieveldt, L. v. d. Maaten, T. Höllt, E. Eisemann, and A. Vilanova. Approximated and user steerable t-SNE for progressive visual analytics.IEEE Transactions on Visualization and Computer Graphics, 23(7):1739–1752, 2017. doi: 10.1109/TVCG.2016.2570755 2
-
[25]
Pezzotti, J
N. Pezzotti, J. Thijssen, A. Mordvintsev, T. Höllt, B. Van Lew, B. P. Lelieveldt et al. GPGPU linear complexity t-SNE optimization.IEEE Transactions on Visualization and Computer Graphics, 26(1):1172–1181,
-
[26]
doi: 10.1109/TVCG.2019.2934307 2
-
[27]
Ridnik, E
T. Ridnik, E. Ben-Baruch, A. Noy, and L. Zelnik-Manor. Imagenet-21k pretraining for the masses, 2021. 5
2021
-
[28]
O. Ronneberger, P. Fischer, and T. Brox. U-Net: Convolutional networks for biomedical image segmentation. InMedical Image Computing and Computer-Assisted Intervention – MICCAI 2015, pp. 234–241. Springer International Publishing, 2015. doi: 10.1007/978-3-662-54345-0_3 4
-
[29]
Sechidis, G
K. Sechidis, G. Tsoumakas, and I. Vlahavas. On the stratification of multi-label data. InJoint European Conference on Machine Learning and Knowledge Discovery in Databases, pp. 145–158. Springer, 2011. doi: 10. 1007/978-3-642-23808-6_10 5
2011
-
[30]
Seo and B
J. Seo and B. Shneiderman. A rank-by-feature framework for unsupervised multidimensional data exploration using low-dimensional projections. In Proceedings of IEEE Symposium on Information Visualization, pp. 65–72,
-
[31]
doi: 10.1109/INFVIS.2004.3 2
-
[32]
M. Sips, B. Neubert, J. P. Lewis, and P. Hanrahan. Selecting good views of high-dimensional data using class consistency.Computer Graphics Forum, 28(3):831–838, 2009. doi: 10.1111/j.1467-8659.2009.01467.x 2
-
[33]
A. Tatu, G. Albuquerque, M. Eisemann, J. Schneidewind, H. Theisel, M. Magnor et al. Combining automated analysis and visualization tech- niques for effective exploration of high-dimensional data. InIEEE Sympo- sium on Visual Analytics Science and Technology, pp. 59–66, 2009. doi: 10.1109/V AST.2009.5332628 2
work page doi:10.1109/v 2009
-
[34]
Van der Maaten and G
L. Van der Maaten and G. Hinton. Visualizing data using t-SNE.Journal of Machine Learning Research, 9(86):2579–2605, 2008. 2
2008
-
[35]
Vaswani, N
A. Vaswani, N. Shazeer, N. Parmar, J. Uszkoreit, L. Jones, A. N. Gomez et al. Attention is all you need.Advances in Neural Information Processing Systems, 30, 2017. 5
2017
-
[36]
J. Wang, L. Gou, W. Zhang, H. Yang, and H.-W. Shen. DeepVID: Deep Visual Interpretation and Diagnosis for Image Classifiers via Knowledge Distillation .IEEE Transactions on Visualization & Computer Graphics, 25(06):2168–2180, 2019. doi: 10.1109/TVCG.2019.2903943 2
-
[37]
M. Wattenberg, F. Viégas, and I. Johnson. How to use t-SNE effectively. Distill, 2016. doi: 10.23915/distill.00002 2
-
[38]
Y . Ye, R. Huang, and W. Zeng. Visatlas: An image-based exploration and query system for large visualization collections via neural image embedding.IEEE Transactions on Visualization and Computer Graphics, 30(7):3224–3240, July 2024. doi: 10.1109/TVCG.2022.3229023 2
-
[39]
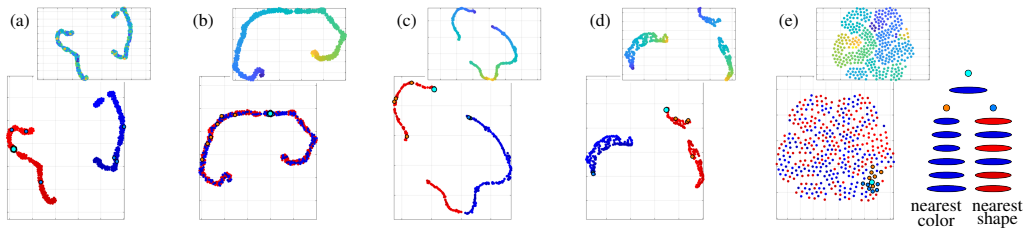
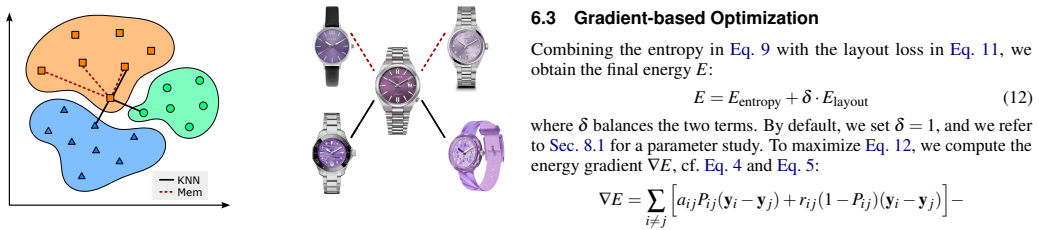
Y . Zhou, W. Yang, J. Chen, C. Chen, Z. Shen, X. Luo et al. Cluster-aware grid layout.IEEE Transactions on Visualization and Computer Graphics, 30(1):240–250, 2024. doi: 10.1109/TVCG.2023.3326934 2 A MOTIVATIONALEXAMPLE To convey the challenges of multi-attribute dimensionality reduction, we illustrate them using a synthetic dataset. Although simplified, ...
-
[40]
After dimensionality reduction with UMAP, we determine the correspondingk-nearest neigh- bors in the 2D embedding, denoted as NUMAP
and Nj in morphological space (attribute 2). After dimensionality reduction with UMAP, we determine the correspondingk-nearest neigh- bors in the 2D embedding, denoted as NUMAP. Our system supports combiningmattributes attr i with weightsw i, where: wi ≥0 and m ∑ i=1 wi =1 (16) To assess how well the embedding reflects the influence of each at- tribute, w...
-
[41]
6 for the data in the motivational example in Fig
We report weights and corresponding error metrics for k=16 nearest neighbors in Tab. 6 for the data in the motivational example in Fig. 1 in the main paper. This experiment demonstrates that stacking and normalized stacking struggle with neighborhood preservation. In contrast, the method proposed in this paper (ours), achieves a stronger score. B QUESTION...
-
[42]
Gender: Female, Male, Non-binary, Prefer not to say
-
[43]
How familiar are you with wristwatches? (1 = Not at all, 7 = Very familiar):
-
[44]
How often do you explore or purchase watches online?:
-
[45]
1 2 3 4 5 E2 I could efficiently identify watches that matched specific attributes or criteria
Have you used similar interactive visualization systems before? (Yes/No): B.3 Custom Questions (5-point scale, 1 = strongly dis- agree, 5 = strongly agree) Effectiveness E1 The visualization helped me find visually or semantically similar watches easily. 1 2 3 4 5 E2 I could efficiently identify watches that matched specific attributes or criteria. 1 2 3 ...
-
[46]
Age (Experts): 40, 47, 57, 67
-
[47]
Age (Novices): 23, 29, 31, 33, 35, 38
-
[48]
Gender (Experts): f, m, m, m
-
[49]
Gender (Novices): f, f, m, m, m, m
-
[50]
Familiarity with wristwatches (Experts, 1–7): 6, 7, 7, 6
-
[51]
Familiarity with wristwatches (Novices, 1–7): 1, 2, 3, 4, 2, 2
-
[52]
Online watch exploration frequency (Experts): responses ranged from approximately 3–4 times per week to 4 times per month
-
[53]
Online watch exploration frequency (Novices): most participants reported infrequent exploration, typically only occasionally or when considering a purchase, with the highest frequencies around once per month
-
[54]
Prior use of similar interactive visualization systems (Experts): no, no, no, no
-
[55]
Prior use of similar interactive visualization systems (Novices): no, no, no, no, no, no I1 Experts – – – 2 2 Novices – – 3 2 1 I2 Experts – – – 1 3 Novices – – 2 2 2 I3 Experts – – – 3 1 Novices – – 1 4 1 I4 Experts – – – 3 1 Novices – – 3 2 1 I5 Experts – – – 3 1 Novices – – 2 2 2 Strongly disagree Strongly agree Table 8: Evaluation results for question...
discussion (0)
Sign in with ORCID, Apple, or X to comment. Anyone can read and Pith papers without signing in.