Learning as Observable Matrix Dynamics: Diffusive Relaxations versus Phase Transitions
Pith reviewed 2026-06-30 06:58 UTC · model grok-4.3
The pith
Observable Matrix Dynamics distinguishes diffusive relaxation from sharp geometric reorganizations in neural network training via fixed-size distance matrices.
A machine-rendered reading of the paper's core claim, the machinery that carries it, and where it could break.
Core claim
Observable Matrix Dynamics (OMD) is a diagnostic framework that probes the dynamics of high-dimensional internal representations of inputs by a neural network via a fixed-size N × N distance matrix M(t) on a held set of N inputs. OMD uses methods of random matrix theory and particle dynamics to explore spectral reorganisations that are missed by scalar loss functions, but are informative of the training process. We read M(t) against a perturbative ambient-versus-latent decomposition extending the Bogomolny--Bohigas--Schmit (BBS) theory of random distance matrices, with per-snapshot diagnostics for the top-of-spectrum band structure and ambient noise, trajectory-level observables linking snap
What carries the argument
Observable Matrix Dynamics (OMD) applied to the time-evolving distance matrix M(t), read through a perturbative ambient-versus-latent decomposition extending BBS random-matrix theory, with top-of-spectrum band diagnostics and 3D MDS trajectory embeddings.
If this is right
- Diffusive training regimes are diagnosed by the absence of persistent top-of-spectrum band structure in M(t).
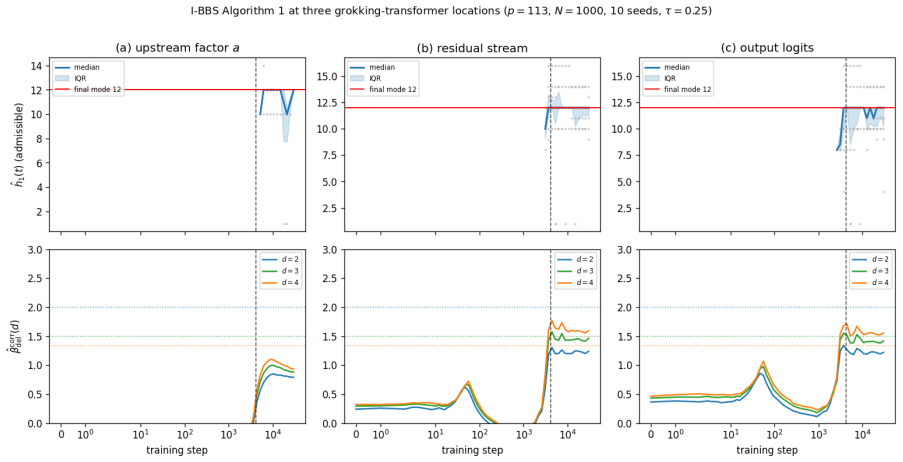
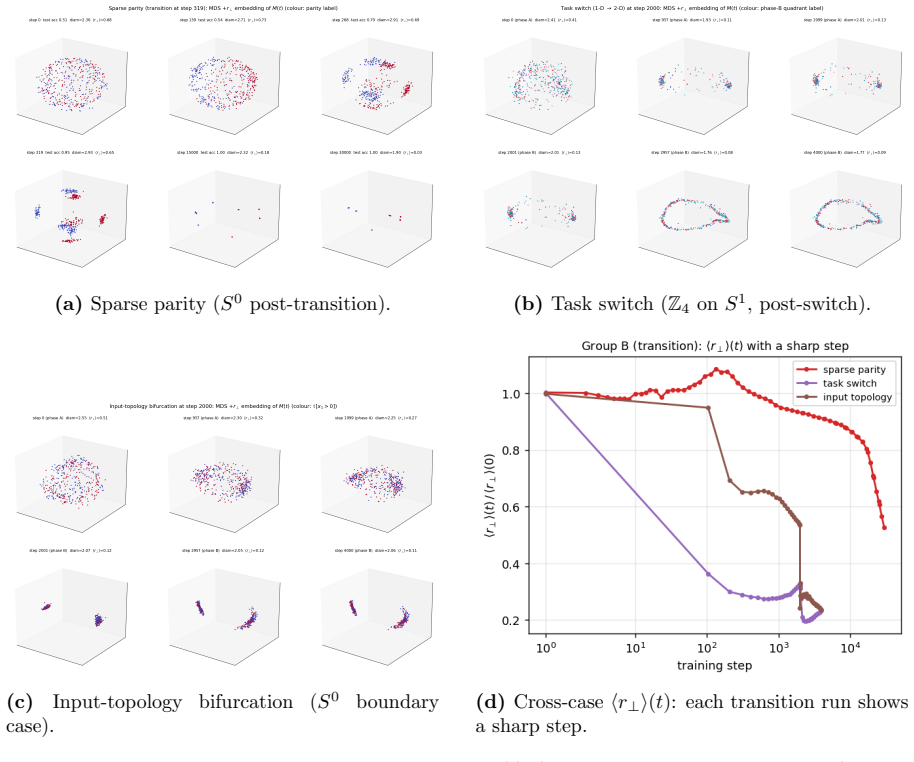
- Sharp endogenous or externally driven reorganizations leave stable fingerprints whose geometry can be classified as smooth, product, cluster, or soliton type.
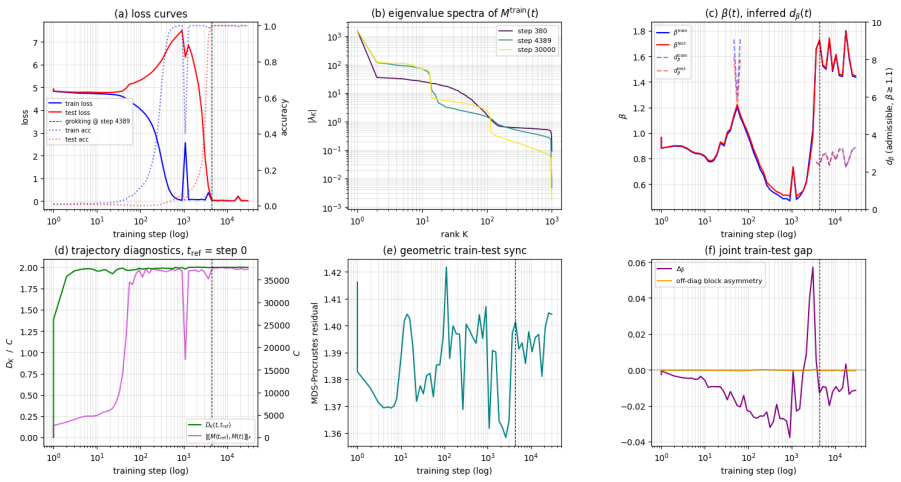
- Scalar loss curves miss the spectral reorganizations that OMD detects at the level of the representation geometry.
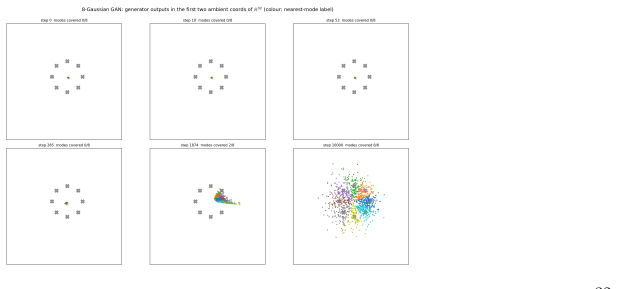
- Training trajectories can be visualized as a moving particle cloud in the bottom-three eigenvectors of M(t).
Where Pith is reading between the lines
- OMD could be applied to detect phase-transition-like events in other high-dimensional dynamical systems whose state is captured by evolving distance matrices.
- The method supplies a concrete diagnostic for when a representation has settled into a stable latent geometry versus continued diffusion.
- Because it operates on a fixed held-out set, OMD can be inserted into existing training loops without changing the optimization itself.
Load-bearing premise
The perturbative ambient-versus-latent decomposition extending BBS theory of random distance matrices applies to the distance matrices extracted from neural network internal representations.
What would settle it
A controlled experiment in which a sharp reorganization of representations occurs yet the top-of-spectrum band structure remains unstable or absent would falsify the claim that reorganizations produce stable geometric fingerprints.
Figures
read the original abstract
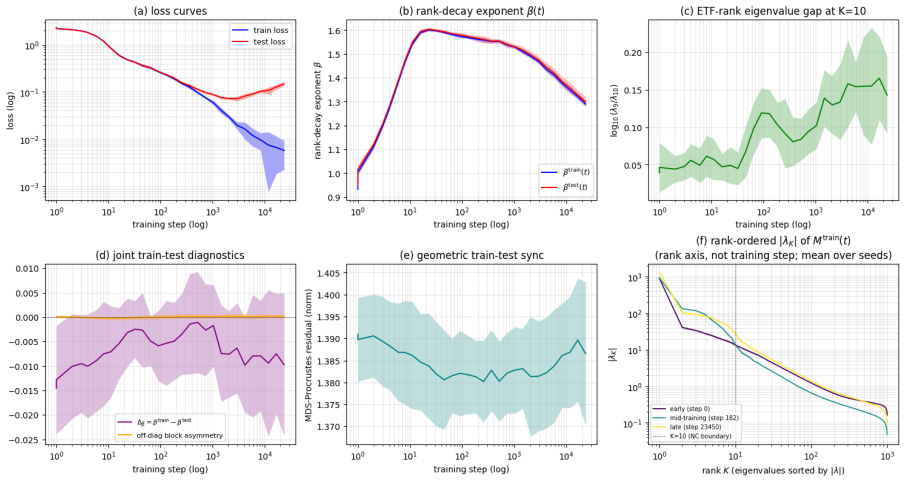
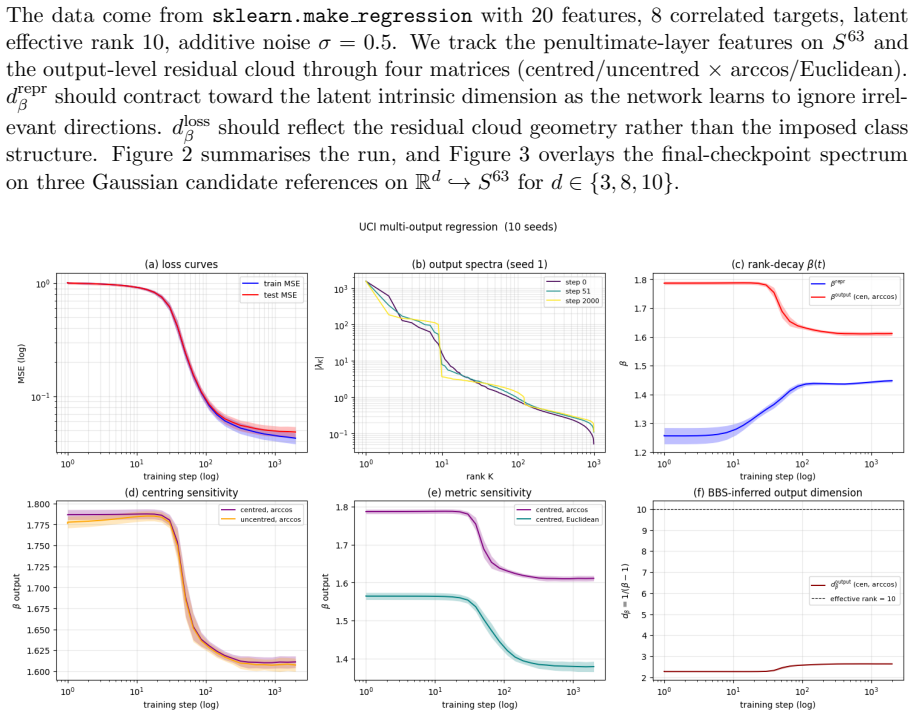
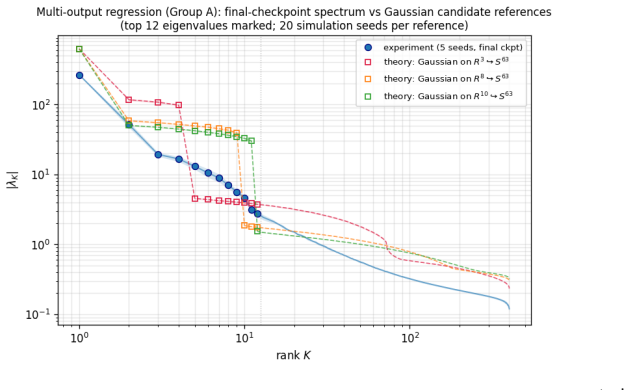
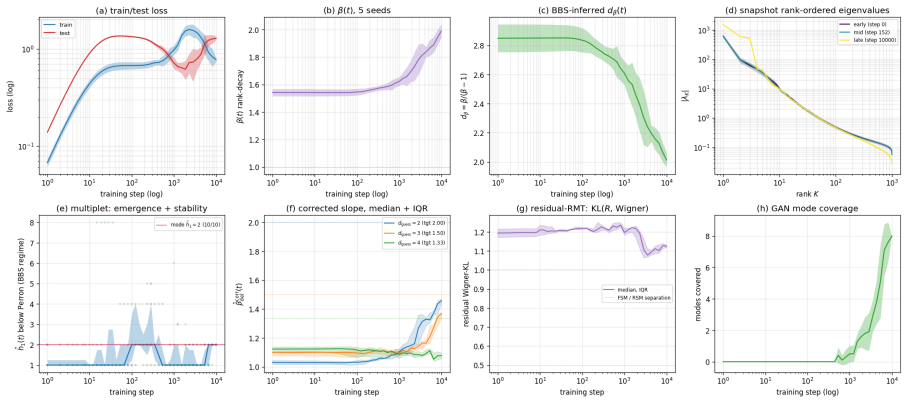
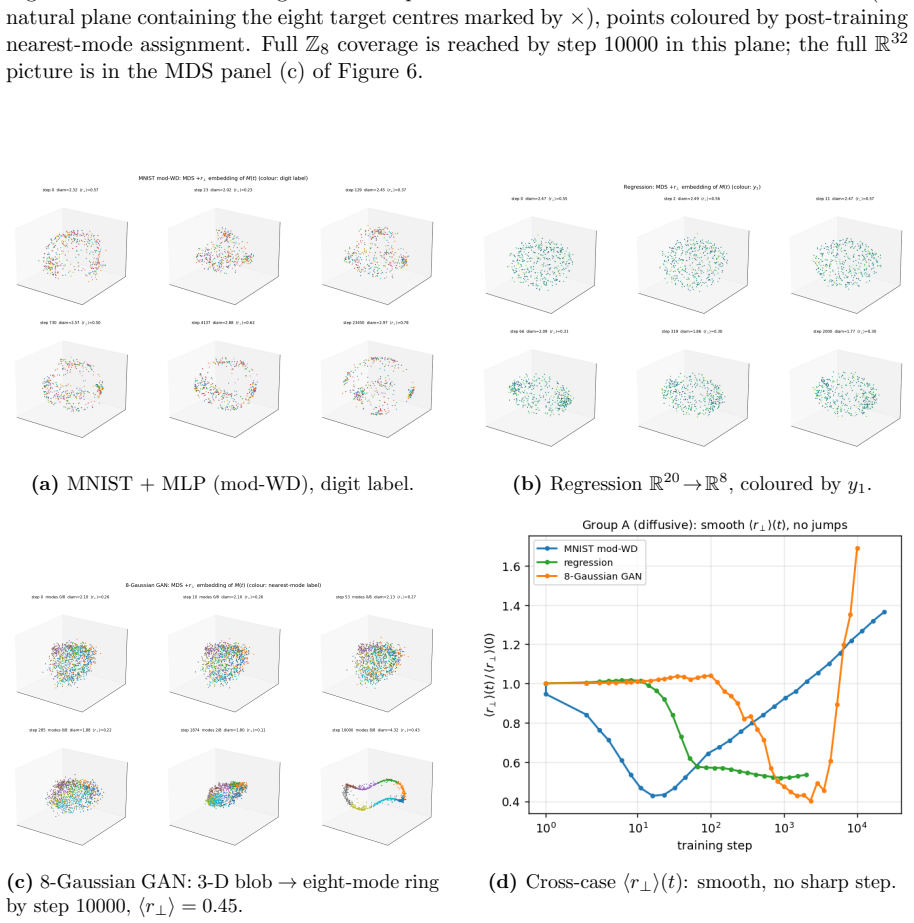
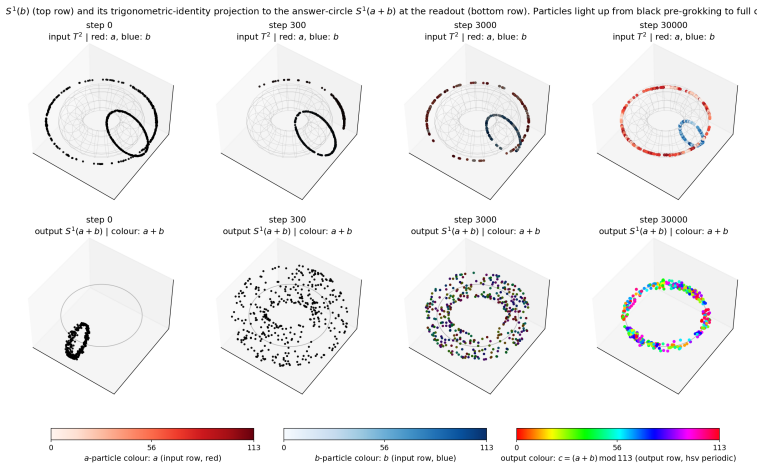
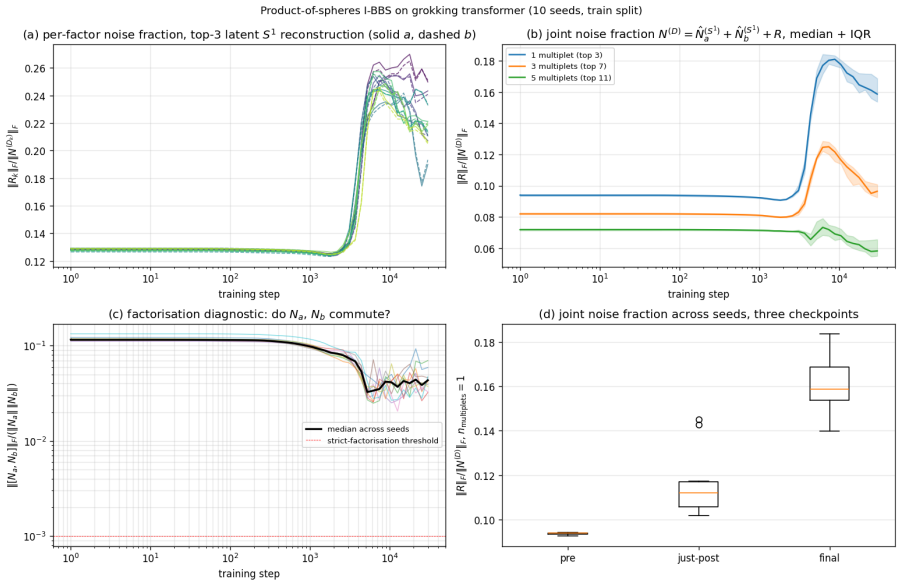
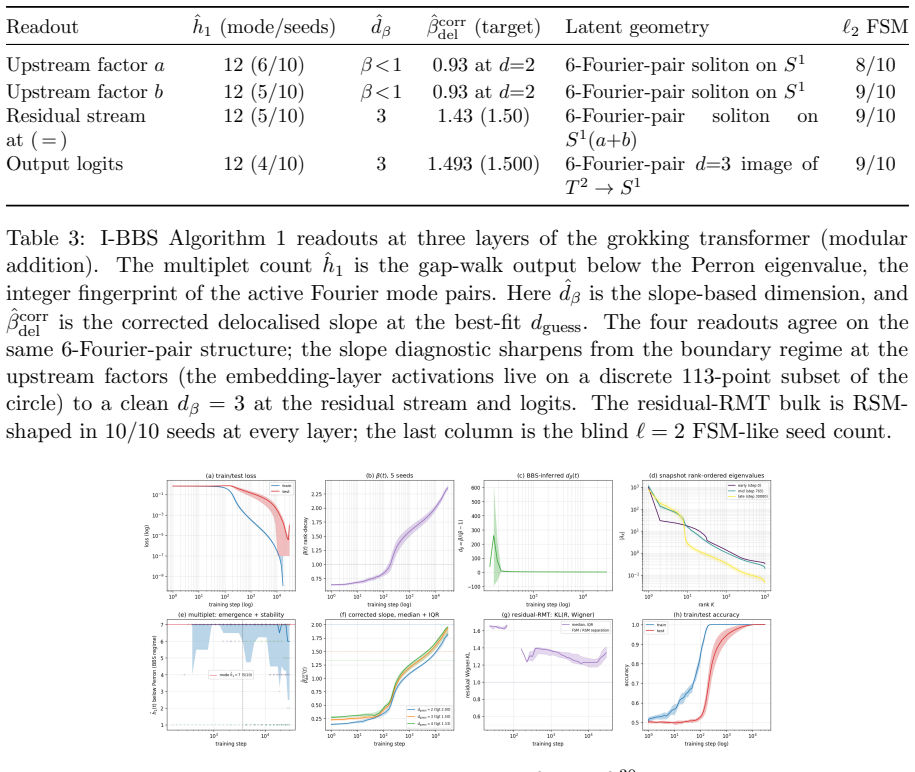
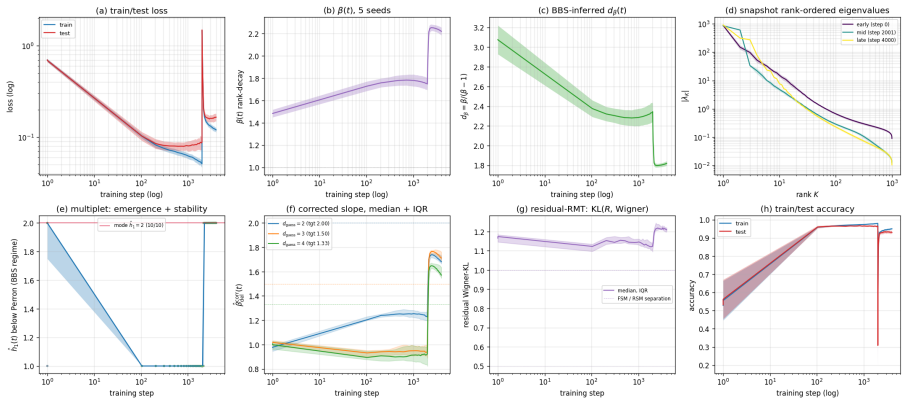
Observable Matrix Dynamics (OMD) is a diagnostic framework that probes the dynamics of high-dimensional internal representations of inputs by a neural network via a fixed-size $N \times N$ distance matrix $M(t)$ on a held set of $N$ inputs. OMD uses methods of random matrix theory and particle dynamics to explore spectral reorganisations that are missed by scalar loss functions, but are informative of the training process. We read $M(t)$ against a perturbative ambient-versus-latent decomposition extending the Bogomolny--Bohigas--Schmit (BBS) theory of random distance matrices, with per-snapshot diagnostics for the top-of-spectrum band structure and ambient noise, trajectory-level observables linking snapshots, and a 3D MDS embedding (bottom-three eigenvectors) rendering training as a moving particle cloud. Across seven experiments, diffusive regimes lack stable top-of-spectrum band structure, while sharp endogenous or externally driven reorganisations produce stable fingerprints: consistent with smooth or product latent geometries in BBS-adjacent cases, and with finite-cluster or Fourier-soliton structures otherwise. OMD thus reads the geometric regime of a representation rather than reporting a single intrinsic dimension.
Editorial analysis
A structured set of objections, weighed in public.
Referee Report
Summary. The paper introduces Observable Matrix Dynamics (OMD), a framework that constructs a fixed-size N×N Euclidean distance matrix M(t) from a held-out set of inputs at each training snapshot t of a neural network, then applies random-matrix diagnostics (top-of-spectrum band structure, ambient noise) and a 3D MDS embedding to track spectral reorganizations. It extends the Bogomolny–Bohigas–Schmit (BBS) perturbative ambient-versus-latent decomposition to these matrices and reports that diffusive regimes lack stable band structure while sharp endogenous or externally driven reorganizations produce stable fingerprints consistent with smooth/product latent geometries (or finite-cluster/Fourier-soliton structures). The central claim is that OMD reads the geometric regime of a representation rather than a single intrinsic dimension, demonstrated across seven experiments.
Significance. If the BBS extension is shown to apply, OMD would supply a geometrically interpretable, falsifiable diagnostic that distinguishes training regimes missed by scalar losses and links observed spectral stability to latent geometry classes; the provision of trajectory-level observables and reproducible MDS visualizations would be a concrete strength.
major comments (2)
- [Abstract and the section introducing the BBS extension] The central claim—that stable top-of-spectrum fingerprints map to smooth or product latent geometries—rests on the perturbative ambient-versus-latent decomposition of BBS theory applying to the deterministic Euclidean distance matrices M(t) extracted from NN representations. No derivation is supplied showing that eigenvalue repulsion or band-structure corrections survive the non-random, input-correlated structure of these matrices (as opposed to ensembles of random distance matrices on a manifold).
- [Abstract] The abstract states experimental outcomes across seven experiments (diffusive regimes lack stable band structure; sharp reorganizations produce stable fingerprints) but supplies no derivations, error analysis, data details, or validation steps for the per-snapshot diagnostics or the mapping from observed band stability to geometry classes.
minor comments (1)
- Notation for the distance matrix M(t) and the precise definition of the top-of-spectrum band should be introduced with an equation number on first use.
Simulated Author's Rebuttal
We thank the referee for the constructive and detailed report. We address each major comment below, indicating planned revisions where appropriate.
read point-by-point responses
-
Referee: [Abstract and the section introducing the BBS extension] The central claim—that stable top-of-spectrum fingerprints map to smooth or product latent geometries—rests on the perturbative ambient-versus-latent decomposition of BBS theory applying to the deterministic Euclidean distance matrices M(t) extracted from NN representations. No derivation is supplied showing that eigenvalue repulsion or band-structure corrections survive the non-random, input-correlated structure of these matrices (as opposed to ensembles of random distance matrices on a manifold).
Authors: We acknowledge that the manuscript does not contain a full analytic derivation establishing that the BBS perturbative decomposition (eigenvalue repulsion and band-structure corrections) carries over exactly to deterministic Euclidean distance matrices M(t) whose entries are correlated through the neural-network representation. The extension is motivated by the fact that each M(t) remains a Euclidean distance matrix on the representation manifold, and the observed diagnostics are presented as an empirical extension of BBS rather than a proven identity. In the revised manuscript we will add an explicit subsection in the methods clarifying the assumptions, the heuristic character of the extension, and the empirical support from the experiments; we will also note that a complete proof under input correlations lies outside the present scope. revision: partial
-
Referee: [Abstract] The abstract states experimental outcomes across seven experiments (diffusive regimes lack stable band structure; sharp reorganizations produce stable fingerprints) but supplies no derivations, error analysis, data details, or validation steps for the per-snapshot diagnostics or the mapping from observed band stability to geometry classes.
Authors: The abstract is written as a concise summary of the central findings; the derivations, error analysis, data specifications, and validation procedures for the per-snapshot diagnostics and geometry-class mapping are supplied in Sections 2–4 and the appendices. To improve clarity we will revise the abstract to include a single sentence directing readers to those sections for the technical details of the diagnostics and the empirical mapping. revision: yes
Circularity Check
No significant circularity; derivation self-contained against external BBS benchmark
full rationale
The paper introduces OMD as a new diagnostic that extracts fixed-size distance matrices M(t) from NN representations and reads them against an explicit perturbative extension of the external Bogomolny-Bohigas-Schmit (BBS) random-matrix theory. No equation or observable is defined in terms of itself, no fitted parameter is relabeled as a prediction, and the central mapping from band-structure stability to latent geometry is presented as an empirical reading of the extended BBS diagnostics rather than a self-referential identity. The framework therefore remains non-circular; its load-bearing step is the applicability of the BBS extension to deterministic NN distance matrices, which is an external modeling assumption rather than an internal definitional loop.
Axiom & Free-Parameter Ledger
axioms (1)
- domain assumption The Bogomolny--Bohigas--Schmit (BBS) theory of random distance matrices admits a perturbative ambient-versus-latent decomposition that applies to neural network representation matrices M(t).
invented entities (1)
-
Observable Matrix Dynamics (OMD)
no independent evidence
Reference graph
Works this paper leans on
-
[1]
M´ ezard, G
M. M´ ezard, G. Parisi, and A. Zee.Spectra of Euclidean random matrices. Nuclear Physics B559, 689–701 (1999)
1999
-
[2]
Euclidean random matrices and their applications in physics
A. Goetschy and S. E. Skipetrov.Euclidean random matrices and their applications in physics.arXiv:1303.2880, 2013
work page internal anchor Pith review Pith/arXiv arXiv 2013
-
[3]
Spectral properties of distance matrices
E. Bogomolny, O. Bohigas, and C. Schmit.Spectral properties of distance matrices. Journal of Physics A: Mathematical and General36, 3595–3616 (2003). arXiv:nlin/0301044
work page internal anchor Pith review Pith/arXiv arXiv 2003
-
[4]
Distance matrices and isometric embeddings
E. Bogomolny, O. Bohigas, and C. Schmit.Distance matrices and isometric embeddings. arXiv:0710.2063, 2007
work page internal anchor Pith review Pith/arXiv arXiv 2063
-
[5]
Halperin.I-BBS: Inference of Latent Sub-Manifolds in Representation Spaces Using Ran- dom Distance Matrices.2026
I. Halperin.I-BBS: Inference of Latent Sub-Manifolds in Representation Spaces Using Ran- dom Distance Matrices.2026
2026
-
[6]
Frustrated Dynamics of Distance Matrices
I. Halperin.Frustrated Dynamics of Distance Matrices.arXiv:2605.05376, 2026
work page internal anchor Pith review Pith/arXiv arXiv 2026
-
[7]
Grokking: Generalization Beyond Overfitting on Small Algorithmic Datasets
A. Power, Y. Burda, H. Edwards, I. Babuschkin, V. Misra.Grokking: generalization beyond overfitting on small algorithmic datasets.arXiv:2201.02177, 2022
work page internal anchor Pith review Pith/arXiv arXiv 2022
-
[8]
Halperin.Grokking as Bagel Formation in Activation Space: Spectral Evidence for a Phase Transition.2026
I. Halperin.Grokking as Bagel Formation in Activation Space: Spectral Evidence for a Phase Transition.2026
2026
-
[9]
M´ ezard, G
M. M´ ezard, G. Parisi, and M. A. Virasoro.Spin Glasses and Beyond: An Introduction to the Replica Method and Its Applications.World Scientific, Singapore (1987)
1987
-
[10]
Kriegeskorte, M
N. Kriegeskorte, M. Mur, P. A. Bandettini.Representational similarity analysis: connecting the branches of systems neuroscience. Frontiers in Systems Neuroscience2, 4 (2008)
2008
-
[11]
Kornblith, M
S. Kornblith, M. Norouzi, H. Lee, G. Hinton.Similarity of neural network representations revisited.InICML(2019)
2019
-
[12]
Papyan, X
V. Papyan, X. Y. Han, D. L. Donoho.Prevalence of neural collapse during the terminal phase of deep learning training. Proceedings of the National Academy of Sciences117(40), 24652–24663 (2020)
2020
-
[13]
C. Fang, H. He, Q. Long, W. J. Su.Exploring deep neural networks via layer-peeled model: minority collapse in imbalanced training. Proceedings of the National Academy of Sciences 118, e2103091118 (2021)
2021
-
[14]
Zhuet al..A geometric analysis of neural collapse with unconstrained features.In NeurIPS(2021)
Z. Zhuet al..A geometric analysis of neural collapse with unconstrained features.In NeurIPS(2021)
2021
- [15]
-
[16]
H. He, W. J. Su.A law of data separation in deep learning. Proceedings of the National Academy of Sciences120, e2221704120 (2023). 53
2023
-
[17]
Rangamani, M
A. Rangamani, M. Lindegaard, T. Galanti, T. A. Poggio.Feature learning in deep classifiers through intermediate neural collapse.InICML(2023)
2023
-
[18]
Facco, M
E. Facco, M. d’Errico, A. Rodriguez, A. Laio.Estimating the intrinsic dimension of datasets by a minimal neighborhood information. Scientific Reports7, 12140 (2017)
2017
-
[19]
Ansuini, A
A. Ansuini, A. Laio, J. H. Macke, D. Zoccolan.Intrinsic dimension of data representations in deep neural networks.InNeurIPS(2019)
2019
-
[20]
C. Li, H. Farkhoor, R. Liu, J. Yosinski.Measuring the intrinsic dimension of objective landscapes.InICLR(2018)
2018
- [21]
-
[22]
Progress measures for grokking via mechanistic interpretability
N. Nanda, L. Chan, T. Lieberum, J. Smith, J. Steinhardt.Progress measures for grokking via mechanistic interpretability.arXiv:2301.05217, 2023
work page internal anchor Pith review Pith/arXiv arXiv 2023
-
[23]
M. M. Bronstein, J. Bruna, T. Cohen, P. Veliˇ ckovi´ c.Geometric deep learning: grids, groups, graphs, geodesics, and gauges.arXiv:2104.13478, 2021
work page internal anchor Pith review Pith/arXiv arXiv 2021
-
[24]
Cohen, M
T. Cohen, M. Welling.Group equivariant convolutional networks.InICML(2016)
2016
-
[25]
Esteves, C
C. Esteves, C. Allen-Blanchette, A. Makadia, K. Daniilidis.Learning SO(3) equivariant representations with spherical CNNs.InECCV(2018)
2018
-
[26]
Halperin.Order Out of Noise and Disorder: Fate of the Frustrated Manifold
I. Halperin.Order Out of Noise and Disorder: Fate of the Frustrated Manifold. arXiv:2601.18653, 2026
-
[27]
Frustrated Fields: Statistical Field Theory for Frustrated Brownian Particles on 2D Manifolds
I. Halperin.Frustrated Fields: Statistical Field Theory for Frustrated Brownian Particles on 2D Manifolds.arXiv:2605.05366, 2026
work page internal anchor Pith review Pith/arXiv arXiv 2026
-
[28]
Davis and W
C. Davis and W. M. Kahan.The rotation of eigenvectors by a perturbation. III. SIAM Journal on Numerical Analysis7(1), 1–46 (1970)
1970
-
[29]
R. M. Gray.Toeplitz and Circulant Matrices: A Review. Foundations and Trends in Com- munications and Information Theory2(3), 155–239 (2006)
2006
-
[30]
M. A. Sustik, J. A. Tropp, I. S. Dhillon, R. W. Heath.On the existence of equiangular tight frames. Linear Algebra and its Applications426(2–3), 619–635 (2007)
2007
- [31]
-
[32]
L. D. Landau and E. M. Lifshitz.Statistical Physics, Part 1.Course of Theoretical Physics, Vol. 5, 3rd ed., Pergamon Press, Oxford, 1980
1980
-
[33]
T. H. Gr¨ onwall.Note on the derivatives with respect to a parameter of the solutions of a system of differential equations. Ann. of Math.20, 292–296 (1919)
1919
-
[34]
Alstott, E
J. Alstott, E. Bullmore, D. Plenz.powerlaw: A Python package for analysis of heavy-tailed distributions. PLoS ONE9, e85777 (2014)
2014
-
[35]
C. H. Martin, T. S. Peng, M. W. Mahoney.Predicting trends in the qual- ity of state-of-the-art neural networks without access to training or test- ing data. Nature Communications12, 4122 (2021). WeightWatcher package: https://github.com/CalculatedContent/WeightWatcher. 54
2021
discussion (0)
Sign in with ORCID, Apple, or X to comment. Anyone can read and Pith papers without signing in.