Universal distance modes from DESI BAO and Type Ia supernovae: what do cosmological rulers actually measure?
Pith reviewed 2026-06-30 04:38 UTC · model grok-4.3
The pith
The leading direction in DESI BAO and supernova distance data measures Omega_m h^2 and carries the tension with CMB predictions.
A machine-rendered reading of the paper's core claim, the machinery that carries it, and where it could break.
Core claim
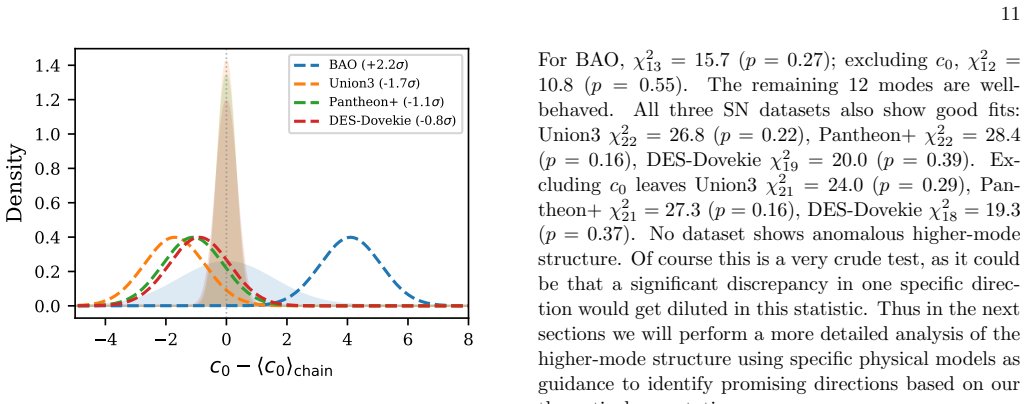
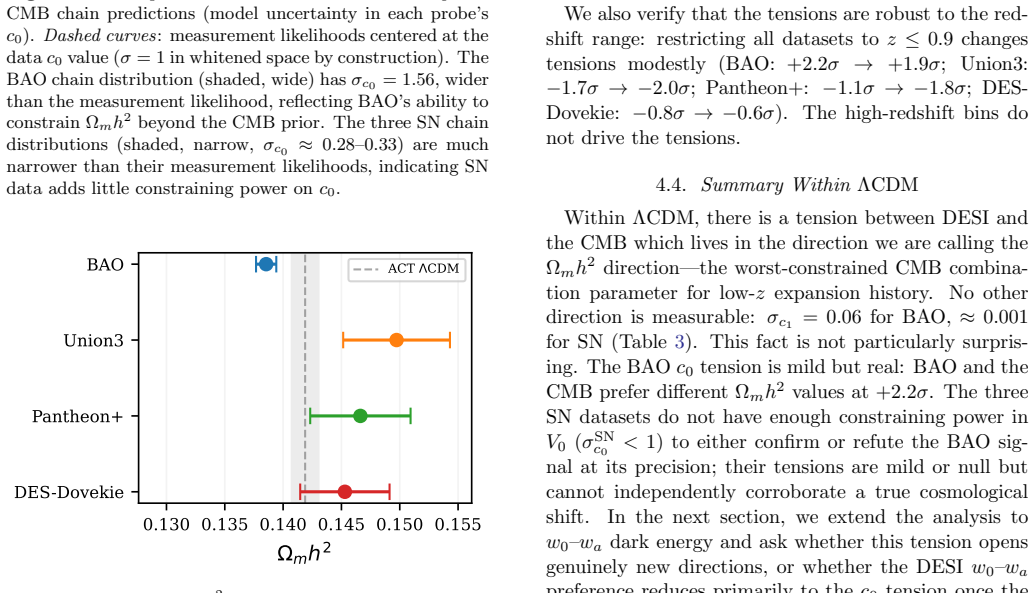
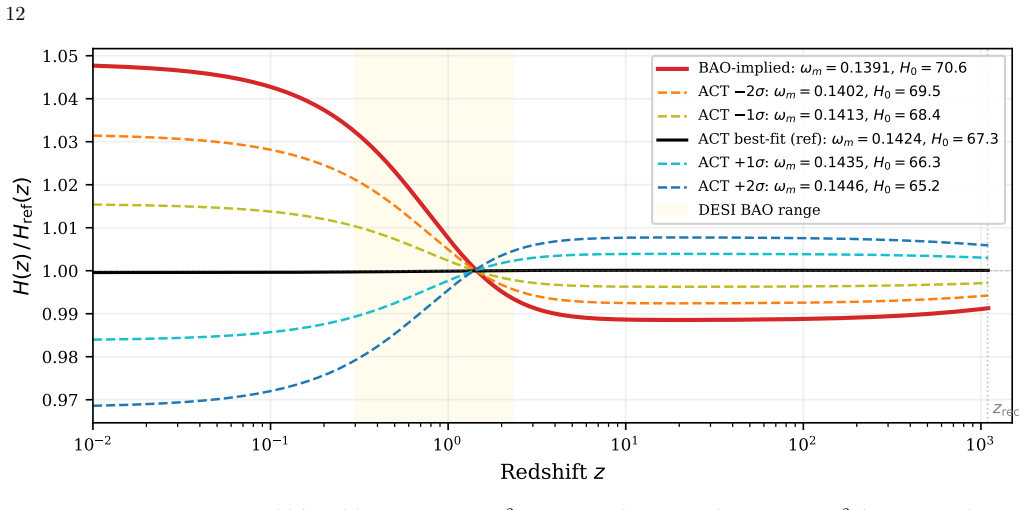
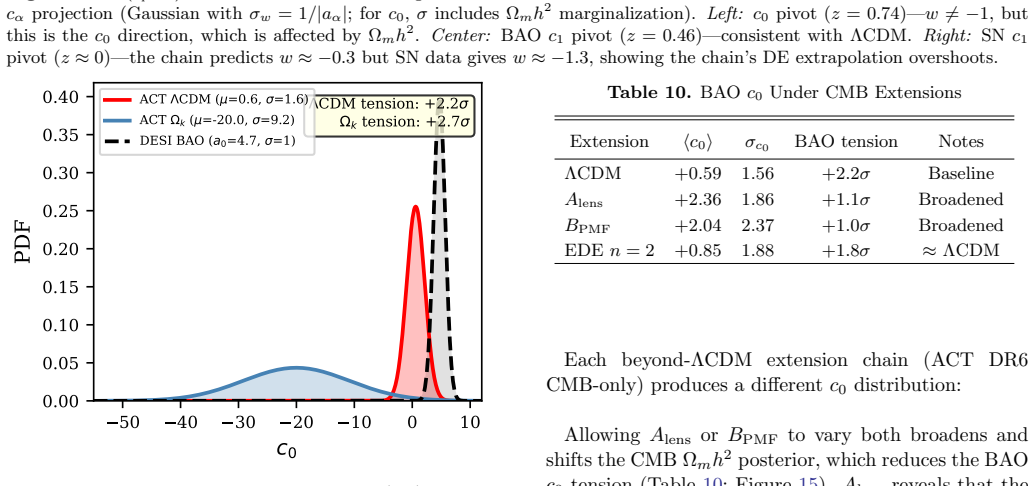
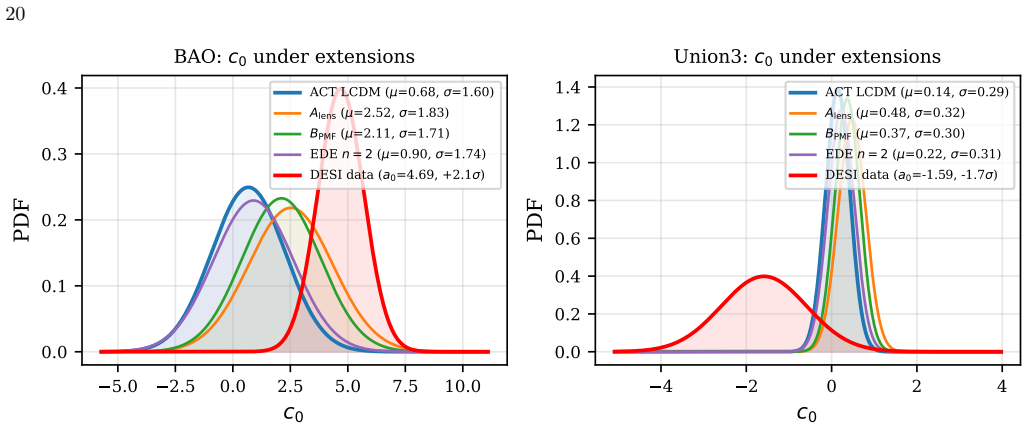
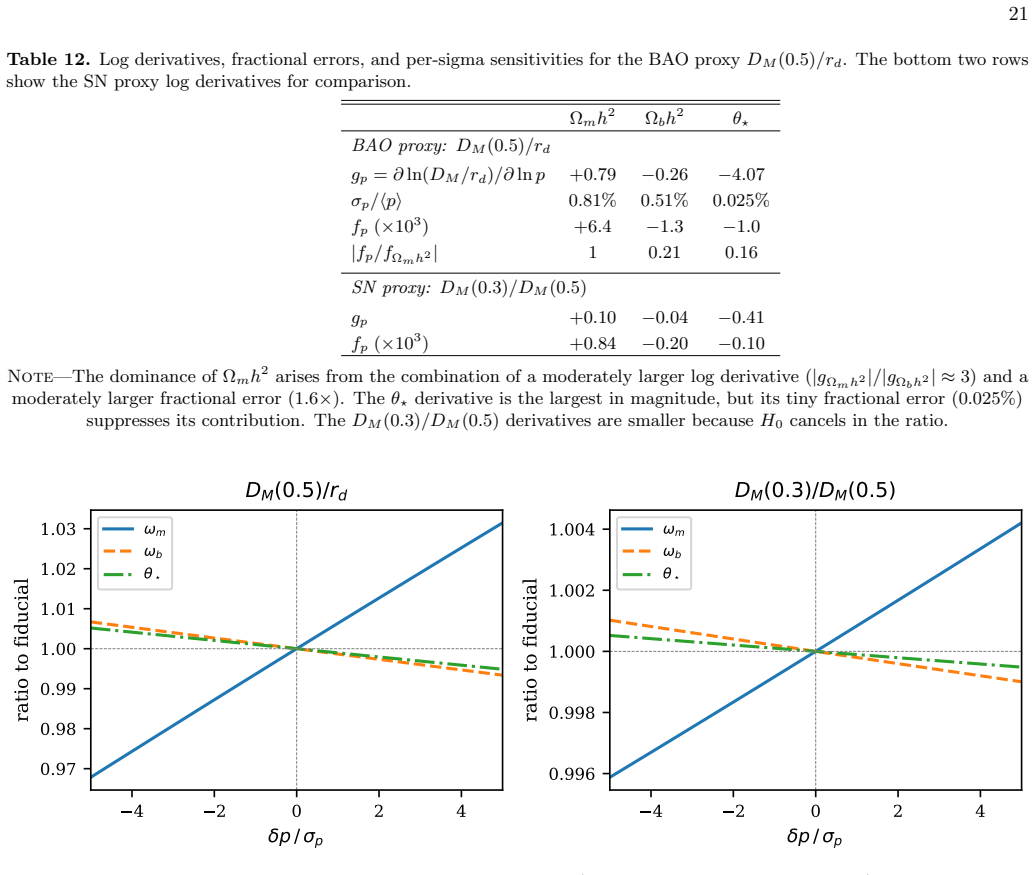
The leading linear direction V_0, whose amplitude is denoted c_0, is to high accuracy a measurement of Omega_m h^2. The projection of the data onto V_0 essentially probes this single combination of parameters derived from the cosmic microwave background. Baryon acoustic oscillation measurements constrain the parameter more tightly than the cosmic microwave background itself, whereas the three supernova compilations do not. In every extension of the standard model examined, V_0 remains the leading measurable direction and contains most of the tension with cosmic microwave background predictions.
What carries the argument
Singular value decomposition of the low-redshift distance measurements, which isolates the leading linear directions in the data and maps their amplitudes to specific cosmological parameter combinations.
If this is right
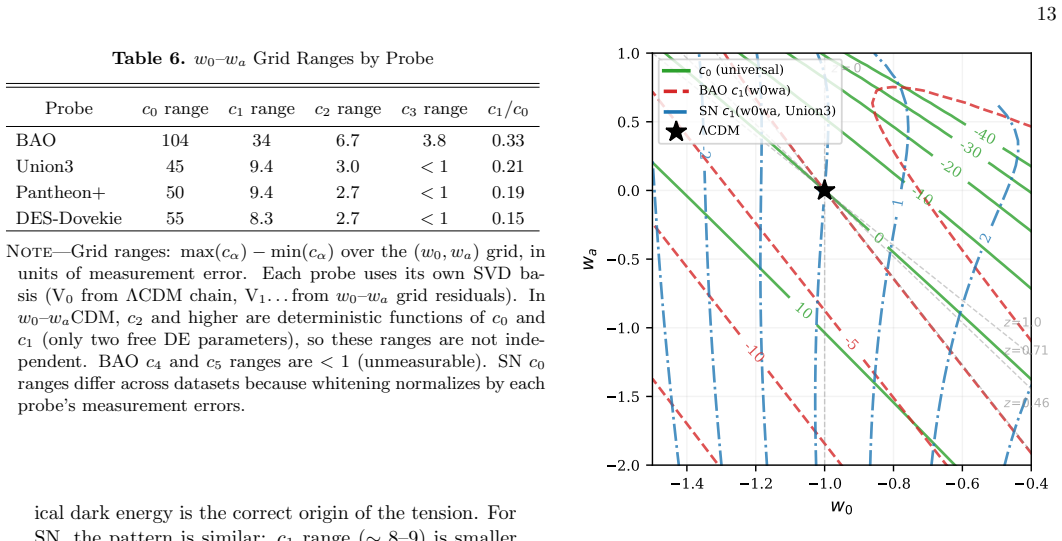
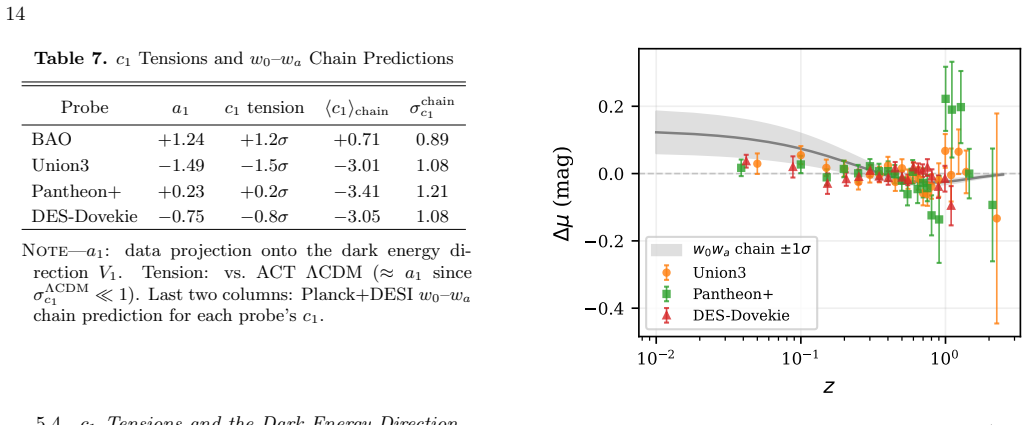
- In the w0-wa extension of the standard model a second measurable direction appears that tests dynamical dark energy independently, and the data show no significant tension in that direction.
- Spatial curvature is the only other extension that opens a genuinely new measurable direction, and only marginally for baryon acoustic oscillation data.
- Both measurable directions in the curvature extension independently favor positive spatial curvature, although the second direction remains poorly constrained.
- The leading direction V_0 stays dominant in all considered extensions and continues to host the primary tension with cosmic microwave background predictions.
Where Pith is reading between the lines
- Future surveys could target tighter measurements of this specific parameter combination to resolve or confirm the reported tension.
- The result suggests that apparent cosmological tensions may concentrate in measurements of Omega_m h^2 rather than requiring wholesale revision of the underlying model.
- If the mapping from data directions to parameters holds, analyses of combined datasets should prioritize checking consistency in this leading direction before interpreting broader parameter shifts.
Load-bearing premise
The singular value decomposition applied to the distance data accurately isolates linear directions that correspond directly to individual cosmological parameters such as Omega_m h^2 without substantial mixing from nonlinear effects, unmodeled systematics, or covariance errors.
What would settle it
A direct computation showing that the amplitude c_0 extracted from the data deviates significantly from the Omega_m h^2 value inferred from the cosmic microwave background, or that adding nonlinear corrections or revised covariances alters which direction emerges as leading.
Figures
read the original abstract
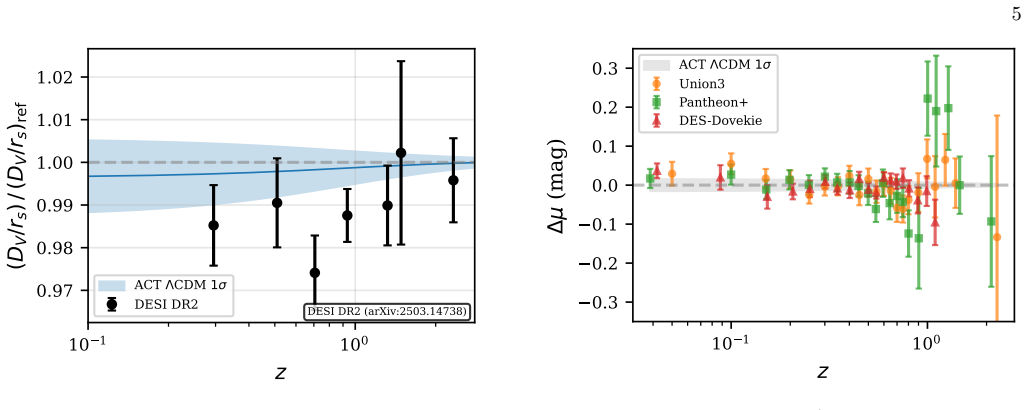
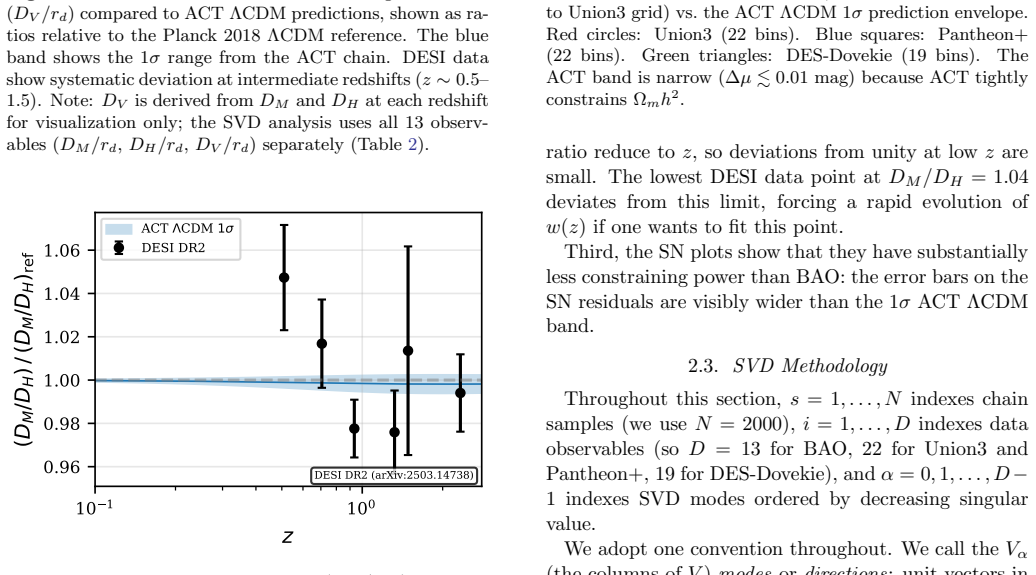
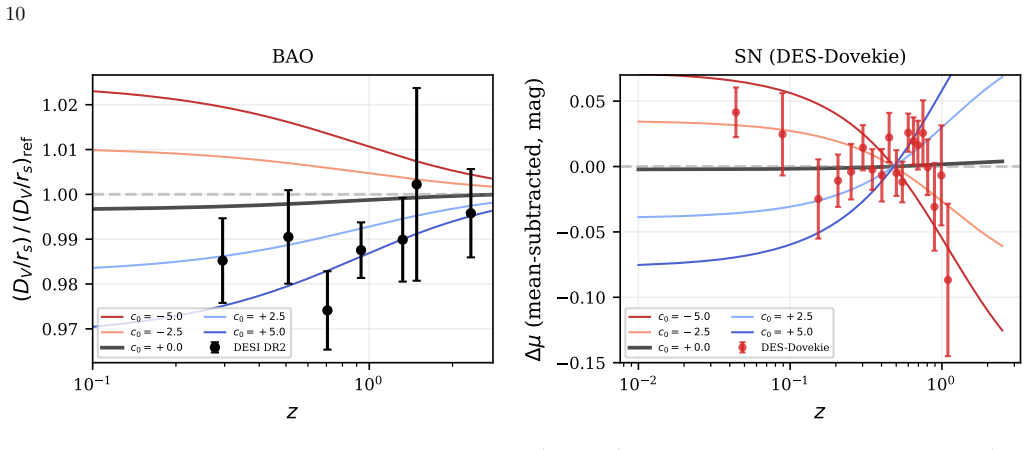
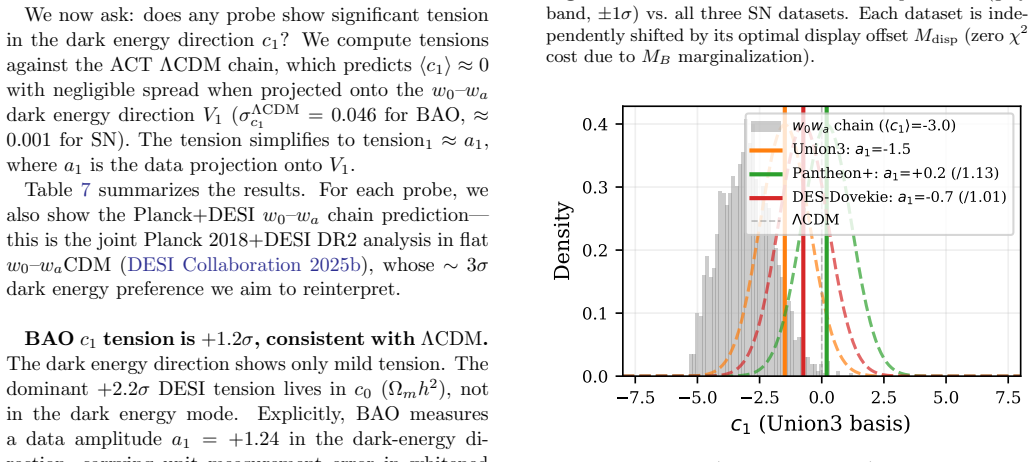
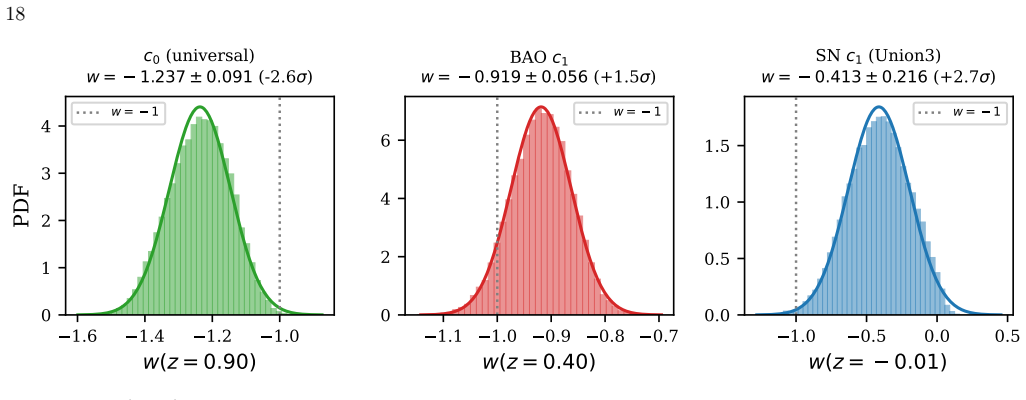
We use an SVD decomposition of the low-redshift distance measurements from DESI BAO and three Type Ia supernova compilations to identify the leading linear directions probed by the data and to localize the tension with the LCDM CMB-anchored predictions. The leading direction V_0 -- whose data amplitude we denote c_0 -- is, to high accuracy, a measurement of Omega_m h^2: the projection of the data on V_0 probes essentially this one CMB-derived parameter combination. BAO constrains this parameter more tightly than the CMB itself; the three SN compilations do not. In every extension of LCDM we consider, the leading measurable direction remains V_0, and it is where most of the tension with the CMB resides. In the w0-wa extension a second direction V_1 becomes measurable and provides an independent test of dynamical dark energy; the data show no significant tension in this direction. The only other beyond-LCDM extension that opens a genuinely new measurable direction is spatial curvature, and only marginally and only for BAO; both measurable directions then independently prefer positive spatial curvature, though the second direction is poorly constrained.
Editorial analysis
A structured set of objections, weighed in public.
Referee Report
Summary. The manuscript applies an SVD decomposition to low-redshift distance measurements from DESI BAO and three Type Ia supernova compilations. It identifies the leading direction V_0 (with amplitude c_0) as corresponding to high accuracy with a measurement of Ω_m h², reports that BAO constrains this combination more tightly than the CMB while the SN samples do not, and states that this direction captures most of the tension with CMB-anchored LCDM predictions; in extensions, V_0 remains the leading measurable direction except for w0-wa (where V_1 tests dynamical dark energy with no tension) and spatial curvature (where both directions marginally prefer positive curvature for BAO).
Significance. If the mapping of V_0 to Ω_m h² is robust, the work supplies a data-driven decomposition that localizes tensions to specific linear combinations and supplies independent tests of extensions, offering a clearer interpretation of what BAO and SN distance data actually measure beyond conventional parameter fits.
major comments (2)
- [Abstract] Abstract: the central claim that V_0 is 'to high accuracy' a measurement of Ω_m h² rests on an untested linearity assumption in the distance-redshift mapping; the manuscript provides no explicit check (finite-difference vs. analytic derivatives, mock recovery, or projection of second-order curvature/dark-energy terms) that higher-order contributions at the probed redshifts do not rotate V_0 or contaminate c_0 with w or Ω_k.
- [Abstract] Abstract: no information is given on data selection criteria, covariance matrix construction (including low-z systematics), robustness tests against fiducial cosmology choice, or error propagation through the SVD; these omissions are load-bearing for assessing whether the reported alignment with Ω_m h² and the relative constraining power of BAO vs. CMB hold.
Simulated Author's Rebuttal
We thank the referee for their careful reading and constructive comments. We address each major comment below and will incorporate revisions to strengthen the manuscript.
read point-by-point responses
-
Referee: [Abstract] Abstract: the central claim that V_0 is 'to high accuracy' a measurement of Ω_m h² rests on an untested linearity assumption in the distance-redshift mapping; the manuscript provides no explicit check (finite-difference vs. analytic derivatives, mock recovery, or projection of second-order curvature/dark-energy terms) that higher-order contributions at the probed redshifts do not rotate V_0 or contaminate c_0 with w or Ω_k.
Authors: We agree that an explicit validation of the linearity assumption would strengthen the central claim. In the revised manuscript we will add an appendix performing finite-difference checks on the distance-redshift relation at DESI and SN redshifts, comparing against analytic derivatives and projecting second-order contributions from w and Ω_k. This will quantify any rotation of V_0 or contamination of c_0 and confirm the alignment remains accurate to the stated level. revision: yes
-
Referee: [Abstract] Abstract: no information is given on data selection criteria, covariance matrix construction (including low-z systematics), robustness tests against fiducial cosmology choice, or error propagation through the SVD; these omissions are load-bearing for assessing whether the reported alignment with Ω_m h² and the relative constraining power of BAO vs. CMB hold.
Authors: The manuscript body describes the DESI BAO and three SN compilations employed, but we acknowledge the abstract and methods summary omit explicit details on selection criteria, covariance construction (including low-z systematics), fiducial-cosmology robustness, and SVD error propagation. We will revise the abstract to include a concise methods statement and expand the main text with a dedicated subsection covering these elements, including additional robustness tests. revision: yes
Circularity Check
No circularity: SVD applied to external data yields directions interpreted via model comparison
full rationale
The paper performs an SVD decomposition directly on the covariance or response of external low-redshift distance data from DESI BAO and SN compilations. The leading vector V_0 and its amplitude c_0 are extracted from the data; the subsequent claim that this direction measures Omega_m h^2 is presented as an empirical finding obtained by projecting the data onto the data-derived mode and comparing the result to the parameter dependence in cosmological models. No step reduces a fitted quantity to a prediction by construction, no self-citation supplies a load-bearing uniqueness theorem, and no ansatz is smuggled in. The derivation therefore remains self-contained against the supplied observational inputs and standard linear-algebra operations.
Axiom & Free-Parameter Ledger
axioms (1)
- domain assumption Low-redshift distance measurements admit an accurate linear SVD decomposition whose leading modes map directly to CMB-derived parameter combinations such as Omega_m h^2.
Reference graph
Works this paper leans on
-
[1]
ACT Collaboration . 2025. 2503.14454
work page internal anchor Pith review Pith/arXiv arXiv 2025
-
[2]
ACT Collaboration , Louis, T., et al. 2025. 2503.14452
work page internal anchor Pith review Pith/arXiv arXiv 2025
-
[3]
Calabrese, E., Slosar, A., Melchiorri, A., Smoot, G. F., & Zahn, O. 2008, , 77, 123531, 10.1103/PhysRevD.77.123531
- [4]
- [5]
-
[6]
DESI Collaboration . 2025 a . 2503.14738
work page internal anchor Pith review Pith/arXiv arXiv 2025
-
[7]
---. 2025 b . 2503.14739
work page internal anchor Pith review Pith/arXiv arXiv 2025
- [8]
- [9]
-
[10]
Eisenstein, D. J., & White, M. J. 2004, , 70, 103523, 10.1103/PhysRevD.70.103523
-
[11]
2006, , 73, 023503, 10.1103/PhysRevD.73.023503
Knox, L. 2006, , 73, 023503, 10.1103/PhysRevD.73.023503
-
[12]
Planck 2018 results. VI. Cosmological parameters
Planck Collaboration . 2020, , 641, A6. 1807.06209
work page internal anchor Pith review Pith/arXiv arXiv 2020
-
[13]
Planck Collaboration , Ade, P. A. R., et al. 2016, , 594, A15. 1502.01591
work page internal anchor Pith review Pith/arXiv arXiv 2016
-
[14]
Popovic, B., et al. 2025, arXiv e-prints. 2511.07517
work page internal anchor Pith review Pith/arXiv arXiv 2025
-
[15]
Qu, F. J., Sherwin, B. D., Madhavacheril, M. S., et al. 2024, , 962, 112. 2304.05202
work page internal anchor Pith review Pith/arXiv arXiv 2024
-
[16]
Rubin, D., et al. 2023. 2311.12098
work page internal anchor Pith review Pith/arXiv arXiv 2023
-
[17]
Sailer, N., Farren, G. S., Ferraro, S., & White, M. 2026, , 136, 081002, 10.1103/PhysRevLett.136.081002
-
[18]
The Pantheon+ Analysis: Cosmological Constraints
Scolnic, D., et al. 2022, , 938, 113. 2202.04077
work page internal anchor Pith review Pith/arXiv arXiv 2022
- [19]
- [20]
discussion (0)
Sign in with ORCID, Apple, or X to comment. Anyone can read and Pith papers without signing in.