Information Terra: A Narrative-Anchored Semantic-First Projection of Document Embeddings
Pith reviewed 2026-07-01 01:46 UTC · model grok-4.3
The pith
Document embeddings are projected onto a globe whose poles are two user-chosen endpoint documents, with latitude encoding narrative progress along their geodesic.
A machine-rendered reading of the paper's core claim, the machinery that carries it, and where it could break.
Core claim
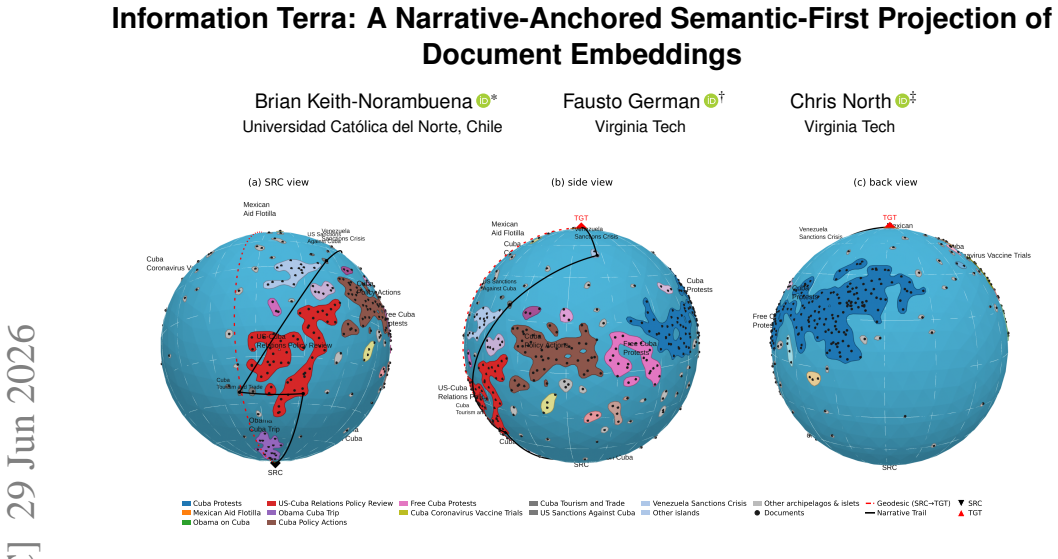
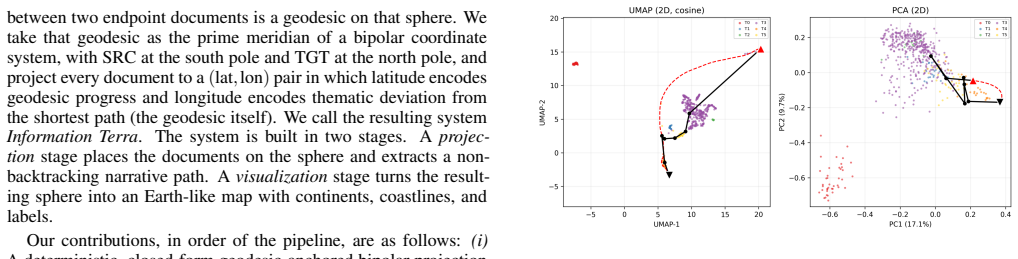
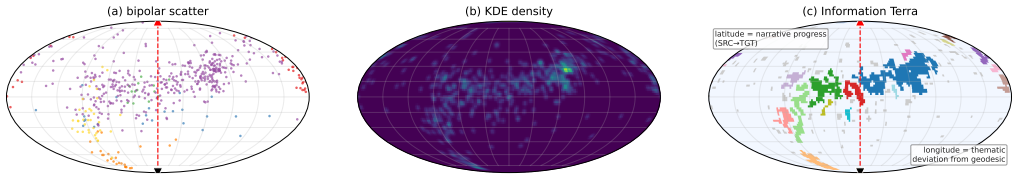
Information Terra is a narrative-anchored semantic-first projection that places a document corpus on an Earth-like globe whose poles are two user-chosen endpoint documents and whose prime meridian is the great-circle geodesic between them on the embedding hypersphere so latitude encodes narrative progress and longitude thematic deviation. Land features are recovered from document density via kernel density estimation and labeled by theme. A narrative trail built from the underlying narrative coherence graph, and constrained to be monotone in geodesic progress, provides a readable storyline. The projection's axes are semantically grounded in the user's chosen narrative endpoints, and the glob
What carries the argument
Narrative-anchored globe projection on the embedding hypersphere with user-chosen endpoints as poles and the great-circle geodesic as prime meridian.
If this is right
- The projection allows rotation and antipodal reading of documents due to the globe metaphor.
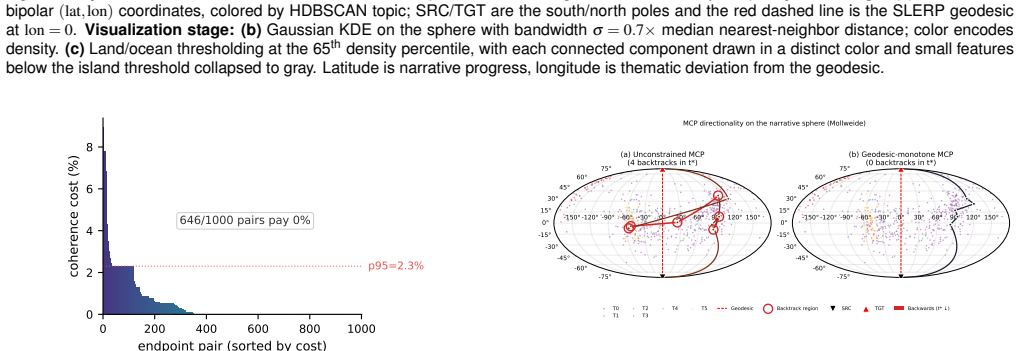
- A narrative trail constrained to remain monotone in geodesic progress supplies a readable storyline.
- Land features on the globe are recovered from document density via kernel density estimation and labeled by theme.
- The method was shown to trace a storyline across the 540-article Cuban protests corpus from Obama's 2016 visit to 2021 international aid.
Where Pith is reading between the lines
- The same anchoring approach could be tested on other corpora such as scientific papers to surface research timelines.
- Interactive tools built around the globe could let multiple users select different endpoint pairs to compare alternative narratives in the same collection.
- Changes in the underlying embedding model might require checking whether the new geodesic still produces a monotone trail that matches known event order.
Load-bearing premise
The embedding space permits a meaningful great-circle geodesic between the two user-chosen endpoint documents that aligns with narrative progress.
What would settle it
In the Cuban protests corpus, the monotone-constrained narrative trail fails to follow the documented progression from the 2016 visit through to the 2021 aid events without backward jumps or gaps.
Figures
read the original abstract
We introduce Information Terra, a narrative-anchored semantic-first projection that places a document corpus on an Earth-like globe whose poles are two user-chosen endpoint documents and whose prime meridian is the great-circle geodesic between them on the embedding hypersphere -- so latitude encodes narrative progress and longitude thematic deviation. Land features are recovered from document density via kernel density estimation and labeled by theme. A narrative trail built from the underlying narrative coherence graph, and constrained to be monotone in geodesic progress, provides a readable storyline. The projection's axes are semantically grounded in the user's chosen narrative endpoints, and the globe metaphor affords rotation and antipodal reading. We demonstrate the method on a 540-article Cuban Protests corpus, showing a storyline from Obama's 2016 visit to the 2021 International Aid during the protests.
Editorial analysis
A structured set of objections, weighed in public.
Referee Report
Summary. The paper introduces Information Terra, a narrative-anchored projection that embeds a document corpus on an Earth-like globe with user-chosen endpoint documents as poles and the great-circle geodesic on the embedding hypersphere as prime meridian, so that latitude encodes narrative progress and longitude encodes thematic deviation. Land features are derived via kernel density estimation on document density and labeled by theme; a narrative trail is extracted from a coherence graph and constrained to remain monotone along the geodesic. The globe metaphor is claimed to support rotation and antipodal reading. The method is demonstrated qualitatively on a 540-article Cuban Protests corpus, tracing a storyline from Obama's 2016 visit to 2021 international aid.
Significance. If the core geometric assumption holds and can be validated, the approach would supply an interpretable, user-controllable visualization for narrative analysis of document collections that leverages familiar geographic metaphors and semantic grounding in chosen endpoints. The absence of any equations, quantitative metrics, error analysis, or baseline comparisons in the current manuscript, however, leaves the practical utility and novelty unestablished.
major comments (2)
- [Abstract / Demonstration] Abstract and demonstration: the central claim requires that the great-circle geodesic between the two user-chosen endpoints on the embedding hypersphere aligns with narrative progress (latitude), yet no argument, embedding-property analysis, or quantitative check (e.g., Spearman correlation of geodesic position with temporal order or human narrative ratings, independent of the monotone constraint) is supplied; the single qualitative Cuban corpus example therefore cannot confirm the alignment.
- [Method description] Method description: no equations or pseudocode are given for the projection itself, the geodesic computation, the kernel density estimation used for land features, or the precise monotone constraint applied to the narrative coherence graph, rendering the method non-reproducible and preventing assessment of whether the claimed properties follow from the construction.
minor comments (2)
- The construction of the 'narrative coherence graph' (nodes, edges, and coherence metric) is referenced but never defined or sourced to prior work.
- No details are provided on how the globe is rendered, how rotation is implemented in the interface, or how antipodal reading is supported.
Simulated Author's Rebuttal
We thank the referee for the detailed and constructive report. We address each major comment below and will revise the manuscript to incorporate the suggested improvements for rigor and reproducibility.
read point-by-point responses
-
Referee: [Abstract / Demonstration] Abstract and demonstration: the central claim requires that the great-circle geodesic between the two user-chosen endpoints on the embedding hypersphere aligns with narrative progress (latitude), yet no argument, embedding-property analysis, or quantitative check (e.g., Spearman correlation of geodesic position with temporal order or human narrative ratings, independent of the monotone constraint) is supplied; the single qualitative Cuban corpus example therefore cannot confirm the alignment.
Authors: We acknowledge that the manuscript relies on a qualitative demonstration and does not supply an independent quantitative validation of the alignment between geodesic position and narrative progress. The projection is constructed by design with user-selected narrative endpoints as poles, making the geodesic the narrative axis; however, we agree that an explicit argument or metric would strengthen the central claim. In revision we will add a Spearman rank correlation between geodesic latitude and document timestamps within the Cuban protests corpus, together with a short discussion of embedding-space properties that motivate the choice. revision: yes
-
Referee: [Method description] Method description: no equations or pseudocode are given for the projection itself, the geodesic computation, the kernel density estimation used for land features, or the precise monotone constraint applied to the narrative coherence graph, rendering the method non-reproducible and preventing assessment of whether the claimed properties follow from the construction.
Authors: The referee is correct that the absence of formal specifications prevents reproducibility. The original manuscript emphasized the conceptual framework and qualitative results. We will add the mathematical definitions for the hyperspherical projection, great-circle geodesic, kernel density estimation for land features, and the precise monotone constraint on the coherence graph, either in the main text or as an appendix. revision: yes
Circularity Check
No circularity: projection defined constructively by user endpoints and standard operations
full rationale
The method is presented as a user-anchored visualization technique whose axes are set by explicit choices (endpoint documents as poles, geodesic as meridian) and standard operations (hypersphere geometry, KDE, monotone graph constraint). No equations, fitted parameters, or self-citations are shown that reduce any claimed result back to the inputs by construction. The Cuban corpus example is an application of the defined procedure rather than a derivation that loops. The central claim remains a definitional projection method, self-contained against external benchmarks.
Axiom & Free-Parameter Ledger
Reference graph
Works this paper leans on
-
[1]
A. Endert, P. Fiaux, and C. North. Semantic interaction for visual text analytics. InProceedings of the SIGCHI Conference on Human Factors in Computing Systems (CHI ’12), pp. 473–482. ACM, New York, NY , USA, 2012. doi:10.1145/2207676.22077412
-
[2]
N. I. Fisher, T. Lewis, and B. J. J. Embleton.Statistical Analysis of Spherical Data. Cambridge University Press, Cambridge, 1987. doi: 10.1017/CBO97805116230592
-
[3]
F. German, B. Keith, and C. North. Narrative trails: A method for co- herent storyline extraction via maximum capacity path optimization. InProceedings of the Text2Story 2025 Workshop at ECIR 2025, vol. 3964 ofCEUR Workshop Proceedings, pp. 15–27. CEUR-WS.org, Lucca, Italy, 2025. doi:10.48550/arXiv.2503.156812
-
[4]
S. Havre, B. Hetzler, and L. Nowell. ThemeRiver: Visualizing theme changes over time. InProceedings of the IEEE Symposium on Infor- mation Visualization (InfoVis 2000), pp. 115–123. IEEE Computer So- ciety, Los Alamitos, CA, USA, 2000. doi:10.1109/INFVIS.2000.885098 2
-
[5]
S. Havre, E. Hetzler, P. Whitney, and L. Nowell. ThemeRiver: Visual- izing thematic changes in large document collections.IEEE Transac- tions on Visualization and Computer Graphics, 8(1):9–20, 2002. doi: 10.1109/2945.9818482
-
[6]
M. S. Hossain, J. Gresock, Y . Edmonds, R. Helm, M. Potts, and N. Ra- makrishnan. Connecting the dots between PubMed abstracts.PLoS ONE, 7(1):e29509, 2012. doi:10.1371/journal.pone.00295092
-
[7]
S. Kaski, T. Honkela, K. Lagus, and T. Kohonen. WEBSOM – self- organizing maps of document collections.Neurocomputing, 21(1– 3):101–117, 1998. doi:10.1016/S0925-2312(98)00039-32
-
[8]
B. F. Keith Norambuena. Interactive narrative analytics: Bridging computational narrative extraction and human sensemaking.IEEE Ac- cess, 14:2268–2284, 2026. doi:10.1109/ACCESS.2025.36503522
-
[9]
B. F. Keith-Norambuena, F. German, E. Krokos, S. Joseph, and C. North. Semantic interaction for narrative map sensemaking: An insight-based evaluation. InProceedings of the Text2Story 2026 Workshop at ECIR 2026, vol. 4202 ofCEUR Workshop Proceedings. CEUR-WS.org, Delft, The Netherlands, 2026. doi:10.48550/arXiv.2603. 296511, 2, 4
-
[10]
B. F. Keith Norambuena and T. Mitra. Narrative Maps: An algorithmic approach to represent and extract information narratives.Proceedings of the ACM on Human-Computer Interaction, 4(CSCW3):Article 228,
-
[11]
doi:10.1145/34329272, 4
-
[12]
B. F. Keith Norambuena, T. Mitra, and C. North. Design guidelines for narrative maps in sensemaking tasks.Information Visualization, 21(3):220–245, 2022. doi:10.1177/147387162210795932
-
[13]
B. F. Keith Norambuena, T. Mitra, and C. North. Mixed multi-model semantic interaction for graph-based narrative visualizations. InPro- ceedings of the 28th International Conference on Intelligent User In- terfaces, IUI ’23, p. 866–888. Association for Computing Machinery, New York, NY , USA, 2023. doi:10.1145/3581641.35840764
-
[14]
B. F. Keith Norambuena, T. Mitra, and C. North. A survey on event-based news narrative extraction.ACM Computing Surveys, 55(14s):Article 300, 2023. doi:10.1145/35847411, 2, 4
-
[15]
B. F. Keith-Norambuena, C. I. Rojas-C ´ordova, C. J. Meneses-Villegas, E. J. Lam-Esquenazi, A. M. Flores-Bustos, I. A. Molina-Villablanca, and J. E. Leyton-Vallejos. Agenda-based narrative extraction: Steer- ing pathfinding algorithms with large language models. InProceed- ings of the Text2Story 2026 Workshop at ECIR 2026, vol. 4202 of CEUR Workshop Proce...
-
[16]
S. Liu, Y . Wu, E. Wei, M. Liu, and Y . Liu. StoryFlow: Tracking the evolution of stories.IEEE Transactions on Visualization and Com- puter Graphics, 19(12):2436–2445, 2013. doi:10.1109/TVCG.2013.196 2
-
[17]
K. V . Mardia and P. E. Jupp.Directional Statistics. Wiley Series in Probability and Statistics. John Wiley & Sons, 1999. doi:10.1002/ 97804703169792
1999
-
[18]
L. McInnes, J. Healy, and S. Astels. hdbscan: Hierarchical density based clustering.Journal of Open Source Software, 2(11):205, 2017. doi:10.21105/joss.002054
-
[19]
UMAP: Uniform Manifold Approximation and Projection for Dimension Reduction
L. McInnes, J. Healy, and J. Melville. UMAP: Uniform manifold approximation and projection for dimension reduction.arXiv preprint arXiv:1802.03426, 2018. doi:10.48550/arXiv.1802.034262
work page internal anchor Pith review Pith/arXiv arXiv doi:10.48550/arxiv.1802.034262 2018
-
[20]
N. E. Miller, P. C. Wong, M. Brewster, and H. Foote. TOPIC IS- LANDS – a wavelet-based text visualization system. InProceedings of the Conference on Visualization ’98 (VIS ’98), pp. 189–196. IEEE Computer Society Press, Los Alamitos, CA, USA, 1998. doi:10.1109/ VISUAL.1998.7453022
-
[21]
New embedding models and API updates, 2024
OpenAI. New embedding models and API updates, 2024. text-embedding-3-small(1536-D) model announcement. 4
2024
-
[22]
D. Shahaf and C. Guestrin. Connecting the dots between news articles. InProceedings of the 16th ACM SIGKDD International Conference on Knowledge Discovery and Data Mining (KDD ’10), pp. 623–632. ACM, New York, NY , USA, 2010. doi:10.1145/1835804.18358842
-
[23]
D. Shahaf, C. Guestrin, and E. Horvitz. Metro maps of science. In Proceedings of the 18th ACM SIGKDD International Conference on Knowledge Discovery and Data Mining (KDD ’12), pp. 1122–1130. ACM, New York, NY , USA, 2012. doi:10.1145/2339530.23397062, 4
-
[24]
K. Shoemake. Animating rotation with quaternion curves. InPro- ceedings of the 12th Annual Conference on Computer Graphics and Interactive Techniques (SIGGRAPH ’85), pp. 245–254. ACM, New York, NY , USA, 1985. doi:10.1145/325334.3252422
-
[25]
K. A. A. Syed, M. Kr ¨oll, V . Sabol, A. Scharl, S. Gindl, M. Granitzer, and A. Weichselbraun. Dynamic topography information landscapes – an incremental approach to visual knowledge discovery. InData Warehousing and Knowledge Discovery (DaWaK 2012), vol. 7448 of Lecture Notes in Computer Science, pp. 352–363. Springer, Berlin, Heidelberg, 2012. doi:10.10...
-
[26]
J. A. Wise, J. J. Thomas, K. Pennock, D. Lantrip, M. Pottier, A. Schur, and V . Crow. Visualizing the non-visual: Spatial analysis and inter- action with information from text documents. InProceedings of the IEEE Symposium on Information Visualization (InfoVis ’95), pp. 51–
-
[27]
doi: 10.1109/INFVIS.1995.5286862
IEEE Computer Society Press, Los Alamitos, CA, USA, 1995. doi: 10.1109/INFVIS.1995.5286862
discussion (0)
Sign in with ORCID, Apple, or X to comment. Anyone can read and Pith papers without signing in.