Decoding the Early-Time Light Curves of Type Ia Supernovae. I. A Hierarchical Bayesian Framework for Demographic Inference
Pith reviewed 2026-07-02 17:56 UTC · model grok-4.3
The pith
A hierarchical Bayesian framework that fits power-law models simultaneously to many Type Ia supernova light curves reduces bias in the inferred population parameters for rise time, scatter, and correlations.
A machine-rendered reading of the paper's core claim, the machinery that carries it, and where it could break.
Core claim
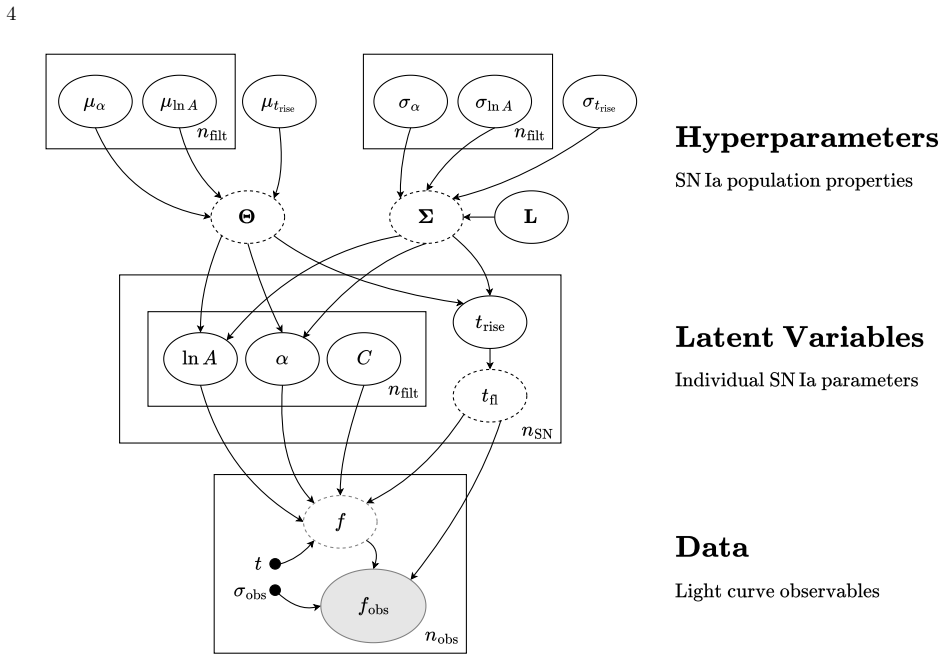
The hierarchical Bayesian model with a multivariate Gaussian population prior on the power-law rise parameters (rise time, rise index, and amplitude) yields substantially less biased estimates of the population-level mean, scatter, and correlations than the standard two-step procedure of individual fits followed by aggregation. The population prior suppresses volume-projection bias from asymmetric likelihoods and down-weights sparse or noisy measurements without explicit cuts. When the power-law model is applied to light curves with more realistic morphologies, the recovered population scatter remains reliable despite mild underestimation of rise times due to model misspecification. Supernov
What carries the argument
The hierarchical Bayesian model with a multivariate Gaussian population prior on the power-law parameters of rise time, rise index, and amplitude.
If this is right
- Population parameters of SN Ia early light curves can be constrained from heterogeneous datasets without introducing selection biases from quality cuts.
- Individual supernova light-curve fits can be improved by using the population distribution as a prior that regularizes nuisance parameters.
- Events with early-time flux excesses can be identified as statistical outliers in the rise-parameter space.
- The method maintains reliable recovery of population scatter even when the power-law model is misspecified relative to actual light-curve shapes.
Where Pith is reading between the lines
- If applied to real observational data, the framework could quantify whether the distribution of rise indices deviates from Gaussianity.
- The outlier identification might correlate with other supernova properties to distinguish progenitor systems.
- Extending the model to include additional parameters or different functional forms could test the robustness of the demographic inferences.
- Using the population prior on real survey data might allow inclusion of more supernovae in cosmological analyses by reducing the impact of sparse sampling.
Load-bearing premise
The distribution of power-law rise parameters across the supernova population is well described by a multivariate Gaussian, and the power-law model itself is adequate for recovering demographic properties despite some mismatch with realistic light-curve shapes.
What would settle it
Apply both the hierarchical method and the classic two-step method to the same set of simulated light curves drawn from a known population distribution; if the hierarchical method recovers the input mean, scatter, and correlation values with significantly smaller error, that supports the claim of bias reduction.
Figures
read the original abstract
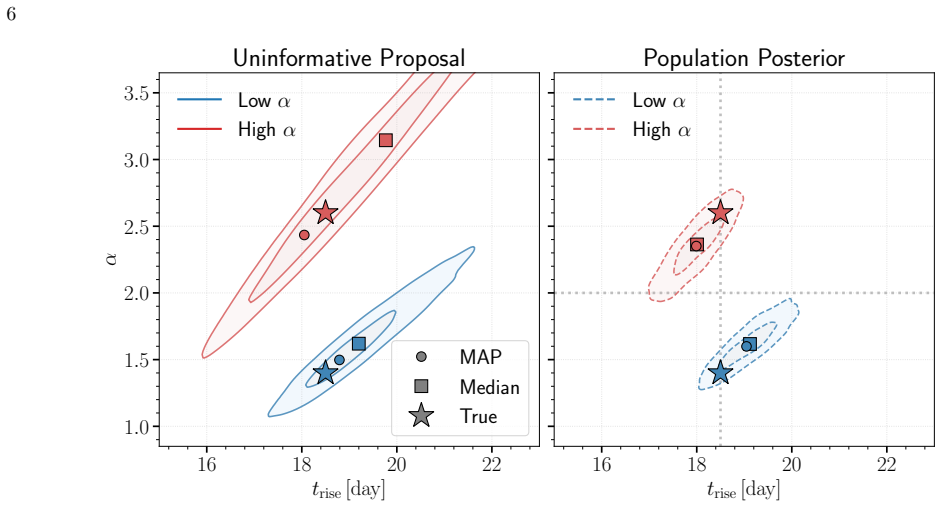
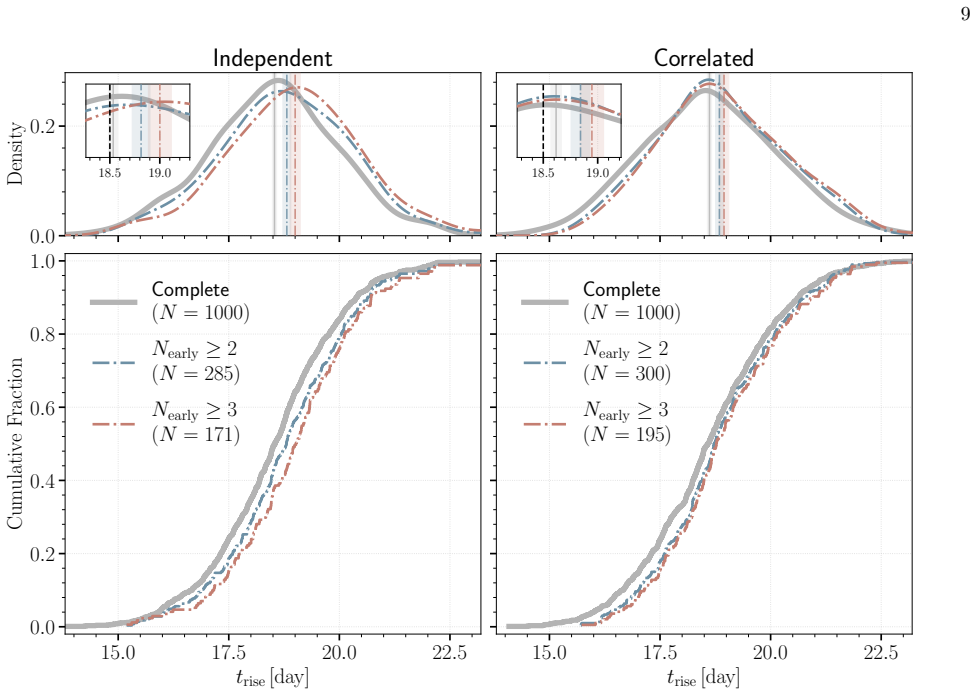
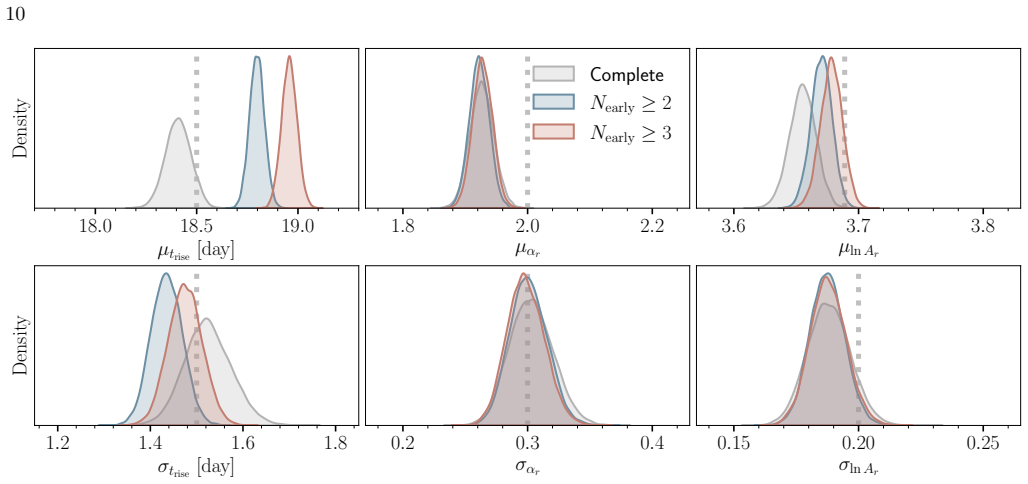
Light curves of Type Ia Supernovae (SNe Ia) in the days following explosion encode the diversity of progenitor systems and explosion physics. We present a hierarchical Bayesian framework to robustly constrain the population-level light-curve morphology of SNe Ia by fitting a large light-curve dataset simultaneously to power-law rises. Using a multivariate Gaussian population prior, this framework automatically down-weights sparsely sampled SNe and noisy measurements in the inference, obviating the need for restrictive quality cuts that introduce selection biases. Validation on simulated power-law light curves demonstrates that the population prior effectively suppresses the volume-projection bias from the asymmetric likelihood: compared to the classic two-step approach of fitting individual SNe and then aggregating the results, the hierarchical approach dramatically reduces the bias on the population-level parameters (mean, scatter, and correlation). When fitting the power-law model to light curves with more realistic morphologies, while the rise time can be mildly underestimated due to model misspecification, the recovered population scatter remains reliable. Furthermore, SNe with early flux excesses can emerge as outliers in the inferred parameter space, offering a potential diagnostic for identifying such events. Finally, we show that the inferred population distribution can also improve individual-event inference. Restricting the population prior to nuisance amplitudes, while preserving the complete correlation structure, regularizes fits to individual SNe without shrinking the physically meaningful rise time and rise index toward their population means.
Editorial analysis
A structured set of objections, weighed in public.
Referee Report
Summary. The paper presents a hierarchical Bayesian framework for inferring the demographic distribution of Type Ia supernova early light-curve parameters (rise time, rise index, amplitude) modeled as power laws. A multivariate Gaussian population prior is used to fit the full dataset simultaneously, automatically down-weighting sparse or noisy events and avoiding selection biases from quality cuts. Validation on simulated power-law data shows the hierarchical method reduces bias on population mean, scatter, and correlations relative to the two-step approach of individual fits followed by aggregation. The framework also identifies outliers (e.g., early flux excesses) and can regularize individual fits by restricting the prior to nuisance parameters while preserving correlations.
Significance. If the central bias-reduction result generalizes beyond the tested conditions, the framework offers a principled way to extract population-level constraints on SN Ia progenitor diversity without introducing selection effects. The reported reliability of recovered scatter under realistic morphology misspecification is a useful practical feature. The approach builds on standard hierarchical modeling techniques but applies them specifically to early-time SN Ia demographics, with potential to improve both population and individual-event inferences.
major comments (1)
- [Abstract/validation description] Abstract (validation paragraph): The claim that the hierarchical approach 'dramatically reduces the bias' on population parameters is demonstrated exclusively on simulations drawn from the same multivariate Gaussian population model used for inference. This leaves untested the performance when the true demographic distribution deviates from multivariate Gaussian (e.g., heavy tails, skewness, or multimodality in rise time/index/amplitude), which is load-bearing for the comparison to the two-step method on real data.
minor comments (2)
- [Abstract] Abstract: The statement that 'the recovered population scatter remains reliable' under realistic morphologies should be supported by a quantitative metric (e.g., fractional bias or coverage) rather than a qualitative description.
- [Abstract] Abstract: Clarify the precise mechanism by which 'restricting the population prior to nuisance amplitudes, while preserving the complete correlation structure' avoids shrinking the physically meaningful rise time and index parameters.
Simulated Author's Rebuttal
We thank the referee for their constructive review. We address the major comment below and will revise the manuscript accordingly to strengthen the validation.
read point-by-point responses
-
Referee: Abstract (validation paragraph): The claim that the hierarchical approach 'dramatically reduces the bias' on population parameters is demonstrated exclusively on simulations drawn from the same multivariate Gaussian population model used for inference. This leaves untested the performance when the true demographic distribution deviates from multivariate Gaussian (e.g., heavy tails, skewness, or multimodality in rise time/index/amplitude), which is load-bearing for the comparison to the two-step method on real data.
Authors: We agree that the primary validation in the abstract and main text demonstrates recovery when data are drawn from the assumed multivariate Gaussian population model. This is the standard first step to isolate the effect of the hierarchical prior in suppressing the volume-projection bias from the asymmetric likelihood, independent of population shape. We also already test under light-curve morphology misspecification (realistic shapes rather than pure power laws), where population scatter remains reliable. However, the referee correctly identifies that robustness to non-Gaussian demographic distributions is not yet shown. In revision we will add simulations drawn from heavy-tailed, skewed, and multimodal population distributions to directly compare bias reduction between the hierarchical and two-step approaches under these conditions. revision: yes
Circularity Check
No significant circularity in the derivation chain
full rationale
The paper presents a hierarchical Bayesian model with a multivariate Gaussian population prior on power-law rise parameters and validates bias reduction via simulations drawn from that same model. This is standard forward-model validation under stated assumptions rather than a derivation that reduces claimed results to inputs by construction. No self-definitional equations, fitted inputs relabeled as predictions, load-bearing self-citations, or ansatz smuggling appear in the abstract or described framework; the central comparison to the two-step method rests on explicit simulation tests that remain falsifiable outside the fitted values.
Axiom & Free-Parameter Ledger
free parameters (2)
- population mean vector
- population covariance matrix
axioms (1)
- domain assumption The population distribution of light-curve parameters is multivariate Gaussian.
Reference graph
Works this paper leans on
-
[1]
2000, AJ, 119, 2110, doi: 10.1086/301344
Aldering, G., Knop, R., & Nugent, P. 2000, AJ, 119, 2110, doi: 10.1086/301344
-
[2]
Ashall, C., Lu, J., Shappee, B. J., et al. 2022, ApJ, 932, L2, doi: 10.3847/2041-8213/ac7235
-
[3]
Bellm, E. C., Kulkarni, S. R., Graham, M. J., et al. 2018, PASP, 131, 018002, doi: 10.1088/1538-3873/aaecbe
-
[4]
P., Jankowiak, M., et al
Bingham, E., Chen, J. P., Jankowiak, M., et al. 2019, JMLR, 20, 1
2019
-
[5]
2018, JAX: Composable Transformations of Python+NumPy
Bradbury, J., Frostig, R., Hawkins, P., et al. 2018, JAX: Composable Transformations of Python+NumPy
2018
-
[6]
Bulla, M., Miller, A. A., Yao, Y., et al. 2020, ApJ, 902, 48, doi: 10.3847/1538-4357/abb13c
-
[7]
Burke, J., Howell, D. A., Sarbadhicary, S. K., et al. 2021, ApJ, 919, 142, doi: 10.3847/1538-4357/ac126b
-
[8]
Cao, Y., Kulkarni, S. R., Howell, D. A., et al. 2015, Nature, 521, 328, doi: 10.1038/nature14440
-
[9]
Conley, A., Howell, D. A., Howes, A., et al. 2006, AJ, 132, 1707, doi: 10.1086/507788
-
[10]
Deckers, M., Maguire, K., Magee, M. R., et al. 2022, MNRAS, 512, 1317, doi: 10.1093/mnras/stac558 DES Collaboration, Abbott, T. M. C., Acevedo, M., et al. 2024, ApJ, 973, L14, doi: 10.3847/2041-8213/ad6f9f
-
[11]
Dimitriadis, G., Foley, R. J., Rest, A., et al. 2018, ApJ, 870, L1, doi: 10.3847/2041-8213/aaedb0
-
[12]
Dimitriadis, G., Maguire, K., Karambelkar, V. R., et al. 2023, MNRAS, 521, 1162, doi: 10.1093/mnras/stad536
-
[13]
Fausnaugh, M. M., Vallely, P. J., Tucker, M. A., et al. 2023, ApJ, 956, 108, doi: 10.3847/1538-4357/aceaef
-
[14]
E., Sullivan, M., Gal-Yam, A., et al
Firth, R. E., Sullivan, M., Gal-Yam, A., et al. 2015, MNRAS, 446, 3895, doi: 10.1093/mnras/stu2314
-
[15]
Foreman-Mackey, D., Hogg, D. W., & Morton, T. D. 2014, ApJ, 795, 64, doi: 10.1088/0004-637X/795/1/64
-
[16]
Ganeshalingam, M., Li, W., & Filippenko, A. V. 2011, MNRAS, 416, 2607, doi: 10.1111/j.1365-2966.2011.19213.x
-
[17]
Goldhaber, G., Groom, D. E., Kim, A., et al. 2001, ApJ, 558, 359, doi: 10.1086/322460 Gonz´ alez-Gait´ an, S., Conley, A., Bianco, F. B., et al. 2011, ApJ, 745, 44, doi: 10.1088/0004-637X/745/1/44
-
[18]
2007, A&A, 466, 11, doi: 10.1051/0004-6361:20066930
Guy, J., Astier, P., Baumont, S., et al. 2007, A&A, 466, 11, doi: 10.1051/0004-6361:20066930
-
[19]
Hayden, B. T., Garnavich, P. M., Kessler, R., et al. 2010, ApJ, 712, 350, doi: 10.1088/0004-637X/712/1/350
-
[20]
Hinton, S. R., Davis, T. M., Kim, A. G., et al. 2019, ApJ, 876, 15, doi: 10.3847/1538-4357/ab13a3
-
[21]
Hoffman, M. D., & Gelman, A. 2014, doi: 10.5555/2627435.2638586
-
[22]
Hogg, D. W., Myers, A. D., & Bovy, J. 2010, ApJ, 725, 2166, doi: 10.1088/0004-637X/725/2/2166
-
[23]
Hosseinzadeh, G., Sand, D. J., Valenti, S., et al. 2017, ApJ, 845, L11, doi: 10.3847/2041-8213/aa8402
-
[24]
2025, ApJ, 984, 160, doi: 10.3847/1538-4357/adb3a4
Iskandar, A., Wang, X., Esamdin, A., et al. 2025, ApJ, 984, 160, doi: 10.3847/1538-4357/adb3a4
-
[25]
2018, ApJ, 865, 149, doi: 10.3847/1538-4357/aadb9a
Jiang, J.-a., Doi, M., Maeda, K., & Shigeyama, T. 2018, ApJ, 865, 149, doi: 10.3847/1538-4357/aadb9a
-
[26]
2021, ApJ, 923, L8, doi: 10.3847/2041-8213/ac375f
Jiang, J.-a., Maeda, K., Kawabata, M., et al. 2021, ApJ, 923, L8, doi: 10.3847/2041-8213/ac375f
-
[27]
2010, ApJ, 708, 1025, doi: 10.1088/0004-637X/708/2/1025
Kasen, D. 2010, ApJ, 708, 1025, doi: 10.1088/0004-637X/708/2/1025
-
[28]
2016, MNRAS, 459, 4428, doi: 10.1093/mnras/stw962
Kromer, M., Fremling, C., Pakmor, R., et al. 2016, MNRAS, 459, 4428, doi: 10.1093/mnras/stw962
-
[29]
Kumar, G., Prust, L. J., & Bildsten, L. 2025, ApJ, 992, 2, doi: 10.3847/1538-4357/adfdd7
-
[30]
2009, Journal of Multivariate Analysis, 100, 1989, doi: 10.1016/j.jmva.2009.04.008
Lewandowski, D., Kurowicka, D., & Joe, H. 2009, Journal of Multivariate Analysis, 100, 1989, doi: 10.1016/j.jmva.2009.04.008
-
[31]
2018, ApJ, 870, 12, doi: 10.3847/1538-4357/aaec74
Li, W., Wang, X., Vink´ o, J., et al. 2018, ApJ, 870, 12, doi: 10.3847/1538-4357/aaec74
-
[32]
A., Sarin, N., et al
Liu, C., Miller, A. A., Sarin, N., et al. 2026, Submitted to ApJ
2026
-
[33]
R., Maguire, K., Kotak, R., et al
Magee, M. R., Maguire, K., Kotak, R., et al. 2020, A&A, 634, A37, doi: 10.1051/0004-6361/201936684
-
[34]
R., Cuddy, C., Maguire, K., et al
Magee, M. R., Cuddy, C., Maguire, K., et al. 2022, MNRAS, 513, 3035, doi: 10.1093/mnras/stac1045
-
[35]
2014, MNRAS, 444, 3258, doi: 10.1093/mnras/stu1607
Maguire, K., Sullivan, M., Pan, Y.-C., et al. 2014, MNRAS, 444, 3258, doi: 10.1093/mnras/stu1607
-
[36]
Mandel, I., Farr, W. M., & Gair, J. R. 2019, MNRAS, 486, 1086, doi: 10.1093/mnras/stz896
-
[37]
S., Narayan, G., & Kirshner, R
Mandel, K. S., Narayan, G., & Kirshner, R. P. 2011, ApJ, 731, 120, doi: 10.1088/0004-637X/731/2/120
-
[38]
Marion, G. H., Brown, P. J., Vink´ o, J., et al. 2016, ApJ, 820, 92, doi: 10.3847/0004-637X/820/2/92
-
[39]
A., Abril-Pla, O., Deklerk, J., et al
Martin, O. A., Abril-Pla, O., Deklerk, J., et al. 2026, J. Open Source Softw., 11, 9889, doi: 10.21105/joss.09889
-
[40]
Miller, A. A., Cao, Y., Piro, A. L., et al. 2018, ApJ, 852, 100, doi: 10.3847/1538-4357/aaa01f 19
-
[41]
Miller, A. A., Yao, Y., Bulla, M., et al. 2020a, ApJ, 902, 47, doi: 10.3847/1538-4357/abb13b
-
[42]
Miller, A. A., Magee, M. R., Polin, A., et al. 2020b, ApJ, 898, 56, doi: 10.3847/1538-4357/ab9e05
-
[43]
Ni, Y. Q., Moon, D.-S., Drout, M. R., et al. 2025, ApJ, 983, 3, doi: 10.3847/1538-4357/adbbb7
-
[44]
M., Kromer, M., Taubenberger, S., et al
Noebauer, U. M., Kromer, M., Taubenberger, S., et al. 2017, MNRAS, 472, 2787, doi: 10.1093/mnras/stx2093
-
[45]
M., Taubenberger, S., Blinnikov, S., Sorokina, E., & Hillebrandt, W
Noebauer, U. M., Taubenberger, S., Blinnikov, S., Sorokina, E., & Hillebrandt, W. 2016, MNRAS, 463, 2972, doi: 10.1093/mnras/stw2197
-
[46]
2019, MNRAS, 483, 5045, doi: 10.1093/mnras/sty3301
Papadogiannakis, S., Goobar, A., Amanullah, R., et al. 2019, MNRAS, 483, 5045, doi: 10.1093/mnras/sty3301
-
[47]
Measurements of Omega and Lambda from 42 High-Redshift Supernovae
Perlmutter, S., Aldering, G., Goldhaber, G., et al. 1999, ApJ, 517, 565, doi: 10.1086/307221
work page internal anchor Pith review doi:10.1086/307221 1999
-
[48]
Composable Effects for Flexible and Accelerated Probabilistic Programming in NumPyro
Phan, D., Pradhan, N., & Jankowiak, M. 2019, Composable Effects for Flexible and Accelerated Probabilistic Programming in NumPyro, arXiv, doi: 10.48550/arXiv.1912.11554
work page internal anchor Pith review Pith/arXiv arXiv doi:10.48550/arxiv.1912.11554 2019
-
[49]
Piro, A. L. 2015, ApJ, 808, L51, doi: 10.1088/2041-8205/808/2/L51
-
[50]
Piro, A. L., & Morozova, V. S. 2016, ApJ, 826, 96, doi: 10.3847/0004-637X/826/1/96
-
[51]
Piro, A. L., & Nakar, E. 2013, ApJ, 769, 67, doi: 10.1088/0004-637X/769/1/67
-
[52]
Piro, A. L., & Nakar, E. 2014, ApJ, 784, 85, doi: 10.1088/0004-637X/784/1/85
-
[53]
Observational Evidence from Supernovae for an Accelerating Universe and a Cosmological Constant
Riess, A. G., Filippenko, A. V., Challis, P., et al. 1998, AJ, 116, 1009, doi: 10.1086/300499
work page internal anchor Pith review doi:10.1086/300499 1998
-
[54]
Riess, A. G., Filippenko, A. V., Li, W., et al. 1999, AJ, 118, 2675, doi: 10.1086/301143
-
[55]
2025, A&A, 694, A1, doi: 10.1051/0004-6361/202450388
Rigault, M., Smith, M., Goobar, A., et al. 2025, A&A, 694, A1, doi: 10.1051/0004-6361/202450388
-
[56]
2022, MNRAS, 514, 3541, doi: 10.1093/mnras/stac1525
Sai, H., Wang, X., Elias-Rosa, N., et al. 2022, MNRAS, 514, 3541, doi: 10.1093/mnras/stac1525
-
[57]
Sarin, N., H¨ ubner, M., Omand, C. M. B., et al. 2024, MNRAS, 531, 1203, doi: 10.1093/mnras/stae1238
-
[58]
Shappee, B. J., Prieto, J. L., Grupe, D., et al. 2014, ApJ, 788, 48, doi: 10.1088/0004-637X/788/1/48
work page internal anchor Pith review doi:10.1088/0004-637x/788/1/48 2014
-
[59]
Siebert, M. R., Kwok, L. A., Johansson, J., et al. 2023, ApJ, 960, 88, doi: 10.3847/1538-4357/ad0975
-
[60]
Srivastav, S., Smartt, S. J., Huber, M. E., et al. 2023a, ApJ, 943, L20, doi: 10.3847/2041-8213/acb2ce
-
[61]
2023b, ApJ, 956, L34, doi: 10.3847/2041-8213/acffaf
Srivastav, S., Moore, T., Nicholl, M., et al. 2023b, ApJ, 956, L34, doi: 10.3847/2041-8213/acffaf
-
[62]
Stritzinger, M. D., Shappee, B. J., Piro, A. L., et al. 2018, ApJ, 864, L35, doi: 10.3847/2041-8213/aadd46 The Astropy Collaboration, Robitaille, T. P., Tollerud, E. J., et al. 2013, Astron. Astrophys., 558, A33, doi: 10.1051/0004-6361/201322068 The Astropy Collaboration, Price-Whelan, A. M., Sip˝ ocz, B. M., et al. 2018, AJ, 156, 123, doi: 10.3847/1538-3...
-
[63]
Thrane, E., & Talbot, C. 2019, Publ. Astron. Soc. Aust., 36, e010, doi: 10.1017/pasa.2019.2
-
[64]
Tonry, J. L., Denneau, L., Heinze, A. N., et al. 2018, PASP, 130, 064505, doi: 10.1088/1538-3873/aabadf
work page internal anchor Pith review doi:10.1088/1538-3873/aabadf 2018
-
[65]
Vallely, P. J., Kochanek, C. S., Stanek, K. Z., Fausnaugh, M., & Shappee, B. J. 2021, MNRAS, 500, 5639, doi: 10.1093/mnras/staa3675
-
[66]
2024, ApJ, 962, 17, doi: 10.3847/1538-4357/ad0edb
Wang, Q., Rest, A., Dimitriadis, G., et al. 2024, ApJ, 962, 17, doi: 10.3847/1538-4357/ad0edb
-
[67]
2025, ApJ, 991, 148, doi: 10.3847/1538-4357/adf05a
Wu, W., Jiang, J.-a., Meng, D., et al. 2025, ApJ, 991, 148, doi: 10.3847/1538-4357/adf05a
-
[68]
2024, MNRAS, 527, 9957, doi: 10.1093/mnras/stad3691
Xi, G., Wang, X., Li, G., et al. 2024, MNRAS, 527, 9957, doi: 10.1093/mnras/stad3691
-
[69]
Zheng, W., & Filippenko, A. V. 2017, ApJ, 838, L4, doi: 10.3847/2041-8213/aa6442
-
[70]
Zheng, W., Kelly, P. L., & Filippenko, A. V. 2017, ApJ, 848, 66, doi: 10.3847/1538-4357/aa8b19
-
[71]
Zheng, W., Kelly, P. L., & Filippenko, A. V. 2018, ApJ, 858, 104, doi: 10.3847/1538-4357/aabaeb
-
[72]
Zheng, W., Silverman, J. M., Filippenko, A. V., et al. 2013, ApJ, 778, L15, doi: 10.1088/2041-8205/778/1/L15
discussion (0)
Sign in with ORCID, Apple, or X to comment. Anyone can read and Pith papers without signing in.