Made to Feel: How Designers Bring Emotions into Affective Visualization
Pith reviewed 2026-07-03 07:14 UTC · model grok-4.3
The pith
Visualization designers let affective intent emerge during the process and build emotional impact through accumulated choices across data, design, and audience facets rather than planning it upfront or isolating single elements.
A machine-rendered reading of the paper's core claim, the machinery that carries it, and where it could break.
Core claim
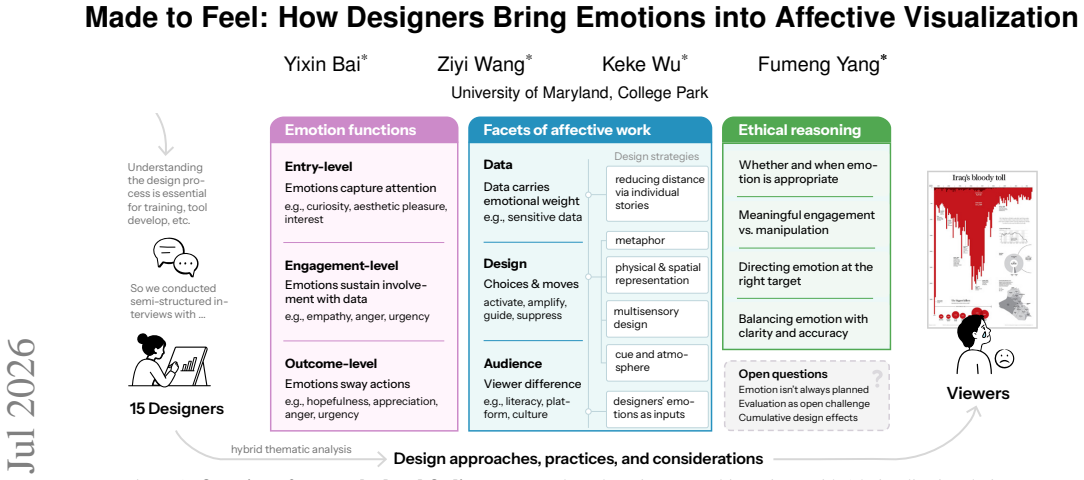
Through interviews with 15 visualization practitioners and hybrid thematic analysis, the authors identify three functions that emotions serve for viewers (entry, engagement, outcome), three facets through which designers engage with emotion (data, design, audience) together with concrete design strategies, and ethical considerations that arise in the process. They observe that affective intent often emerges during the design process rather than being planned from the outset, and that emotional impact arises from accumulated design choices rather than isolated visual elements. Evaluation is highlighted as a persistent practical challenge.
What carries the argument
Three viewer functions (entry, engagement, outcome) and three design facets (data, design, audience) that organize how practitioners introduce and manage emotion in visualizations.
If this is right
- Designers can deliberately support the three functions to shape viewer responses at different stages.
- Emotional outcomes depend on choices made across the data, design, and audience facets rather than any one element.
- Ethical review should occur throughout the iterative design process rather than only at the end.
- Evaluation methods for affective visualizations require new approaches beyond current practices.
- Affective intent can be treated as an emergent property that designers refine over time.
Where Pith is reading between the lines
- Visualization authoring tools could add features that help designers explore and track emerging emotional goals iteratively.
- The three-function, three-facet structure might transfer to other emotion-sensitive design fields such as interface or narrative design.
- Controlled experiments could test whether deliberately varying choices within the facets produces measurable differences in viewer emotion.
- Wider use of these patterns could shift visualization practice toward more intentional yet flexible emotional layering.
Load-bearing premise
The sample of 15 visualization practitioners and the hybrid thematic analysis produce findings that generalize beyond the interviewed individuals to broader design practices in affective visualization.
What would settle it
A larger study or direct observation of design sessions showing that affective intent is typically fixed at project start or that single visual elements reliably drive emotional responses would contradict the emergence and accumulation claims.
Figures
read the original abstract
Affective visualization is increasingly studied in visualization research, yet how designers bring emotions into their visualization work remains unexplored. This paper addresses this gap through semi-structured interviews with 15 visualization practitioners. Using hybrid thematic analysis, we identify: (1) three functions that emotions can serve for viewers (entry, engagement, outcome); (2) three facets of how designers work with emotion (data, design, audience), along with design strategies; and (3) ethical considerations in the design process. We also observe that affective intent often emerges during the design process rather than being planned from the outset, and that emotional impact arises from accumulated design choices rather than isolated visual elements. Finally, we highlight evaluation as a key challenge identified by our participants.
Editorial analysis
A structured set of objections, weighed in public.
Referee Report
Summary. The paper reports results from semi-structured interviews with 15 visualization practitioners analyzed with hybrid thematic analysis. It identifies three functions emotions can serve for viewers (entry, engagement, outcome), three facets of designers' work with emotion (data, design, audience) together with associated strategies, ethical considerations in the process, and two process observations: affective intent typically emerges during design rather than being planned at the outset, and emotional impact arises from accumulated design choices rather than isolated elements. Evaluation is noted as an open challenge.
Significance. If the thematic patterns are robustly grounded, the work supplies a structured vocabulary and process account that directly addresses an acknowledged gap in affective visualization research. The functions/facets framework and the emphasis on emergent rather than a-priori intent could usefully inform both future empirical studies and practical design guidelines.
major comments (2)
- [Methods] Methods section: the abstract and available description supply no information on interview protocol, participant recruitment or selection criteria, the concrete steps of the hybrid thematic analysis, or any reliability checks such as inter-coder agreement or saturation assessment. These omissions make it impossible to evaluate the evidential basis for the three functions and three facets that constitute the central claims.
- [Results/Discussion] Results/Discussion: the claim that the identified functions and facets structure how designers work with emotion in general rests on a sample of 15 practitioners, yet no details on sample diversity, theoretical saturation, member checking, or triangulation with design artifacts or prior literature are supplied. This leaves the transferability of the framework unsecured.
minor comments (1)
- [Abstract] Abstract: the sentence describing the analysis method could be expanded by one clause to name the participant count and the hybrid thematic approach for immediate clarity.
Simulated Author's Rebuttal
We thank the referee for the constructive feedback, which highlights important areas for improving methodological transparency and clarifying the scope of our claims. We address each major comment below, indicating revisions where appropriate.
read point-by-point responses
-
Referee: [Methods] Methods section: the abstract and available description supply no information on interview protocol, participant recruitment or selection criteria, the concrete steps of the hybrid thematic analysis, or any reliability checks such as inter-coder agreement or saturation assessment. These omissions make it impossible to evaluate the evidential basis for the three functions and three facets that constitute the central claims.
Authors: We agree that the Methods section requires substantially more detail to support evaluation of the findings. In the revised manuscript we will expand this section to describe the interview protocol (including sample questions), recruitment channels and selection criteria, the specific procedures followed in the hybrid thematic analysis (including codebook development and iteration), and any steps taken toward reliability such as inter-coder discussion or saturation assessment. revision: yes
-
Referee: [Results/Discussion] Results/Discussion: the claim that the identified functions and facets structure how designers work with emotion in general rests on a sample of 15 practitioners, yet no details on sample diversity, theoretical saturation, member checking, or triangulation with design artifacts or prior literature are supplied. This leaves the transferability of the framework unsecured.
Authors: We will add a dedicated subsection on participants that reports demographic and professional diversity. We will also document how theoretical saturation was assessed during analysis and whether member checking occurred. Triangulation with design artifacts was not part of the study protocol; we will explicitly note this as a limitation and qualify the framework as exploratory and grounded in the interviewed sample rather than claiming general applicability. Language throughout the Results and Discussion will be adjusted to emphasize transferability considerations. revision: partial
Circularity Check
No circularity: qualitative thematic analysis contains no derivations or self-referential reductions
full rationale
The paper reports results from semi-structured interviews with 15 practitioners followed by hybrid thematic analysis. No equations, parameters, predictions, or derivations appear anywhere in the manuscript. The three functions (entry, engagement, outcome), three facets (data, design, audience), and observations about emergent affective intent are presented as direct outputs of the coding process applied to participant responses. None of the seven enumerated circularity patterns apply: there is no self-definition of variables, no fitted input relabeled as prediction, no load-bearing self-citation chain, and no imported uniqueness theorem or ansatz. The central claims rest on the interview corpus itself rather than reducing to prior author work or definitional equivalence. Generalizability limitations are a separate methodological concern, not evidence of circularity.
Axiom & Free-Parameter Ledger
Reference graph
Works this paper leans on
-
[1]
https://informationisbeautiful.net/wdvp/gallery- 2019, 2019
Information Is Beautiful. https://informationisbeautiful.net/wdvp/gallery- 2019, 2019. Accessed: 2026-06-27. 2
2019
-
[2]
Al-Hazwani, K
I. Al-Hazwani, K. E. A. Zhang, L. Garrison, and J. Bernard. Data humanism decoded: A characterization of its principles to bridge data visualization researchers and practitioners. InIEEE VIS Short Papers,
-
[3]
doi: 10.1109/VIS60296.2025.00057 1
-
[4]
A. Baigelenov, P. Shukla, and P. Parsons. How visualization designers perceive and use inspiration. InCHI. ACM, New York, 2025. doi: 10 .1145/3706598.3714191 2
-
[5]
L. Bartram, A. Patra, and M. Stone. Affective color in visualization. InCHI, 2017. doi: 10.1145/3025453.3026041 2
-
[6]
C. Blair, X. Wang, and C. Perin. Quantifying emotional responses to immutable data characteristics and designer choices in data visual- izations.TVCG, 31(1):1006–1016, 2025. doi: 10.1109/TVCG.2024. 3456361 1, 2, 3, 4
-
[7]
J. Boy, A. V . Pandey, J. Emerson, M. Satterthwaite, O. Nov, and E. Bertini. Showing people behind data: Does anthropomorphizing visualizations elicit more empathy for human rights data? InCHI,
-
[8]
doi: 10.1145/3025453.3025512 1, 2, 4
-
[9]
Braun and V
V . Braun and V . Clarke. Using thematic analysis in psychology.Qual- itative Research in Psychology, 3(2):77–101, 2006. doi: 10.1191/ 1478088706qp063oa 4
2006
-
[10]
K. Caine. Local standards for sample size at CHI. InCHI, pp. 981– 992, 2016. doi: 10.1145/2858036.2858498 4
-
[11]
S. K. Card, J. D. Mackinlay, and B. Shneiderman.Readings in Infor- mation Visualization: Using Vision to Think. Morgan Kaufmann, San Francisco, 1999. 1
1999
-
[12]
A. R. Damasio.Descartes’ Error: Emotion, Reason, and the Human Brain. G.P. Putnam’s Sons, New York, 1994. 1
1994
-
[13]
J. Fereday and E. Muir-Cochrane. Demonstrating rigor using thematic analysis: A hybrid approach of inductive and deductive coding and theme development.International Journal of Qualitative Methods, 5(1):80–92, 2006. doi: 10.1177/160940690600500107 2
-
[14]
L. K. M. Graf and J. R. Landwehr. A dual-process perspective on fluency-based aesthetics: The pleasure-interest model of aesthetic lik- ing.Personality and Social Psychology Review, 19(4):395–410, 2015. doi: 10.1177/1088868315574978 2
-
[15]
Halloran
N. Halloran. The Fallen of World War II.http://www.fallen.io/ ww2/, 2015. Interactive data-driven documentary. 3
2015
- [16]
- [17]
-
[18]
X. Lan, Y . Wu, Y . Shi, Q. Chen, and N. Cao. Negative emotions, pos- itive outcomes? Exploring the communication of negativity in serious data stories. InCHI, 2022. doi: 10.1145/3491102.3517530 2
-
[19]
X. Lan, Y . Yang, and Y . Wang. “Mapping what I feel”: Understanding affective geovisualization design through the lens of people–place re- lationships.TVCG, 32(1):145–155, 2026. doi: 10.1109/TVCG.2025. 3633878 2
-
[21]
E. Lee-Robbins and E. Adar. Assessing affective objectives for com- municative visualizations.arXiv:2604.01183, 2026. 2, 4
-
[22]
G. Lupi. Data humanism: The revolutionary future of data visualiza- tion. http://giorgialupi.com/data-humanism-my-manifesto-for-a-new- data-wold, 2017. Accessed: 2026-06-27. 1, 3
2017
-
[23]
S. McKenna, D. Mazur, J. Agutter, and M. Meyer. Design activity framework for visualization design.TVCG, 20(12):2191–2200, 2014. doi: 10.1109/TVCG.2014.2346331 4
-
[24]
L. Morais, Y . Jansen, N. Andrade, and P. Dragicevic. Can anthropo- graphics promote prosociality? A review and large-sample study. In CHI, 2021. doi: 10.1145/3411764.3445637 2, 4
-
[25]
T. Munzner. A nested model for visualization design and validation. TVCG, 15(6):921–928, 2009. doi: 10.1109/TVCG.2009.111 4
-
[26]
Munzner.Visualization Analysis and Design
T. Munzner.Visualization Analysis and Design. CRC Press, Boca Raton, FL, 2014. 1
2014
-
[27]
R. L. Nabi. Exploring the framing effects of emotion: Do discrete emotions differentially influence information accessibility, informa- tion seeking, and policy preference?Communication Research, 30(2):224–247, 2003. doi: 10.1177/0093650202250881 3
-
[28]
R. L. Nabi, A. Gustafson, and R. Jensen. Framing climate change: Exploring the role of emotion in generating advocacy be- havior.Science Communication, 40(4):442–468, 2018. doi: 10.1177/ 1075547018776019 3
2018
-
[29]
P. Parsons. Understanding data visualization design practice.TVCG, 28(1):665–675, 2022. doi: 10.1109/TVCG.2021.3114959 2
-
[30]
P. C. Parsons and P. C. Shukla. Beyond problem solving: Framing and problem–solution co-evolution in data visualization design.TVCG, 32(1):24–34, 2026. doi: 10.1109/TVCG.2025.3633866 4
-
[31]
Periscopic. U.S. Gun Deaths.https://guns.periscopic.com/,
-
[32]
Interactive data visualization, Accessed: 2026-06-27. 4
2026
-
[33]
V . I. Prantl, T. M ¨oller, and L. Koesten. Untangling rhetoric, pathos, and aesthetics in data visualization.TVCG, 32(2):2435–2453, 2026. doi: 10.1109/TVCG.2025.3628181 1, 2
-
[34]
R ¨onnberg
N. R ¨onnberg. Sonification supports perception of brightness contrast. Journal on Multimodal User Interfaces, 15:171–178, 2021. doi: 10. 1007/s12193-020-00378-1 3
2021
-
[35]
J. A. Russell. A circumplex model of affect.Journal of Person- ality and Social Psychology, 39(6):1161–1178, 1980. doi: 10.1037/ h0077714 2
1980
-
[36]
S. Scarr. Iraq’s Bloody Toll. South China Morning Post, 2011. Ac- cessed: 2026-06-27. 1
2011
-
[37]
D. A. Sch ¨on.The Reflective Practitioner: How Professionals Think in Action. Basic Books, New York, 1983. 4
1983
-
[38]
R. Schuster, K. Gregory, T. M ¨oller, and L. Koesten. Practitioners’ perspectives on designing data visualizations for the general public. InCHI, pp. 1–19, 2026. doi: 10.1145/3772318.3790627 2, 3
-
[39]
M. Sedlmair, M. Meyer, and T. Munzner. Design study methodology: Reflections from the trenches and the stacks.TVCG, 18(12):2431– 2440, 2012. doi: 10.1109/TVCG.2012.213 4
-
[40]
E. Segel and J. Heer. Narrative visualization: Telling stories with data. TVCG, 16(6):1139–1148, 2010. doi: 10.1109/TVCG.2010.179 1
-
[41]
if I look at the mass I will never act
P. Slovic. “if I look at the mass I will never act”: Psychic numbing and genocide.Judgment and Decision Making, 2(2):79–95, 2007. doi: 10 .1017/S1930297500000061 2, 3
2007
-
[42]
Swain.A Hybrid Approach to Thematic Analysis in Qualitative Research: Using a Practical Example
J. Swain.A Hybrid Approach to Thematic Analysis in Qualitative Research: Using a Practical Example. SAGE Publications, London,
-
[43]
doi: 10.4135/9781526435477 2
-
[44]
D. V ¨astfj¨all, P. Slovic, M. Mayorga, and E. Peters. Compassion fade: Affect and charity are greatest for a single child in need.PLOS ONE, 9(6):e100115, 2014. doi: 10.1371/journal.pone.0100115 2, 3
-
[45]
R. M. Winters and M. M. Wanderley. Sonification of emotion: Strate- gies and results from the intersection with music.Organised Sound, 19(1):60–69, 2014. doi: 10.1017/S1355771813000411 3
-
[46]
F. Yang, M. Cai, C. Mortenson, H. Fakhari, A. D. Lokmanoglu, N. Di- akopoulos, E. C. Nisbet, and M. Kay. Swaying the public? Impacts of election forecast visualizations on emotion, trust, and intention in the 2022 U.S. midterms.TVCG, 30(1):23–33, 2024. doi: 10.1109/TVCG .2023.3327356 1, 2
-
[47]
X. Zhang and R. Wakkary. Understanding the role of designers’ per- sonal experiences in interaction design practice. InDIS, 2014. doi: 10 .1145/2598510.2598556 3
-
[48]
Y . Zhang, Y . Sun, J. D. Gaggiano, N. Kumar, C. Andris, and A. G. Parker. Visualization design practices in a crisis: Behind the scenes with COVID-19 dashboard creators.TVCG, 29(1):1037–1047, 2023. doi: 10.1109/TVCG.2022.3209493 2
discussion (0)
Sign in with ORCID, Apple, or X to comment. Anyone can read and Pith papers without signing in.