Fast and Accurate Anomaly Detection in Time Series
Pith reviewed 2026-07-03 17:13 UTC · model grok-4.3
The pith
A custom t-test on Haar wavelet coefficients detects time series anomalies in an unsupervised way.
A machine-rendered reading of the paper's core claim, the machinery that carries it, and where it could break.
Core claim
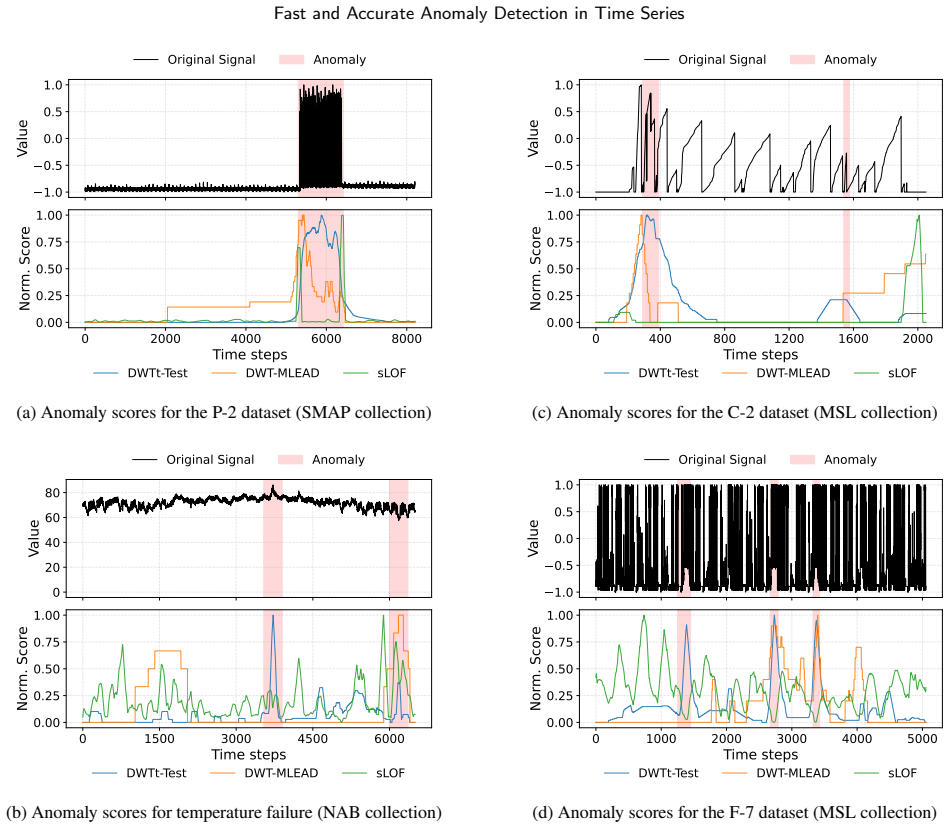
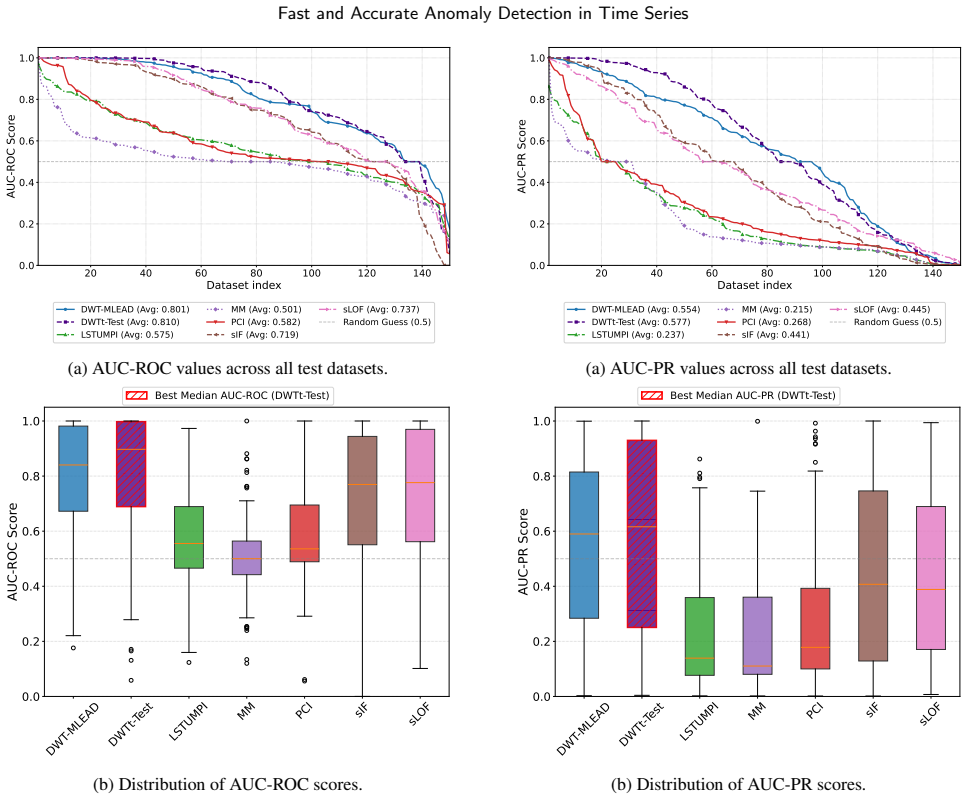
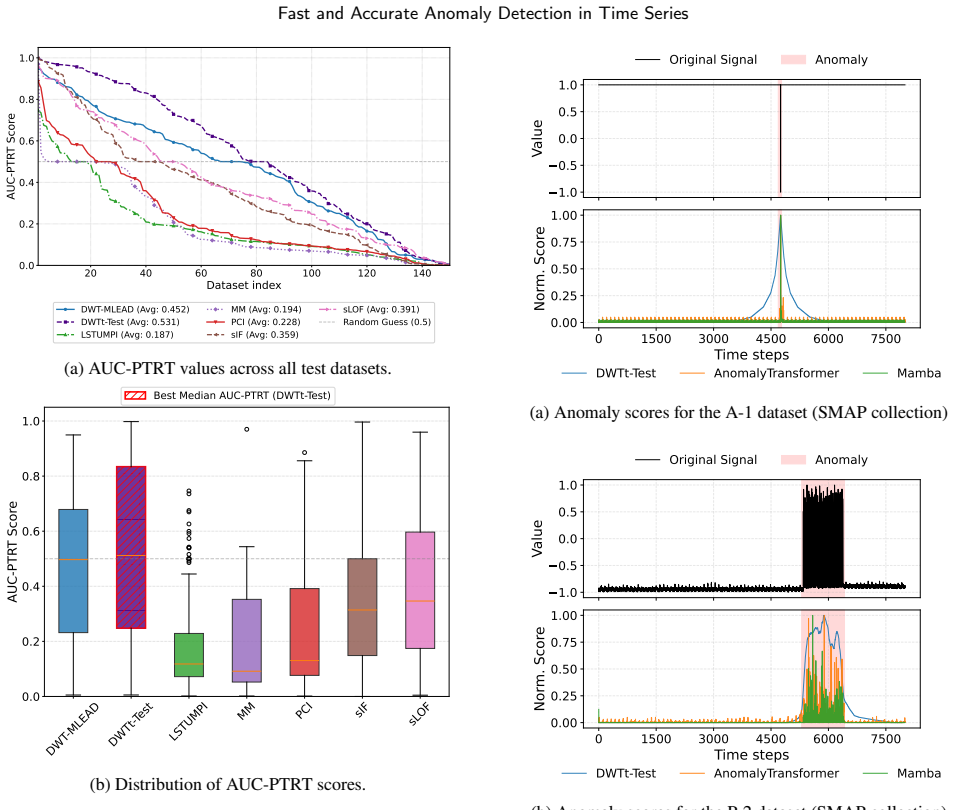
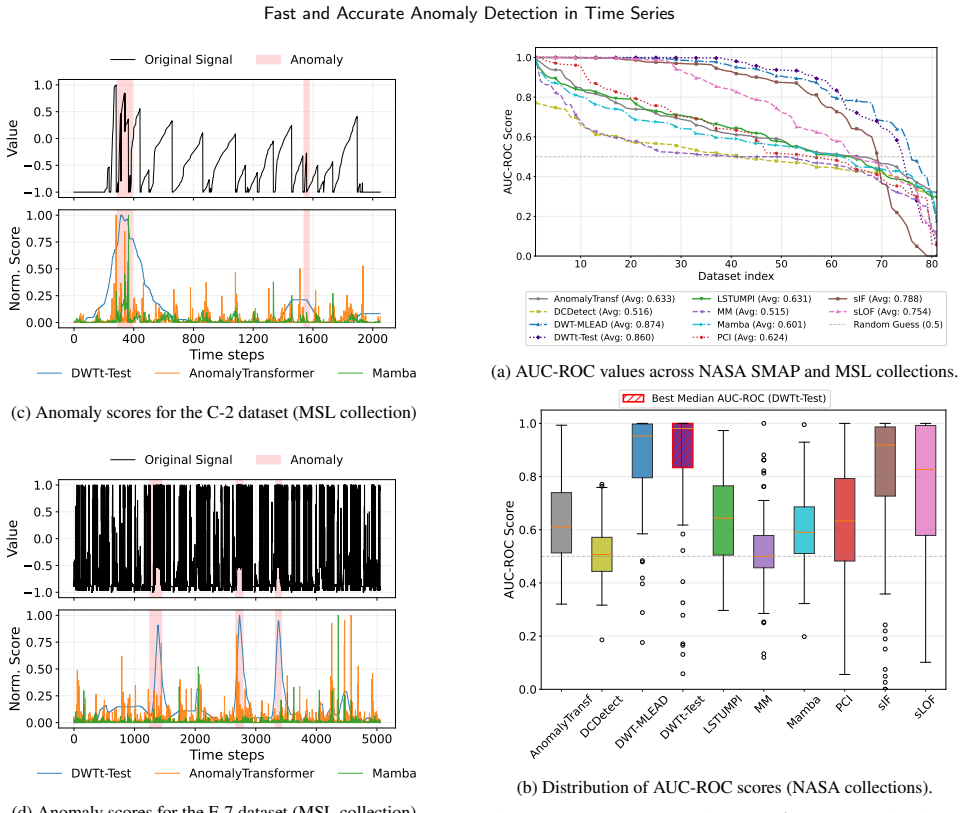
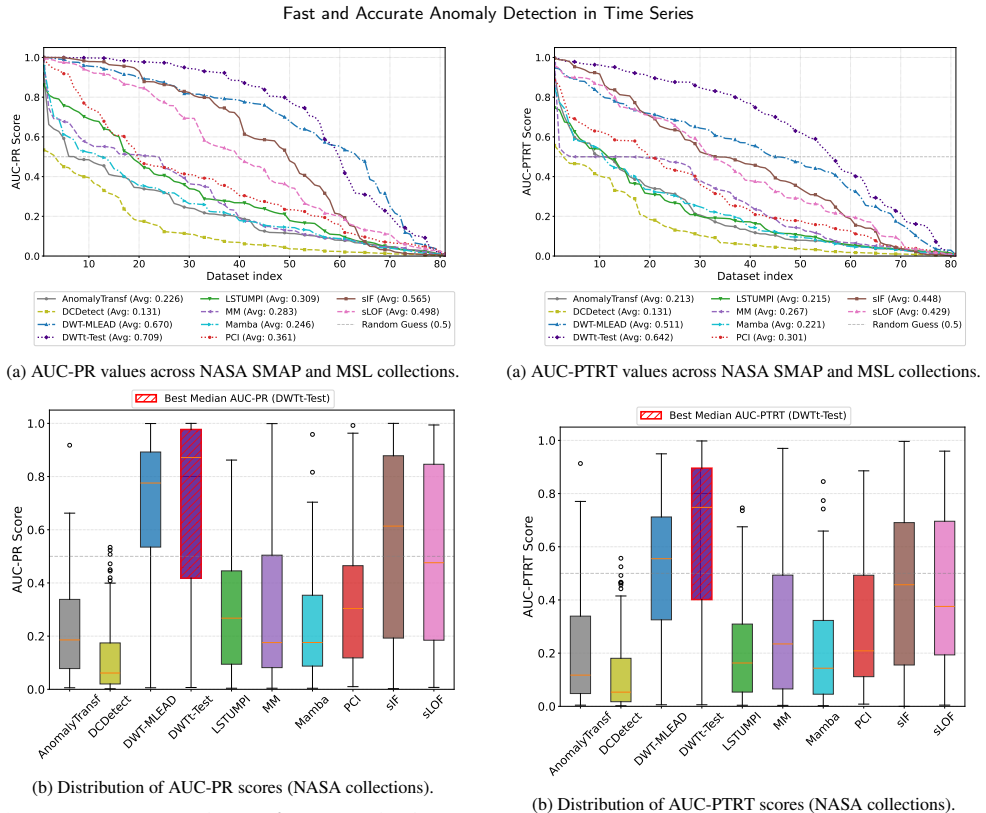
The paper establishes the theoretical foundation of a t-test constructed to operate on Haar discrete wavelet coefficients and shows that the resulting unsupervised detector achieves higher accuracy than current benchmarks across 343 time-series datasets while remaining computationally efficient.
What carries the argument
A custom t-test applied directly to Haar wavelet coefficients that flags anomalies through statistical deviation testing in the transformed domain.
If this is right
- The detector can be used in safety-critical settings without requiring labelled anomaly examples.
- Computation remains linear in the series length because the Haar transform and t-test are both fast.
- No dataset-specific tuning is needed to achieve the reported performance levels.
- The method scales to large numbers of series because it avoids any training phase.
Where Pith is reading between the lines
- The same coefficient-testing idea could be tried with other wavelet families or with short-time Fourier transforms to handle different frequency characteristics.
- Online variants might update the t-statistic incrementally as new observations arrive, enabling real-time monitoring.
- Combining the wavelet test with simple thresholding on raw values could reduce misses on anomalies that are not well captured in the detail coefficients.
Load-bearing premise
The custom t-test retains its statistical validity and power when the input consists of Haar wavelet coefficients from real-world time series that may deviate from ideal theoretical conditions.
What would settle it
A new collection of time-series datasets on which the algorithm fails to match or exceed the accuracy of the strongest published unsupervised and self-supervised baselines would falsify the performance claim.
Figures
read the original abstract
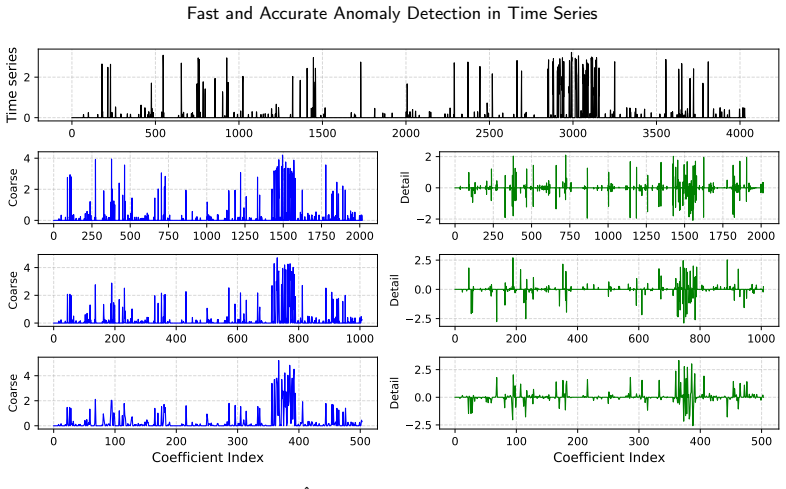
Anomaly detection is a critical and evolving field in Machine Learning, with applications targeting different domains such as cybersecurity, finance, healthcare, manufacturing and IoT (Internet of Things) systems. Traditionally, anomaly detection algorithms have been designed using both supervised and unsupervised learning paradigms. The fundamental challenge in real-world anomaly detection scenarios is related to the inherent class imbalance (anomalies are typically rare) and, for supervised methods, to the scarcity of labelled anomalous data. Indeed, labelling is both expensive and time-consuming. Conversely unsupervised methods do not require labelling, but may suffer from high false positive rates when deployed in safety-critical applications. In this work we introduce a novel unsupervised algorithm for anomaly detection in time series based on the Haar discrete wavelet and a suitably designed $t$-test. We establish the theoretical foundation of the proposed $t$-test and, through extensive experimentation across 343 datasets, demonstrate that our algorithm outperforms state-of-the-art unsupervised and self-supervised benchmarks.
Editorial analysis
A structured set of objections, weighed in public.
Referee Report
Summary. The manuscript introduces a novel unsupervised anomaly detection algorithm for time series based on the Haar discrete wavelet transform paired with a custom-designed t-test. The authors claim to establish the theoretical foundation of this t-test and report that extensive experiments across 343 datasets show the method outperforming state-of-the-art unsupervised and self-supervised benchmarks.
Significance. If the theoretical foundation for the t-test holds and the reported performance gains are robust, the work would be significant for providing a fast, label-free approach that mitigates high false-positive rates in safety-critical domains. The scale of the empirical evaluation (343 datasets) is a clear strength that supports generalizability claims.
minor comments (1)
- The abstract refers to a 'suitably designed t-test' without previewing key design choices; adding a brief high-level description of the test statistic or its wavelet-specific properties in the abstract or introduction would improve accessibility.
Simulated Author's Rebuttal
We thank the referee for their review. The summary accurately reflects the manuscript's contributions, and we appreciate the recognition of the empirical evaluation scale as a strength. No specific major comments are listed in the report.
Circularity Check
No significant circularity detected
full rationale
The provided abstract and description establish a novel unsupervised method using Haar wavelets and a custom t-test, with a claimed theoretical foundation and empirical validation on 343 datasets. No load-bearing steps reduce by construction to fitted inputs, self-definitions, or self-citation chains; the derivation chain for the t-test and performance claims remains independent of its own outputs. This is the expected honest non-finding for a paper whose central claims rest on external benchmarks rather than internal redefinitions.
Axiom & Free-Parameter Ledger
Reference graph
Works this paper leans on
-
[1]
Neural Networks and Deep Learning: A Textbook
Aggarwal, C.C., 2023. Neural Networks and Deep Learning: A Textbook. 2nd ed., Springer Publishing Company, Incorporated. doi:10.1007/978-3-031-29642-0
-
[2]
Aggarwal, C.C., Yu, P.S., 2001. Outlier detection for high dimen- sionaldata,in:Proceedingsofthe2001ACMSIGMODInternational Conference on Management of Data, Association for Computing Machinery, New York, NY, USA. p. 37–46. URL:https://doi.org/ 10.1145/375663.375668, doi:10.1145/375663.375668
-
[3]
Unsupervised real- time anomaly detection for streaming data
Ahmad, S., Lavin, A., Purdy, S., Agha, Z., 2017. Unsupervised real- time anomaly detection for streaming data. Neurocomputing 262. doi:10.1016/j.neucom.2017.04.070
-
[4]
Anomaly detection in time series data using reversible instance normalized anomaly transformer
Baidya, R., Jeong, H., 2023. Anomaly detection in time series data using reversible instance normalized anomaly transformer. Sensors
2023
-
[5]
URL:https://www.mdpi.com/1424-8220/23/22/9272, doi:10.3390/ s23229272
-
[6]
Automatic outlier detection for timeseries:Anapplicationtosensordata
Basu, S., Meckesheimer, M., 2007. Automatic outlier detection for timeseries:Anapplicationtosensordata. Knowl.Inf.Syst.11,137–
2007
-
[7]
doi:10.1007/s10115-006-0026-6
-
[8]
Benali,A.A.E.,Cafaro,M.,Epicoco,I.,Pulimeno,M.,Schioppa,E.J.,
-
[9]
Just in time transformers. IEEE Access 12, 178751–178767. doi:10.1109/ACCESS.2024.3504862
-
[10]
Scaling clustering algo- rithms to large databases, in: Proceedings of the Fourth International ConferenceonKnowledge DiscoveryandDataMining, AAAIPress
Bradley, P.S., Fayyad, U., Reina, C., 1998. Scaling clustering algo- rithms to large databases, in: Proceedings of the Fourth International ConferenceonKnowledge DiscoveryandDataMining, AAAIPress. p. 9–15
1998
-
[11]
Breunig, M.M., Kriegel, H.P., Ng, R.T., Sander, J., 2000a. Lof: identifying density-based local outliers, in: Proceedings of the 2000 ACM SIGMOD International Conference on Management of Data, Association for Computing Machinery, New York, NY, USA. p. 93–104. URL:https://doi.org/10.1145/342009.335388, doi:10.1145/ 342009.335388
-
[12]
Lof:iden- tifyingdensity-basedlocaloutliers
Breunig,M.M.,Kriegel,H.P.,Ng,R.T.,Sander,J.,2000b. Lof:iden- tifyingdensity-basedlocaloutliers. SIGMODRec.29,93–104. URL: https://doi.org/10.1145/335191.335388, doi:10.1145/335191.335388
-
[13]
Smote:syntheticminorityover-samplingtechnique
Chawla, N.V., Bowyer, K.W., Hall, L.O., Kegelmeyer, W.P., 2002. Smote:syntheticminorityover-samplingtechnique. J.Artif.Int.Res. 16, 321–357
2002
-
[14]
A k-nearest neigh- bors approach to the design of radar detectors
Coluccia, A., Fascista, A., Ricci, G., 2020. A k-nearest neigh- bors approach to the design of radar detectors. Signal Processing 174,107609. URL:https://www.sciencedirect.com/science/article/ pii/S0165168420301523, doi:https://doi.org/10.1016/j.sigpro.2020. 107609
-
[15]
Enderlein, G., 1987. Hawkins, d. m.: Identification of outliers. chap- man and hall, london – new york 1980, 188 s., £ 14, 50. Biometrical Journal 29, 198–198. doi:https://doi.org/10.1002/bimj.4710290215
-
[16]
Ester, M., Kriegel, H.P., Sander, J., Xu, X., 1996. A density-based algorithm for discovering clusters in large spatial databases with noise, in: Proceedings of the Second International Conference on Knowledge Discovery and Data Mining, AAAI Press. p. 226–231
1996
-
[17]
Bayesian signal processing for robust iot: Classical vs
Fascista, A., Coluccia, A., 2025. Bayesian signal processing for robust iot: Classical vs. graph based methods for joint estimation and Emanuele Mele et al.:Preprint submitted to ElsevierPage 17 of 19 Fast and Accurate Anomaly Detection in Time Series anomaly detection. IEEE Internet of Things Magazine 8, 112–119. doi:10.1109/MIOT.2025.3575885
-
[18]
Procedures for detecting outlying observations in samples
Grubbs, F.E., 1969. Procedures for detecting outlying observations in samples. Technometrics 11, 1–21. doi:10.1080/00401706.1969. 10490657
-
[19]
Guha, S., Rastogi, R., Shim, K., 1998. Cure: an efficient clustering algorithmforlargedatabases,in:Proceedingsofthe1998ACMSIG- MODInternationalConferenceonManagementofData,Association for Computing Machinery, New York, NY, USA. p. 73–84. URL: https://doi.org/10.1145/276304.276312, doi:10.1145/276304.276312
-
[20]
Extendedisolationforest
Hariri,S.,Kind,M.C.,Brunner,R.J.,2021. Extendedisolationforest. IEEE Transactions on Knowledge and Data Engineering 33, 1479–
2021
-
[21]
doi:10.1109/TKDE.2019.2947676
- [22]
-
[23]
Dasvdd: Deep autoencoding sup- portvectordatadescriptorforanomalydetection
Hojjati, H., Armanfard, N., 2024. Dasvdd: Deep autoencoding sup- portvectordatadescriptorforanomalydetection. IEEETransactions on Knowledge and Data Engineering 36, 3739–3750. doi:10.1109/ TKDE.2023.3328882
-
[24]
Hundman, K., Constantinou, V., Laporte, C., Colwell, I., Soder- strom, T., 2018. Detecting spacecraft anomalies using lstms and nonparametric dynamic thresholding, in: Proceedings of the 24th ACMSIGKDDInternationalConferenceonKnowledgeDiscovery& DataMining,AssociationforComputingMachinery,NewYork,NY, USA. p. 387–395. URL:https://doi.org/10.1145/3219819.32...
-
[25]
Ihler,A.,Hutchins,J.,Smyth,P.,2006. Adaptiveeventdetectionwith time-varying poisson processes, in: Proceedings of the 12th ACM SIGKDD International Conference on Knowledge Discovery and DataMining,AssociationforComputingMachinery,NewYork,NY, USA. p. 207–216. URL:https://doi.org/10.1145/1150402.1150428, doi:10.1145/1150402.1150428
-
[26]
Kesharwani, A., Shukla, P., 2024. A review of anomaly detection usingmachinelearningtechniques,in:20241stInternationalConfer- ence on Advanced Computing and Emerging Technologies (ACET), pp. 1–6. doi:10.1109/ACET61898.2024.10730574
-
[27]
Lahoti, A., Li, K.Y., Chen, B., Wang, C., Bick, A., Kolter, J.Z., Dao, T., Gu, A., 2026. Mamba-3: Improved sequence modeling usingstatespaceprinciples.URL:https://arxiv.org/abs/2603.15569, arXiv:2603.15569
-
[28]
Li, D., Chen, D., Jin, B., Shi, L., Goh, J., Ng, S.K., 2019. Mad-gan: Multivariate anomaly detection for time series data with generative adversarial networks, in: Tetko, I.V., Kůrková, V., Karpov, P., Theis, F.(Eds.),ArtificialNeuralNetworksandMachineLearning–ICANN 2019:TextandTimeSeries,SpringerInternationalPublishing,Cham. pp. 703–716
2019
-
[29]
A survey of deep learning for industrial visual anomaly detection
Li, Z., Yan, Y., Wang, X., Ge, Y., Meng, L., 2025. A survey of deep learning for industrial visual anomaly detection. Artif. Intell. Rev. 58, 279. URL:https://doi.org/10.1007/s10462-025-11287-7, doi:10.1007/S10462-025-11287-7
-
[30]
Liso, A., Cardellicchio, A., Patruno, C., Nitti, M., Ardino, P., Stella, E., Renò, V., 2024. A review of deep learning-based anomaly detection strategies in industry 4.0 focused on application fields, sensing equipment, and algorithms. IEEE Access 12, 93911–93923. doi:10.1109/ACCESS.2024.3424488
-
[32]
Liu, F.T., Ting, K.M., Zhou, Z.H., 2008b. Isolation forest, in: Proceedings of the 2008 Eighth IEEE International Conference on Data Mining, IEEE Computer Society, USA. p. 413–422. URL: https://doi.org/10.1109/ICDM.2008.17, doi:10.1109/ICDM.2008.17
-
[33]
Recurrent neural networks for anomaly detection in magnet power supplies of particle accelerators
Lobach, I., Borland, M., 2024. Recurrent neural networks for anomaly detection in magnet power supplies of particle accelerators. Machine Learning with Applications 18, 100585. URL:https: //www.sciencedirect.com/science/article/pii/S2666827024000616, doi:https://doi.org/10.1016/j.mlwa.2024.100585
-
[34]
Wavelets and operators
Meyer, Y., 1992. Wavelets and operators. 37, Cambridge university press
1992
-
[35]
Deepone-classclassification, in: Dy, J., Krause, A
Ruff, L., Vandermeulen, R., Goernitz, N., Deecke, L., Siddiqui, S.A., Binder,A.,Müller,E.,Kloft,M.,2018. Deepone-classclassification, in: Dy, J., Krause, A. (Eds.), Proceedings of the 35th International Conference on Machine Learning, PMLR. pp. 4393–4402. URL: https://proceedings.mlr.press/v80/ruff18a.html
2018
-
[36]
f-anogan: Fast unsupervised anomaly detection with generative adversarial networks
Schlegl,T.,Seeböck,P.,Waldstein,S.M.,Langs,G.,Schmidt-Erfurth, U., 2019. f-anogan: Fast unsupervised anomaly detection with generative adversarial networks. Medical Image Analysis 54, 30–44. doi:https://doi.org/10.1016/j.media.2019.01.010
-
[37]
Anomaly detection in time series: a comprehensive evaluation
Schmidl, S., Wenig, P., Papenbrock, T., 2022. Anomaly detection in time series: a comprehensive evaluation. Proc. VLDB Endow. 15, 1779–1797. URL:https://doi.org/10.14778/3538598.3538602, doi:10.14778/3538598.3538602
-
[38]
Estimating the support of a high-dimensional dis- tribution
Schölkopf, B., Platt, J.C., Shawe-Taylor, J., Smola, A.J., Williamson, R.C., 2001. Estimating the support of a high-dimensional dis- tribution. Neural Computation 13, 1443–1471. doi:10.1162/ 089976601750264965
2001
-
[39]
Mamba adaptive anomaly transformer with association discrepancy for time series
Sellam, A.Z., Benaissa, I., Taleb-Ahmed, A., Patrono, L., Distante, C., 2025. Mamba adaptive anomaly transformer with association discrepancy for time series. Engineering Applications of Artifi- cial Intelligence 160, 111685. URL:https://www.sciencedirect. com/science/article/pii/S0952197625016872,doi:https://doi.org/10. 1016/j.engappai.2025.111685
-
[40]
A review of deep learning based anomaly detection
Shi, Y., Yang, G., Wang, X., Yu, Q., Feng, Y., Liu, A., 2026. A review of deep learning based anomaly detection. Neurocomputing 668,132383. URL:https://www.sciencedirect.com/science/article/ pii/S0925231225030553, doi:https://doi.org/10.1016/j.neucom.2025. 132383
-
[41]
Shrestha,S.,Zhang,Y.,Liu,H.,Silwal,A.,2025. Sparsetransformer for anomaly detection with association discrepancy, in: 2025 IEEE 37th International Conference on Tools with Artificial Intelligence (ICTAI), pp. 591–598. doi:10.1109/ICTAI66417.2025.00086
-
[42]
Somepalli, G., Wu, Y., Balaji, Y., Vinzamuri, B., Feizi, S., 2021. Unsupervised anomaly detection with adversarial mirrored autoen- coders,in:deCampos,C.,Maathuis,M.H.(Eds.),Proceedingsofthe Thirty-Seventh Conference on Uncertainty in Artificial Intelligence, PMLR. pp. 365–375. URL:https://proceedings.mlr.press/v161/ somepalli21a.html
2021
-
[43]
Su, Y., Zhao, Y., Niu, C., Liu, R., Sun, W., Pei, D., 2019. Robust anomaly detection for multivariate time series through stochastic recurrentneuralnetwork,in:Proceedingsofthe25thACMSIGKDD International Conference on Knowledge Discovery & Data Mining, Association for Computing Machinery, New York, NY, USA. p. 2828–2837. URL:https://doi.org/10.1145/3292500...
-
[44]
Precision and recall for time series, in: Bengio, S., Wallach, H., Larochelle, H., Grauman, K., Cesa-Bianchi, N., Garnett, R
Tatbul, N., Lee, T.J., Zdonik, S., Alam, M., Gottschlich, J., 2018. Precision and recall for time series, in: Bengio, S., Wallach, H., Larochelle, H., Grauman, K., Cesa-Bianchi, N., Garnett, R. (Eds.), Advances in Neural Information Processing Systems, Curran As- sociates, Inc. URL:https://proceedings.neurips.cc/paper_files/ paper/2018/file/8f468c873a32bb...
2018
-
[45]
Thill,M.,Konen,W.,Bäck,T.,2020.Markusthill/mgab:Themackey- glass anomaly benchmark (version v1.0.1).https://doi.org/10. 5281/zenodo.3762385. URL:https://doi.org/10.5281/zenodo.3762385, doi:10.5281/ZENODO.3762385. accessed on YYYY-MM-DD
-
[46]
Time series anomaly detection withdiscretewavelettransformsandmaximumlikelihoodestimation
Thill, M., Konen, W., Bäck, T., 2019. Time series anomaly detection withdiscretewavelettransformsandmaximumlikelihoodestimation
2019
-
[47]
Anomaly detection usinglongshorttermmemorynetworksanditsapplicationsinsupply chain management
Tran, K.P., Nguyen, H.D., Thomassey, S., 2019. Anomaly detection usinglongshorttermmemorynetworksanditsapplicationsinsupply chain management. IFAC-PapersOnLine 52, 2408–2412. doi:https: //doi.org/10.1016/j.ifacol.2019.11.567. 9th IFAC Conference on Manufacturing Modelling, Management and Control MIM 2019. Emanuele Mele et al.:Preprint submitted to Elsevie...
-
[48]
Attention is all you need, in: Proceedings of the 31st International Conference on Neural Infor- mation Processing Systems, Curran Associates Inc., Red Hook, NY, USA
Vaswani,A.,Shazeer,N.,Parmar,N.,Uszkoreit,J.,Jones,L.,Gomez, A.N., Kaiser, L., Polosukhin, I., 2017. Attention is all you need, in: Proceedings of the 31st International Conference on Neural Infor- mation Processing Systems, Curran Associates Inc., Red Hook, NY, USA. p. 6000–6010
2017
-
[49]
Contrastive deep support vector data description
Xing, H.J., Zhang, P.P., 2023. Contrastive deep support vector data description. Pattern Recognition 143, 109820. URL:https: //www.sciencedirect.com/science/article/pii/S0031320323005186, doi:https://doi.org/10.1016/j.patcog.2023.109820
-
[50]
arXiv preprint arXiv:2110.02642 , year=
Xu, J., Wu, H., Wang, J., Long, M., 2022a. Anomaly transformer: Time series anomaly detection with association discrepancy. URL: https://arxiv.org/abs/2110.02642,arXiv:2110.02642
-
[51]
Anomaly transformer: Time series anomaly detection with association discrepancy, in: In- ternational Conference on Learning Representations
Xu, J., Wu, H., Wang, J., Long, M., 2022b. Anomaly transformer: Time series anomaly detection with association discrepancy, in: In- ternational Conference on Learning Representations. URL:https: //openreview.net/forum?id=LzQQ89U1qm_
-
[52]
Yang, Y., Zhang, C., Zhou, T., Wen, Q., Sun, L., 2023. Dcde- tector: Dual attention contrastive representation learning for time series anomaly detection, in: Proceedings of the 29th ACM SIGKDD Conference on Knowledge Discovery and Data Mining, Association for Computing Machinery, New York, NY, USA. p. 3033–3045. URL:https://doi.org/10.1145/3580305.359929...
-
[53]
Yeh, C.C.M., Zhu, Y., Ulanova, L., Begum, N., Ding, Y., Dau, A., Silva, D., Mueen, A., Keogh, E., 2016. Matrix profile i: All pairs similarity joins for time series: A unifying view that includes motifs, discords and shapelets, pp. 1317–1322. doi:10.1109/ICDM.2016.0179
-
[54]
Time series outlier detection based on sliding window prediction
yf, y., Zhu, Y., Li, S., Wan, D., 2014. Time series outlier detection based on sliding window prediction. Mathematical Problems in Engineering 2014. doi:10.1155/2014/879736. Emanuele Mele et al.:Preprint submitted to ElsevierPage 19 of 19
discussion (0)
Sign in with ORCID, Apple, or X to comment. Anyone can read and Pith papers without signing in.