REVIEW 3 major objections 5 minor 95 references
Users’ felt ability to anticipate a system’s behavior is a distinct construct from how correctly they actually forecast it, and a validated 6-item scale measures that perception.
Reviewed by Pith at T0; open to challenge. T0 means a machine referee read the full paper against a public rubric. the ladder, T0–T4 →
T0 review · grok-4.5
2026-07-11 03:58 UTC pith:2Q4OIQQN
load-bearing objection Solid, usable 6-item scale for perceived predictability with clean psychometrics and a real dissociation finding; external validity to opaque models is the open question, not a hidden flaw. the 3 major comments →
Perceived System Predictability: Scale Development and Application
The pith
A machine-rendered reading of the paper's core claim, the machinery that carries it, and where it could break.
Core claim
Perceived system predictability is a user-centered construct that cannot be reduced to objective prediction correctness or to existing subjective measures such as trust. A 6-item scale grounded in epistemic, aleatory, and effective predictability shows strong psychometric properties and supports both unidimensional and three-factor use. In a sentiment-classifier study, PSP itself predicts how correctly users forecast system outputs; explanation format shifts PSP without shifting correctness; and increased stochasticity degrades correctness without lowering PSP. PSP therefore captures mental-model aspects that objective and adjacent subjective measures leave unaddressed.
What carries the argument
Perceived system predictability (PSP) and its 6-item scale. PSP is the degree to which a user feels able to predict how a system behaves, decomposed into epistemic, aleatory, and effective facets. Two items per facet yield an overall mean score and optional subscale scores; that instrument, validated via known-groups and nomological analyses, carries the claim that PSP is measurable and distinct from correctness and trust.
Load-bearing premise
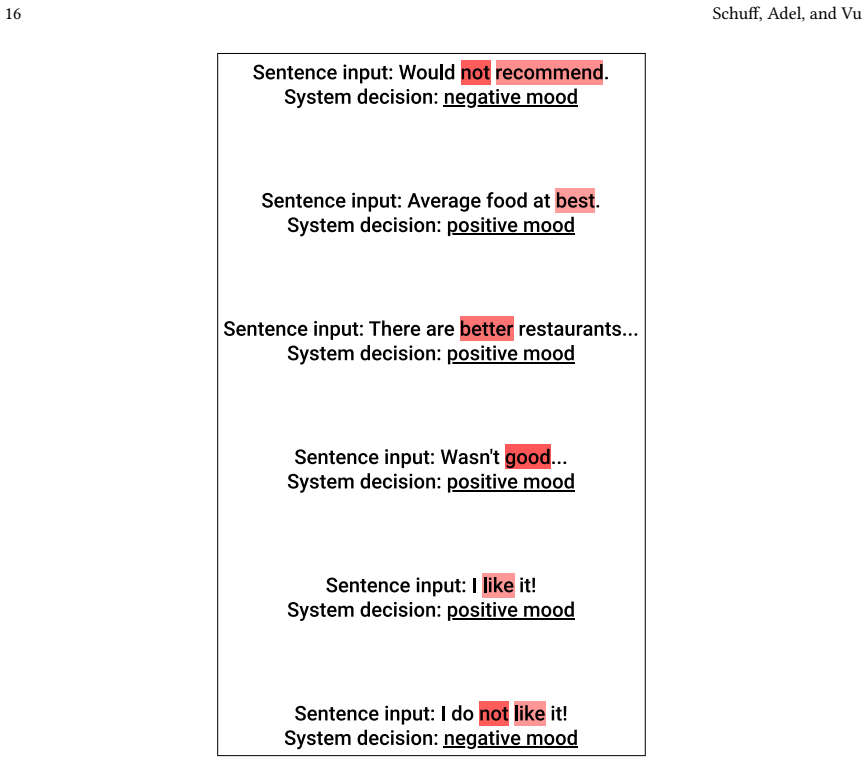
The results rest on tightly controlled transparent classifiers—a fictional shape mapper and a rule-based sentiment model—rather than opaque modern systems where explanations may not match the true decision process.
What would settle it
Rerun the sentiment study with a large language model and post-hoc explanations of deliberately low faithfulness: if explanation format still moves PSP while the correctness and trust patterns reverse or disappear, the claim that PSP generalizes as a model-agnostic construct is undercut.
If this is right
- HCI evaluations of interactive AI should report PSP alongside objective prediction tasks, trust, and usability rather than treating any one as a proxy for the others.
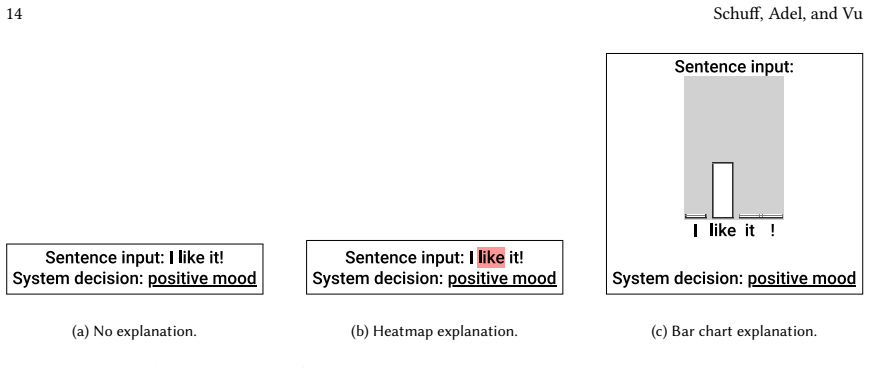
- Explanation designers can raise or lower how predictable a system feels (for example heatmap versus bar chart) without necessarily improving users’ actual forecasts of its outputs.
- Raising system stochasticity can impair forecast accuracy while leaving felt predictability unchanged, so miscalibration may go undetected by self-report alone.
- The scale enables both brief unidimensional screening and finer three-facet diagnosis when epistemic and aleatory levels are expected to differ.
- Transparent, trustworthy system design can treat users’ ability to anticipate behavior as a first-class, measurable design target.
Where Pith is reading between the lines
- If visualization choices can raise PSP without improving forecast skill, some explanation interfaces may create a false sense of predictability that encourages over-reliance in high-stakes settings.
- Applying the scale to large language models will need explanation faithfulness as an explicit experimental factor, because post-hoc explanations could themselves inflate or deflate PSP.
- Product teams could treat a lightweight prediction probe plus the PSP scale as paired early-warning signals after model or UX changes.
- Bias-mitigating chart designs (such as cumulative bars) may be a practical way to keep felt predictability closer to actual predictive skill.
Editorial analysis
A structured set of objections, weighed in public.
Referee Report
Summary. The paper introduces perceived system predictability (PSP) as a user-centered construct grounded in uncertainty theory, distinguishing epistemic, aleatory, and effective facets. It contributes a theoretical framing relative to trust and understanding, a 6-item scale developed from a 60-item pool via expert review and cognitive interviews, and psychometric validation in a fictional shape-classifier study (N=200) supporting both unidimensional and three-factor hierarchical structures with high reliability and known-groups differentiation. A second sentiment-classifier study (N=200) varies explanation modality and stochasticity and relates PSP to prediction correctness, trust (FOST), SIPA, and need for cognition. The central applied claim is that PSP and objective prediction correctness capture distinct aspects of users’ mental models and can diverge: PSP predicts correctness, explanations shift PSP but not correctness, and increased stochasticity degrades correctness without lowering PSP.
Significance. If the scale is psychometrically sound and the reported dissociations hold under broader conditions, this is a useful contribution to HCI and human-centered XAI: the field has lacked a dedicated, validated instrument for perceived predictability, and the paper shows that neither objective prediction tasks nor adjacent self-report constructs (trust, SIPA) are adequate substitutes. Strengths include a conventional multi-stage scale-development pipeline, CFA with both one- and three-factor models, known-groups tests, concurrent validity against SIPA, two adequately powered between-subjects studies, and GAM analyses that allow non-linear relations. The work also provides a public project page and a clear scoring example. These are genuine assets for cumulative research on calibrated reliance and transparent interactive systems.
major comments (3)
- [Abstract; §4.1.1; §4.4; §5; §6] Abstract and §§4–5 state a general dissociation (explanations shift PSP not correctness; noise degrades correctness without lowering PSP). That pattern is demonstrated only with a fully transparent SentiWordNet rule-based classifier whose decision rule coincides with the communicated explanation (§4.1.1) and, earlier, a fictional shape task. The authors themselves attribute noise-invariance of PSP to the illusion of explanatory depth when participants can fall back on their own sentiment judgments (§4.4). In opaque systems with post-hoc explanations, both the explanation-induced PSP shift and the noise-invariance could shrink or reverse. §6 acknowledges the gap but does not scope the abstract/conclusion claims accordingly. The central applied claim needs explicit boundary conditions (transparent vs opaque models; faithful vs post-hoc explanations) or additional evidence; otherwise the ge
- [§3.3.6; Table 4; Fig. 7] CFA supports both models, but Pearson correlations among the three facets are extremely high (0.901, 0.889, 0.876; §3.3.6), and parsimony indices favor the one-factor model. Retaining two items per facet is reasonable for reliability estimation, yet the manuscript does not give concrete decision rules for when subscale scores add interpretive value beyond the total mean. Given near-redundancy, claims that the hierarchical structure is practically usable need either (a) clearer guidance and example use-cases where facets diverge, or (b) stronger evidence that subscales discriminate differently under theoretically targeted manipulations (e.g., pure epistemic vs pure aleatory designs).
- [§3.3.8; §4.5; Table 10] Concurrent validity with SIPA is very strong (r=0.856, p<.001; §3.3.8 and Table 10), only modestly below internal PSP subscale correlations. The paper argues PSP is more focused and better predicts objective correctness than SIPA, which is an important differentiator, but the nomological network still leaves open how much unique variance PSP captures once SIPA’s predictability subscale is partialled out. A brief hierarchical or residual analysis (PSP total vs SIPA-predictability items predicting correctness/trust) would strengthen the claim that a dedicated instrument is necessary rather than a refined SIPA subscale.
minor comments (5)
- [Table 1; §3.3.2; Appendix A.3] Table 1 and the scoring example (Appendix A.3) are clear; consider stating in the main text whether reverse-coded items were considered and rejected, and whether item order is fixed in deployment (noted as fixed in §4 but randomized in validation).
- [§4.3; §4.4; Tables 6–9] In §4.3–4.4, multiple GAMs and post-hoc Wald contrasts are reported. A short note on family-wise error control (or why none is applied) would help readers interpret the p-values for explanation-format and noise contrasts.
- [Fig. 13] Figure 13 normalizes PSP for visual comparison with correctness; state the normalization explicitly in the caption so the y-axis is not misread as raw Likert means.
- [Fig. 1; Table 2; §1.1] Minor wording: “repsponses” appears in Fig. 1 caption; “product [sic]” is already flagged in Table 2; a few long sentences in §1.1 could be split for readability.
- [§3.3.3; §4.1.4] Recruitment is restricted to US/AU/UK MTurk workers. A sentence on language and cultural scope of the instrument would help future users decide on translation/adaptation needs.
Circularity Check
No circularity: empirical scale development and experimental dissociation, not a derivation that reduces to its own inputs.
full rationale
The paper is instrument development and nomological validation in HCI, not a first-principles derivation. PSP is defined as a user-centered construct (degree to which a user feels able to predict system behavior), decomposed into epistemic/aleatory/effective facets grounded in uncertainty theory and target-population interviews; the 6-item scale is obtained by item generation, expert review, cognitive interviews, and CFA/reliability/known-groups tests on an independent N=200 shape-classifier sample. Concurrent validity with SIPA (r=0.856) is reported as expected theoretical overlap yet weaker than internal subscale correlations, and is not used to force the construct. The application study (sentiment classifier, N=200) treats explanation format and noise as experimental factors and reports empirical dissociations via GAMs (explanations shift PSP but not correctness; noise degrades correctness without lowering PSP; PSP predicts correctness while objective correctness does not predict PSP). These are observed associations, not fitted parameters renamed as predictions, self-definitional identities, uniqueness theorems imported from the authors, or ansatzes smuggled via self-citation. Self-citations to the authors’ prior explanation work are background only and not load-bearing for the scale or the dissociation claims. The paper is therefore self-contained against its own benchmarks; external-validity limits (transparent classifier) are a separate concern, not circularity.
Axiom & Free-Parameter Ledger
axioms (4)
- domain assumption Epistemic and aleatory uncertainty (Fox & Ülkümen) can be mapped onto users' perceived ability to predict system behavior, with an additional non-additive 'effective' facet.
- standard math Standard classical test theory and CFA assumptions (items reflect latent factors, local independence, etc.) hold for the collected Likert responses.
- domain assumption MTurk participants from US/AU/UK provide usable data for construct validation of a general interactive-system perception scale.
- ad hoc to paper A transparent rule-based sentiment classifier is a sufficient first test bed for a model-agnostic perception construct.
invented entities (1)
-
Perceived System Predictability (PSP) construct with three facets (epistemic, aleatory, effective)
no independent evidence
read the original abstract
How predictable users perceive an interactive system to be shapes how they interpret, trust, and rely on it, yet HCI lacks both a precise conceptualization and a validated instrument for this perception. We address this gap by introducing perceived system predictability (PSP) as a user-centered construct grounded in uncertainty theory, distinguishing epistemic, aleatory, and effective predictability. We contribute (i) a theoretical framework that situates PSP relative to adjacent constructs such as trust and understanding, (ii) a 6-item PSP scale, derived from a 60-item pool through expert review and cognitive interviews, and validated in a shape-classifier study ($N=200$) that supports both a unidimensional and a three-factor hierarchical structure, and (iii) a sentiment-classifier study ($N=200$) that varies explanations and stochasticity, and relates PSP to the correctness of users' predictions of system behavior, trust, subjective information processing awareness, and need for cognition. We find that PSP and prediction correctness capture distinct aspects of users' mental models and that both can diverge: PSP itself predicts correctness, explanations shift PSP but not correctness, and increased stochasticity degrades correctness without lowering PSP. PSP thus goes beyond existing objective and subjective measures and offers a principled foundation for designing transparent and trustworthy interactive systems.
Figures





Reference graph
Works this paper leans on
-
[1]
Gene M. Alarcon, August A. Capiola, Michael A. Lee, Sasha M. Willis, Izz Aldin Hamdan, Sarah A. Jessup, and Krista N. Harris. 2024. Development and Validation of the System Trustworthiness Scale.Hum. Factors66, 7 (2024), 1893–1913. https://doi.org/10.1177/00187208231189000
-
[2]
Stefano Baccianella, Andrea Esuli, and Fabrizio Sebastiani. 2010. SentiWordNet 3.0: An Enhanced Lexical Resource for Sentiment Analysis and Opinion Mining. InProceedings of the Seventh International Conference on Language Resources and Evaluation (LREC’10). European Language Resources Association (ELRA), Valletta, Malta. http://www.lrec-conf.org/proceedin...
2010
-
[3]
Gagan Bansal, Tongshuang Wu, Joyce Zhou, Raymond Fok, Besmira Nushi, Ece Kamar, Marco Túlio Ribeiro, and Daniel S. Weld. 2021. Does the Whole Exceed its Parts? The Effect of AI Explanations on Complementary Team Performance. InCHI ’21: CHI Conference on Human Factors in Computing Systems, Virtual Event / Yokohama, Japan, May 8-13, 2021, Yoshifumi Kitamura...
-
[4]
Javier A Bargas-Avila and Florian Brühlmann. 2016. Measuring user rated language quality: development and validation of the user interface Language Quality Survey (LQS).International Journal of Human-Computer Studies86 (2016), 1–10
2016
-
[5]
Paul C Beatty and Gordon B Willis. 2007. Research synthesis: The practice of cognitive interviewing.Public opinion quarterly71, 2 (2007), 287–311
2007
-
[6]
Or Biran and Kathleen R. McKeown. 2017. Human-Centric Justification of Machine Learning Predictions. InProceedings of the Twenty-Sixth International Joint Conference on Artificial Intelligence, IJCAI 2017, Melbourne, Australia, August 19-25, 2017, Carles Sierra (Ed.). ijcai.org, 1461–1467. https://doi.org/10.24963/ijcai.2017/202 26 Schuff, Adel, and Vu
-
[7]
Godfred O. Boateng, Torsten B. Neilands, Edward A. Frongillo, Hugo R. Melgar-Quiñonez, and Sera L. Young. 2018. Best Practices for Developing and Validating Scales for Health, Social, and Behavioral Research: A Primer.Frontiers in Public Health6 (2018), 149. https://doi.org/10.3389/fpubh. 2018.00149
doi:10.3389/fpubh 2018
-
[8]
Bowling, Jason L
Nathan A. Bowling, Jason L. Huang, Cheyna K. Brower, and Caleb B. Bragg. 2021. The Quick and the Careless: The Construct Validity of Page Time as a Measure of Insufficient Effort Responding to Surveys.Organizational Research Methods26 (2021), 323 – 352
2021
-
[9]
John Brooke. 1996. SUS: a “quick and dirty’usability.Usability evaluation in industry(1996), 189
1996
-
[10]
Zana Buçinca, Phoebe Lin, Krzysztof Z. Gajos, and Elena L. Glassman. 2020. Proxy tasks and subjective measures can be misleading in evaluating explainable AI systems. InIUI ’20: 25th International Conference on Intelligent User Interfaces, Cagliari, Italy, March 17-20, 2020, Fabio Paternò, Nuria Oliver, Cristina Conati, Lucio Davide Spano, and Nava Tintar...
-
[11]
Zana Buçinca, Maja Barbara Malaya, and Krzysztof Z. Gajos. 2021. To Trust or to Think: Cognitive Forcing Functions Can Reduce Overreliance on AI in AI-assisted Decision-making.Proc. ACM Hum. Comput. Interact.5, CSCW1 (2021), 188:1–188:21. https://doi.org/10.1145/3449287
doi:10.1145/3449287 2021
-
[12]
Adrian Bussone, Simone Stumpf, and Dympna O’Sullivan. 2015. The Role of Explanations on Trust and Reliance in Clinical Decision Support Systems. In2015 International Conference on Healthcare Informatics, ICHI 2015, Dallas, TX, USA, October 21-23, 2015, Prabhakaran Balakrishnan, Jaideep Srivatsava, Wai-Tat Fu, Sanda M. Harabagiu, and Fei Wang (Eds.). IEEE ...
-
[13]
Chris Callison-Burch, Miles Osborne, and Philipp Koehn. 2006. Re-evaluating the Role of Bleu in Machine Translation Research. In11th Conference of the European Chapter of the Association for Computational Linguistics. Association for Computational Linguistics, Trento, Italy, 249–256. https://aclanthology.org/E06-1032
2006
-
[14]
Colleen M. Carpinella, Alisa B. Wyman, Michael A. Perez, and Steven J. Stroessner. 2017. The Robotic Social Attributes Scale (RoSAS): Development and Validation. InProceedings of the 2017 ACM/IEEE International Conference on Human-Robot Interaction. ACM, Vienna Austria, 254–262. https: //doi.org/10.1145/2909824.3020208
-
[15]
Wm Casper, Bryan D Edwards, J Craig Wallace, Ronald S Landis, Dustin A Fife, et al. 2020. Selecting response anchors with equal intervals for summated rating scales.Journal of Applied Psychology105, 4 (2020), 390
2020
-
[16]
Eric Chu, Deb Roy, and Jacob Andreas. 2020. Are Visual Explanations Useful? A Case Study in Model-in-the-Loop Prediction.CoRRabs/2007.12248 (2020). arXiv:2007.12248 https://arxiv.org/abs/2007.12248
work page internal anchor Pith review Pith/arXiv arXiv 2020
-
[17]
Julien Colin, Thomas Fel, Rémi Cadène, and Thomas Serre. 2022. What I Cannot Predict, I Do Not Understand: A Human-Centered Evaluation Framework for Explainability Methods. InAdvances in Neural Information Processing Systems 35: Annual Conference on Neural Information Processing Systems 2022, NeurIPS 2022, New Orleans, LA, USA, November 28 - December 9, 2...
2022
-
[18]
Henriette S. M. Cramer, Vanessa Evers, Satyan Ramlal, Maarten van Someren, Lloyd Rutledge, Natalia Stash, Lora Aroyo, and Bob J. Wielinga. 2008. The effects of transparency on trust in and acceptance of a content-based art recommender.User Model. User Adapt. Interact.18, 5 (2008), 455–496. https://doi.org/10.1007/s11257-008-9051-3
-
[19]
Lee Joseph Cronbach. 1951. Coefficient alpha and the internal structure of tests.Psychometrika16 (1951), 297–334
1951
-
[20]
Mary Czerwinski, Eric Horvitz, and Edward Cutrell. 2001. Subjective duration assessment: An implicit probe for software usability. InProceedings of IHM-HCI 2001 conference, Vol. 2. 167–170
2001
-
[21]
Gabriel Lins de Holanda Coelho, Paul H. P. Hanel, and Lukas J Wolf. 2018. The Very Efficient Assessment of Need for Cognition: Developing a Six-Item Version*.Assessment27 (2018), 1870 – 1885
2018
-
[22]
John P. Deegan. 1978. On the Occurrence of Standardized Regression Coefficients Greater Than One.Educational and Psychological Measurement38 (1978), 873 – 888
1978
-
[23]
McCarty, Kelly Miller, Kristina Callaghan, and Greg Kestin
Louis Deslauriers, Logan S. McCarty, Kelly Miller, Kristina Callaghan, and Greg Kestin. 2019. Measuring actual learning versus feeling of learning in response to being actively engaged in the classroom.Proceedings of the National Academy of Sciences116, 39 (2019), 19251–19257. https://doi.org/10.1073/pnas.1821936116 arXiv:https://www.pnas.org/doi/pdf/10.1...
-
[24]
2021.Scale development: Theory and applications
Robert F DeVellis and Carolyn T Thorpe. 2021.Scale development: Theory and applications. Sage publications
2021
-
[25]
Birk Diedenhofen and Jochen Musch. 2015. cocor: A Comprehensive Solution for the Statistical Comparison of Correlations.PLoS ONE10 (2015)
2015
-
[26]
Karen Dunn and Gareth McCray. 2020. The Place of the Bifactor Model in Confirmatory Factor Analysis Investigations Into Construct Dimensionality in Language Testing.Frontiers in Psychology11 (2020)
2020
-
[27]
Olive Jean Dunn and Virginia A. Clark. 1969. Correlation Coefficients Measured on the Same Individuals.J. Amer. Statist. Assoc.64 (1969), 366–377
1969
-
[28]
Rob Eisinga, Manfred te Grotenhuis, and Ben Pelzer. 2013. The reliability of a two-item scale: Pearson, Cronbach, or Spearman-Brown?International Journal of Public Health58 (2013), 637–642
2013
-
[29]
Hannes Eisler. 1976. Experiments on subjective duration 1868-1975: A collection of power function exponents.Psychological Bulletin83, 6 (1976), 1154
1976
-
[30]
Mica R Endsley. 1988. Situation awareness global assessment technique (SAGAT). InProceedings of the IEEE 1988 national aerospace and electronics conference. IEEE, 789–795
1988
-
[31]
Shi Feng and Jordan L. Boyd-Graber. 2019. What can AI do for me?: evaluating machine learning interpretations in cooperative play. InProceedings of the 24th International Conference on Intelligent User Interfaces, IUI 2019, Marina del Ray, CA, USA, March 17-20, 2019, Wai-Tat Fu, Shimei Pan, Oliver Brdiczka, Polo Chau, and Gaelle Calvary (Eds.). ACM, 229–2...
-
[32]
Kraig Finstad. 2010. The usability metric for user experience.Interacting with Computers22, 5 (2010), 323–327. Perceived System Predictability: Scale Development and Application 27
2010
-
[33]
Kraig Finstad. 2013. Response to commentaries on ’The Usability Metric for User Experience’.Interact. Comput.25, 4 (2013), 327–330. https: //doi.org/10.1093/iwc/iwt005
-
[34]
Courtney Ford, Eoin M. Kenny, and Mark T. Keane. 2020. Play MNIST For Me! User Studies on the Effects of Post-Hoc, Example-Based Explanations & Error Rates on Debugging a Deep Learning, Black-Box Classifier.CoRRabs/2009.06349 (2020). arXiv:2009.06349 https://arxiv.org/abs/2009.06349
work page internal anchor Pith review Pith/arXiv arXiv 2020
-
[35]
Distinguishing Two Dimensions of Uncertainty,
Craig R Fox and Gülden Ülkümen. 2011. Distinguishing two dimensions of uncertainty.Fox, Craig R. and Gülden Ülkümen (2011), “Distinguishing Two Dimensions of Uncertainty, ” in Essays in Judgment and Decision Making, Brun, W., Kirkebøen, G. and Montgomery, H., eds. Oslo: Universitetsforlaget (2011)
2011
-
[36]
Krems, Viktoria Zott, and Andreas Keinath
Thomas Franke, Maria Trantow, Madlen Günther, Josef F. Krems, Viktoria Zott, and Andreas Keinath. 2015. Advancing electric vehicle range displays for enhanced user experience: the relevance of trust and adaptability. InProceedings of the 7th International Conference on Automotive User Interfaces and Interactive Vehicular Applications, AutomotiveUI 2015, N...
-
[37]
2022.Psychometrics: an introduction
R Michael Furr. 2022.Psychometrics: an introduction. SAGE publications
2022
-
[38]
Ana Valeria Gonzalez, Anna Rogers, and Anders Søgaard. 2021. On the Interaction of Belief Bias and Explanations. InFindings of the Association for Computational Linguistics: ACL/IJCNLP 2021, Online Event, August 1-6, 2021 (Findings of ACL, Vol. ACL/IJCNLP 2021), Chengqing Zong, Fei Xia, Wenjie Li, and Roberto Navigli (Eds.). Association for Computational ...
-
[39]
Yash Goyal, Ziyan Wu, Jan Ernst, Dhruv Batra, Devi Parikh, and Stefan Lee. 2019. Counterfactual Visual Explanations. InProceedings of the 36th International Conference on Machine Learning, ICML 2019, 9-15 June 2019, Long Beach, California, USA (Proceedings of Machine Learning Research, Vol. 97), Kamalika Chaudhuri and Ruslan Salakhutdinov (Eds.). PMLR, 23...
2019
-
[40]
Ben Green and Yiling Chen. 2019. The Principles and Limits of Algorithm-in-the-Loop Decision Making.Proc. ACM Hum. Comput. Interact.3, CSCW (2019), 50:1–50:24. https://doi.org/10.1145/3359152
doi:10.1145/3359152 2019
-
[41]
Jonathan Grudin and Allan MacLean. 1985. Adapting A Psychophysical Method To Measure Performance And Preference Tradeoffs In Human- Computer Interaction. InHuman-Computer Interaction - INTERACT ’84(human-computer interaction - interact ’84 ed.). Elsevier Science Publishers B.V. (North-Holland), 737–741. https://www.microsoft.com/en-us/research/publication...
1985
-
[42]
Felix Haag. 2025. The Effect of Explainable AI-based Decision Support on Human Task Performance: A Meta-Analysis
2025
-
[43]
Sandra G Hart and Lowell E Staveland. 1988. Development of NASA-TLX (Task Load Index): Results of empirical and theoretical research. In Advances in psychology. Vol. 52. Elsevier, 139–183
1988
-
[44]
Peter Hase and Mohit Bansal. 2020. Evaluating Explainable AI: Which Algorithmic Explanations Help Users Predict Model Behavior?. In Proceedings of the 58th Annual Meeting of the Association for Computational Linguistics. Association for Computational Linguistics, Online, 5540–5552. https://doi.org/10.18653/v1/2020.acl-main.491
-
[45]
Jonathan L. Herlocker, Joseph A. Konstan, and John Riedl. 2000. Explaining collaborative filtering recommendations. InCSCW 2000, Proceeding on the ACM 2000 Conference on Computer Supported Cooperative Work, Philadelphia, PA, USA, December 2-6, 2000, Wendy A. Kellogg and Steve Whittaker (Eds.). ACM, 241–250. https://doi.org/10.1145/358916.358995
-
[46]
Kasper Hornbæk. 2006. Current practice in measuring usability: Challenges to usability studies and research.International Journal of Human- Computer Studies64, 2 (2006), 79–102. https://doi.org/10.1016/j.ijhcs.2005.06.002
-
[47]
Li-tze Hu and Peter M. Bentler. 1999. Cutoff criteria for fit indexes in covariance structure analysis : Conventional criteria versus new alternatives. Structural Equation Modeling6 (1999), 1–55
1999
-
[48]
Alon Jacovi, Hendrik Schuff, Heike Adel, Ngoc Thang Vu, and Yoav Goldberg. 2023. Neighboring Words Affect Human Interpretation of Saliency Explanations. InFindings of the Association for Computational Linguistics: ACL 2023, Anna Rogers, Jordan Boyd-Graber, and Naoaki Okazaki (Eds.). Association for Computational Linguistics, Toronto, Canada, 11816–11833. ...
-
[49]
Karl G Jöreskog. 1999. How large can a standardized coefficient be. (1999)
1999
-
[50]
Jorgensen, Sunthud Pornprasertmanit, Alexander M
Terrence D. Jorgensen, Sunthud Pornprasertmanit, Alexander M. Schoemann, and Yves Rosseel. 2022. semTools: Useful tools for structural equation modeling. https://CRAN.R-project.org/package=semTools R package version 0.5-6
2022
-
[51]
Hyun Seung Kang, Jeayeong Ji, Yeji Yun, and Kwang Hee Han. 2021. Estimating Bar Graph Averages: Overcoming Within-the-Bar Bias.i-Perception 12 (2021)
2021
-
[52]
Anjali Khurana, Parsa Alamzadeh, and Parmit K. Chilana. 2021. ChatrEx: Designing Explainable Chatbot Interfaces for Enhancing Usefulness, Transparency, and Trust. InIEEE Symposium on Visual Languages and Human-Centric Computing, VL/HCC 2021, St Louis, MO, USA, October 10-13, 2021, Kyle J. Harms, Jácome Cunha, Steve Oney, and Caitlin Kelleher (Eds.). IEEE,...
Pith/arXiv arXiv 2021
-
[53]
Jenia Kim, Henry Maathuis, and Danielle Sent. 2024. Human-centered evaluation of explainable AI applications: a systematic review.Frontiers Artif. Intell.7 (2024). https://doi.org/10.3389/FRAI.2024.1456486
-
[54]
Matthias Kirchler, Martin Graf, Marius Kloft, and Christoph Lippert. 2021. Explainability Requires Interactivity.CoRRabs/2109.07869 (2021). arXiv:2109.07869 https://arxiv.org/abs/2109.07869
work page internal anchor Pith review Pith/arXiv arXiv 2021
-
[55]
Moritz Körber. 2018. Theoretical considerations and development of a questionnaire to measure trust in automation. InCongress of the International Ergonomics Association. Springer, 13–30
2018
-
[56]
Vivian Lai, Han Liu, and Chenhao Tan. 2020. "Why is ’Chicago’ deceptive?" Towards Building Model-Driven Tutorials for Humans. InCHI ’20: CHI Conference on Human Factors in Computing Systems, Honolulu, HI, USA, April 25-30, 2020, Regina Bernhaupt, Florian ’Floyd’ Mueller, David Verweij, 28 Schuff, Adel, and Vu Josh Andres, Joanna McGrenere, Andy Cockburn, ...
-
[57]
Vivian Lai and Chenhao Tan. 2019. On Human Predictions with Explanations and Predictions of Machine Learning Models: A Case Study on Deception Detection. InProceedings of the Conference on Fairness, Accountability, and Transparency, FAT* 2019, Atlanta, GA, USA, January 29-31, 2019, danah boyd and Jamie H. Morgenstern (Eds.). ACM, 29–38. https://doi.org/10...
-
[58]
James R. Lewis. 2018. Measuring Perceived Usability: The CSUQ, SUS, and UMUX.International Journal of Human–Computer Interaction34 (2018), 1148 – 1156
2018
-
[59]
Qingyu Liang and Jaime Banks. 2025. Perceived shared understanding between humans and artificial intelligence: Development and validation of a self-report scale.Technology, Mind, and Behavior(2025)
2025
-
[60]
Q Vera Liao, Yunfeng Zhang, Ronny Luss, Finale Doshi-Velez, and Amit Dhurandhar. 2022. Connecting Algorithmic Research and Usage Contexts: A Perspective of Contextualized Evaluation for Explainable AI. InProceedings of the AAAI Conference on Human Computation and Crowdsourcing, Vol. 10. 147–159
2022
-
[61]
Chia-Wei Liu, Ryan Lowe, Iulian Serban, Mike Noseworthy, Laurent Charlin, and Joelle Pineau. 2016. How NOT To Evaluate Your Dialogue System: An Empirical Study of Unsupervised Evaluation Metrics for Dialogue Response Generation. InProceedings of the 2016 Conference on Empirical Methods in Natural Language Processing. Association for Computational Linguist...
-
[62]
Lundberg, Bala G
Scott M. Lundberg, Bala G. Nair, Monica S. Vavilala, Mayumi Horibe, Michael J. Eisses, Trevor Adams, David Liston, Daniel King-Wai Low, Shu-Fang Newman, Jerry H. Kim, and Su-In Lee. 2018. Explainable machine-learning predictions for the prevention of hypoxaemia during surgery.Nature biomedical engineering2 (2018), 749 – 760
2018
-
[63]
2023.sjPlot: Data Visualization for Statistics in Social Science
Daniel Lüdecke. 2023.sjPlot: Data Visualization for Statistics in Social Science. https://CRAN.R-project.org/package=sjPlot R package version 2.8.14
2023
-
[64]
A MacLean, PJ Barnard, and MD Wilson. 1985. Evaluating the human interface of a data entry system: user choice and performance measures yield different tradeoff functions.People and computers: Designing the interface5, 7 (1985), 45–61
1985
-
[65]
Andreas Madsen, Siva Reddy, and Sarath Chandar. 2023. Post-hoc Interpretability for Neural NLP: A Survey.ACM Comput. Surv.55, 8 (2023), 155:1–155:42. https://doi.org/10.1145/3546577
doi:10.1145/3546577 2023
-
[66]
Mcdonald
Roderick P. Mcdonald. 1999. Test Theory: A Unified Treatment
1999
-
[67]
N Menold and K Bogner. 2016. Design of rating scales in questionnaires.GESIS survey guidelines4 (2016)
2016
-
[68]
Newman and Brian J
George E. Newman and Brian J. Scholl. 2012. Bar graphs depicting averages are perceptually misinterpreted: The within-the-bar bias.Psychonomic Bulletin & Review19 (2012), 601–607
2012
- [69]
-
[70]
Mahsan Nourani, Samia Kabir, Sina Mohseni, and Eric D. Ragan. 2019. The Effects of Meaningful and Meaningless Explanations on Trust and Perceived System Accuracy in Intelligent Systems.Proceedings of the AAAI Conference on Human Computation and Crowdsourcing7, 1 (Oct. 2019), 97–105. https://ojs.aaai.org/index.php/HCOMP/article/view/5284
2019
-
[71]
Jekaterina Novikova, Ondřej Dušek, Amanda Cercas Curry, and Verena Rieser. 2017. Why We Need New Evaluation Metrics for NLG. InProceedings of the 2017 Conference on Empirical Methods in Natural Language Processing. Association for Computational Linguistics, Copenhagen, Denmark, 2241–2252. https://doi.org/10.18653/v1/D17-1238
-
[72]
Forough Poursabzi-Sangdeh, Daniel G. Goldstein, Jake M. Hofman, Jennifer Wortman Vaughan, and Hanna M. Wallach. 2021. Manipulating and Measuring Model Interpretability. InCHI ’21: CHI Conference on Human Factors in Computing Systems, Virtual Event / Yokohama, Japan, May 8-13, 2021, Yoshifumi Kitamura, Aaron Quigley, Katherine Isbister, Takeo Igarashi, Per...
-
[73]
Tenko Raykov. 2001. Estimation of congeneric scale reliability using covariance structure analysis with nonlinear constraints.The British journal of mathematical and statistical psychology54 Pt 2 (2001), 315–23
2001
-
[74]
Ehud Reiter. 2018. A Structured Review of the Validity of BLEU.Computational Linguistics44, 3 (Sept. 2018), 393–401. https://doi.org/10.1162/coli _a_00322
doi:10.1162/coli 2018
-
[75]
2022.psych: Procedures for Psychological, Psychometric, and Personality Research
William Revelle. 2022.psych: Procedures for Psychological, Psychometric, and Personality Research. Northwestern University, Evanston, Illinois. https://CRAN.R-project.org/package=psych R package version 2.2.9
2022
-
[76]
Mireia Ribera and Àgata Lapedriza. 2019. Can we do better explanations? A proposal of user-centered explainable AI. InJoint Proceedings of the ACM IUI 2019 Workshops co-located with the 24th ACM Conference on Intelligent User Interfaces (ACM IUI 2019), Los Angeles, USA, March 20, 2019 (CEUR Workshop Proceedings, Vol. 2327), Christoph Trattner, Denis Parra...
2019
-
[77]
Delphine Ribes, Nicolas Henchoz, Hélène Portier, Lara Défayes, Thanh-Trung Phan, Daniel Gatica-Perez, and Andreas Sonderegger. 2021. Trust Indicators and Explainable AI: A Study on User Perceptions. InHuman-Computer Interaction - INTERACT 2021 - 18th IFIP TC 13 International Conference, Bari, Italy, August 30 - September 3, 2021, Proceedings, Part II (Lec...
-
[78]
Leon Rozenblit and Frank C. Keil. 2002. The misunderstood limits of folk science: an illusion of explanatory depth.Cognitive science26 5 (2002), 521–562. Perceived System Predictability: Scale Development and Application 29
2002
-
[79]
Heleen Rutjes, Martijn Willemsen, and Wijnand IJsselsteijn. 2019. Considerations on explainable AI and users’ mental models. InWhere is the Human? Bridging the Gap Between AI and HCI. Association for Computing Machinery, Inc, United States. CHI 2019 Workshop : Where is the Human? Bridging the Gap Between AI and HCI ; Conference date: 04-05-2019 Through 04-05-2019
2019
-
[80]
Viktor Schlegel, Erick Mendez Guzman, and Riza Batista-Navarro. 2022. Towards Human-Centred Explainability Benchmarks For Text Classification. InWorkshop Proceedings of the 16th International AAAI Conference on Web and Social Media, ICWSM 2022 Workshops, Atlanta, Georgia, USA [hybrid], June 6, 2022, Pedro O. S. Vaz de Melo, Wei Jeng, and Cody Buntain (Eds...
discussion (0)
Sign in with ORCID, Apple, or X to comment. Anyone can read and Pith papers without signing in.