REVIEW 3 major objections 6 minor 11 references
Reviewed by Pith at T0; open to challenge.
T0 means a machine referee read the full paper against a public rubric. The mark states how deep the mechanical check went, never who wrote it. the ladder, T0–T4 →
T0 review · glm-5.2
Risk-Adjusted ETF Rotation Beats QQQ on Sharpe in Every Tested Window
2026-07-08 15:55 UTC pith:OPDTE6OK
load-bearing objection Two-ETF rotation rule with genuine walk-forward validation, but the third-order selection layer is circular and the signal universe has look-ahead bias. the 3 major comments →
Relief-Gated Relative Rotation for QQQ-DIA Allocation: Globally Screened Relative States, Fixed Position Mapping, Incremental Interaction Admission, and Walk-Forward Validation
The pith
A machine-rendered reading of the paper's core claim, the machinery that carries it, and where it could break.
Core claim
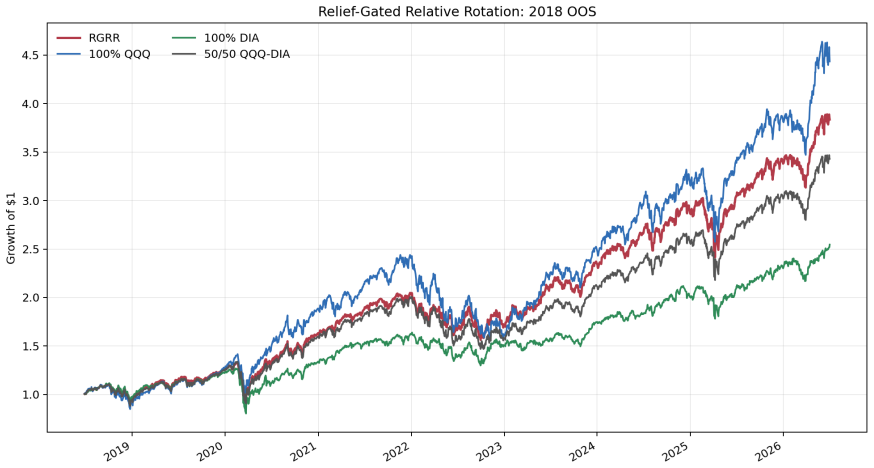
The central discovery is that the naive intuition 'DIA catches up when QQQ stalls' is too simple to trade directly. Instead, relative reversal between QQQ and DIA only carries predictive value for allocation when gated by specific macroeconomic relief conditions—falling interest rates and broad market drawdowns. By building a score from these conditional interactions and mapping it to a continuous QQQ weight, the strategy achieves a higher Sharpe ratio than 100% QQQ in every tested out-of-sample window, though it only beats QQQ on raw return (CAGR) in the 2022 rising-rate stress window.
What carries the argument
Relief-Gated Relative Rotation (RGRR): A two-ETF allocation rule that combines one main effect, nine second-order interactions, and two third-order interactions into a single score, mapped through a fixed bounded nonlinear transformation (tanh) to produce a continuous QQQ weight between 0% and 100%. The signal universe is fixed via global HAC regression screening, while walk-forward validation re-selects only the combination weights (lambdas) on these admitted signal families.
Load-bearing premise
The entire signal universe is selected using regressions that include data from the out-of-sample periods, and the walk-forward loop only re-weights these pre-selected signals rather than testing whether the signals themselves survive out-of-sample. With hundreds of candidate interactions generated from nine raw variables, the |t|≥2.0 screening threshold is not a multiple-testing correction, so the out-of-sample validation rests on the premise that the in-sample-screened信号的持續
What would settle it
If a proper multiple-testing correction (e.g., White Reality Check or Deflated Sharpe Ratio) applied to the full search process eliminates the Sharpe improvement over 100% QQQ, or if the signal universe fails to generalize to other growth-versus-value ETF pairs, the core risk-adjusted allocation claim would be falsified.
Editorial analysis
A structured set of objections, weighed in public.
Referee Report
Summary. The paper proposes Relief-Gated Relative Rotation (RGRR), a two-ETF allocation rule between QQQ and DIA. The method maps screened relative and macro state variables into a continuous QQQ weight. Candidate main effects and interactions are screened via horizon-specific HAC regressions and correlation de-duplication. The final stack contains one main effect, nine second-order interactions, and two third-order interactions. Walk-forward validation re-selects only signal-family lambdas on the admitted groups, while holding the signal universe and position mapping parameters (M=0.50, τ=0.75, η=0.05) fixed. The author reports that RGRR improves the Sharpe ratio versus 100% QQQ and 50/50 QQQ-DIA across the 2018, 2020, and 2022 out-of-sample windows, though it beats QQQ on CAGR only in the 2022 window. The paper explicitly frames the result as a risk-adjusted improvement rather than a return-dominance rule, and acknowledges high turnover (354%-506% annualized) and the absence of formal multiple-testing corrections as limitations.
Significance. The paper tackles a well-defined asset allocation problem with a transparent, rule-based methodology. The walk-forward validation framework, which separates the fixed signal universe from the adaptive lambda selection, is a sensible approach to preventing the strategy from dynamically re-fitting its economic vocabulary. The provision of a replication package (GitHub repository) and the inclusion of an experiment lineage documenting rejected alternatives are commendable practices that enhance auditability. The bounded framing of the empirical claim (risk-adjusted improvement, not return dominance) is appropriate given the strength of the QQQ benchmark during the sample period.
major comments (3)
- §8.1 (Third-Order Admission Rule): The third-order incremental filter selects retained terms using the same 2018, 2020, and 2022 OOS windows that are subsequently reported as the final validation results in Table 15. Specifically, criterion (2) requires candidates to 'improve rolling OOS Sharpe versus the main+ix2 base policy on average across the 2018, 2020, and 2022 OOS screen periods,' and criterion (3) requires 'positive Sharpe delta in at least two of the three screen periods.' Because these screen periods are identical to the final evaluation windows, the two retained third-order terms (Table 12) are selected based on their performance on the same data presented as out-of-sample validation. This creates a circularity in the headline RGRR Sharpe improvements. The incremental Sharpe contribution of the third-order layer is small (Table 26: ∆Sharpe of 0.018, 0.023, 0.028 for 2018/2020
- §4 (Eq. 3) and §6 (Table 9): The global HAC screen used to select the signal universe (main and second-order terms) and the fixed mapping parameters (M, τ, η) both use full-sample data, including the OOS periods. The walk-forward loop only re-selects lambdas on already-admitted signals. While the paper acknowledges the absence of a White Reality Check or Deflated Sharpe Ratio, the current validation structure does not test whether the signals themselves survive out-of-sample. With 9 raw state variables generating hundreds of interaction candidates, the |t|≥2.0 threshold with 0.95 correlation de-duplication is not a multiple-testing correction. The central claim of OOS Sharpe improvement rests on the premise that the in-sample-screened signal universe contains genuine predictive structure. The main+IX2 base policy (Table 11) does improve Sharpe versus QQQ in all three windows (0.93, 0.91,
- 0.84 vs. 0.89, 0.90, 0.70), providing partial support for the central claim even if the third-order layer is discounted. However, the full-sample selection of the lower-order signals and mapping parameters means the OOS test is not fully independent of the selection process. The paper should either (a) restrict the HAC screen and mapping parameter selection to pre-OOS data only, or (b) explicitly re-label the 2018/2020/2022 results as 'in-sample-screened, lambda-OOS' to avoid overstating the independence of the validation.
minor comments (6)
- Table 2: The data coverage extends to 2026-07-02, and the OOS starts include 2022. The 2022 OOS window therefore covers approximately 4.5 years, which is substantial. The paper should clarify the exact end date of the evaluation period for reproducibility.
- Table 5: The static baselines are reported over the full 2008-07-25 to 2026-07-02 sample. It would be useful to also report baseline statistics for the specific OOS windows (2018, 2020, 2022) to provide context for the RGRR results in those periods.
- §3 (Eq. 1): The Sharpe ratios are stated to use 'raw daily returns rather than excess returns over the risk-free rate.' This is a non-standard definition. The paper should note this clearly in the tables or footnotes to avoid confusion for readers expecting excess-return Sharpe ratios.
- Table 9: The top fixed-mapping sensitivity rows all show nearly identical Sharpe ratios (0.91 or 0.90). The paper states the selected mapping is 'not the most conservative' but does not explain why this specific row was chosen over others with equivalent performance. A brief justification would strengthen the rationale.
- §A.3 (Table 22): The complete globally screened interaction set lists 26 third-order interactions with |t|≥2.0. Given the concern about multiple testing, it would be informative to report how many total third-order candidates were tested before the screen, to give readers a sense of the search space size.
- The references to Xiong(2026a) and Xiong(2026b) are cited as the basis for the empirical discipline. As these appear to be the author's own prior work, the paper should ensure the relationship between this manuscript and those prior studies is clearly delineated, particularly regarding any overlap in methodology or data.
Simulated Author's Rebuttal
The referee raises two interconnected concerns about the independence of the out-of-sample validation. First, the third-order incremental admission filter (§8.1) uses the same 2018/2020/2022 windows that appear as final results in Table 15, creating circularity for the third-order layer's Sharpe contribution. Second, the global HAC screen and fixed mapping parameters (M, τ, η) use full-sample data including OOS periods, so the lower-order signal universe and position mapping are not independently validated. We agree with both points and will revise the manuscript accordingly: (1) we will re-label the validation as 'in-sample-screened, lambda-OOS' throughout, and (2) we will restructure the third-order admission to use only pre-OOS data or explicitly flag the circularity. The referee's acknowledgment that the main+IX2 base policy already improves Sharpe versus QQQ in all three windows is an important partial support that we will emphasize more clearly. We cannot fully resolve the circularity without a different sample design, which is an honest limitation we will state explicitly.
read point-by-point responses
-
Referee: §8.1 (Third-Order Admission Rule): The third-order incremental filter selects retained terms using the same 2018, 2020, and 2022 OOS windows that are subsequently reported as the final validation results in Table 15. This creates a circularity in the headline RGRR Sharpe improvements.
Authors: The referee is correct. The third-order incremental admission criteria (§8.1, criteria 2 and 3) evaluate candidate terms on the same 2018, 2020, and 2022 OOS windows that later appear as the final validation results in Table 15. This is a genuine circularity: the two retained third-order terms were selected partly because they performed well on the exact data presented as out-of-sample evidence. We cannot defend this as independent validation. The incremental Sharpe contribution of the third-order layer is small (Table 26: ΔSharpe of 0.018, 0.023, 0.028 for 2018/2020/2022), which is consistent with the referee's implicit point that the circularity may not be driving the main result, but it is still a methodological flaw that must be corrected. We will make two changes. First, we will re-label the third-order results throughout the paper to explicitly state that the third-order admission filter uses the same windows as the final evaluation, so the third-order Sharpe contribution is not independently validated. Second, we will restructure the third-order admission to use only pre-2018 data for the incremental screen where possible, or alternatively restrict the third-order screen to the 2008-start rolling path (which is not used as a primary screen window). If neither approach yields a clean separation given the available data, we will state this as a standing limitation and recommend that the main+IX2 base policy (Table 11) be treated as the independently validated result, with the third-order layer as an exploratory refinement. The referee's observation that the main+IX2 base already improves Sharpe versus QQQ in all three windows (0.93, 0.91, 0.84 vs. 0.89, 0.90, 0.70) is the result that carries the strongest validation claim, and we will restructure the paper to make这 revision: yes
-
Referee: §4 (Eq. 3) and §6 (Table 9): The global HAC screen used to select the signal universe and the fixed mapping parameters both use full-sample data, including the OOS periods. The walk-forward loop only re-selects lambdas on already-admitted signals. The paper should either (a) restrict the HAC screen and mapping parameter selection to pre-OOS data only, or (b) explicitly re-label the results as 'in-sample-screened, lambda-OOS'.
Authors: The referee is correct on both points. The global HAC screen (Eq. 3, §4) uses the full sample including all OOS periods to select the signal universe (one main effect, nine second-order interactions). The fixed mapping parameters (M=0.50, τ=0.75, η=0.05) were also selected using full-sample rolling sensitivity (Table 9), which includes OOS data. The walk-forward loop only re-selects lambdas on already-admitted signal groups. This means the OOS test is not fully independent of the selection process. The |t|≥2.0 threshold with 0.95 correlation de-duplication is a pragmatic filter, not a multiple-testing correction, as the referee notes and as the paper already acknowledges in §13. We accept the referee's option (b) as the appropriate immediate revision: we will explicitly re-label the 2018/2020/2022 results as 'in-sample-screened, lambda-OOS' throughout the manuscript—in the abstract, in Table 15, in §10, and in the conclusion. This re-labeling will make the validation structure transparent and prevent any reader from interpreting the results as fully independent OOS evidence. Regarding option (a), restricting the HAC screen and mapping selection to pre-OOS data only is methodologically preferable but requires a different sample structure: the 2008-start rolling path has a 756-day warmup ending in mid-2009, leaving limited pre-2018 data for an independent screen. We will note this as a limitation and identify it as a priority for the next iteration. The referee's acknowledgment that the main+IX2 base policy provides partial support for the central claim even if the third-order layer is discounted is important: we will restructure the empirical narrative so that the main+IX2 base (Table 11) is presented as the primary validated result, with the full RGRR stack as a refin revision: yes
- We cannot fully eliminate the circularity in the third-order admission filter without a fundamentally different sample design. The 2018, 2020, and 2022 OOS windows are the only available evaluation periods, and using them both for admission screening and final validation is structurally circular. Restructuring to use only pre-2018 data for the third-order screen is possible in principle but would leave very few candidate evaluation windows for the final result. We will be transparent about this limitation in the revised manuscript.
Circularity Check
Third-order terms selected on the same OOS windows later reported as validation; signal universe and mapping parameters fixed in-sample with no multiple-testing correction.
full rationale
The paper has two layers of partial circularity. First, the third-order incremental filter (§8.1) explicitly selects retained terms using Sharpe performance on the 2018, 2020, and 2022 OOS windows, then reports those same windows as final validation results in Table 15. The two retained third-order terms survive because they improved Sharpe on the exact data presented as out-of-sample evidence. Second, the signal universe (main + second-order) is selected via full-sample HAC regressions (§4) and the mapping parameters (M, τ, η) are fixed via a global sensitivity experiment (§6, Table 9) using full-sample data; the walk-forward loop only re-selects lambdas on already-admitted signals. The paper is transparent about these design choices and acknowledges the absence of formal multiple-testing corrections. The central claim retains partial independent content because the main+IX2 base policy already improves Sharpe versus QQQ in all three windows before the third-order layer is added, and the lambda re-selection is genuinely walk-forward. The self-citations to Xiong (2026a, 2026b) are structural/methodological references, not load-bearing for any mathematical claim, so they do not raise the circularity score further. Score 5 reflects that the headline OOS Sharpe improvements are partially conditioned on in-sample signal and parameter selection, with the third-order layer being the most concrete instance of selection-on-validation-data.
Axiom & Free-Parameter Ledger
free parameters (11)
- M (max tilt) =
0.50
- τ (score scale) =
0.75
- η (smoothing speed) =
0.05
- λ_m, λ_2, λ_3 (signal lambdas) =
grid {0.25,0.50,0.75,1.00}
- c (turnover cost) =
10 bps one-way
- HAC t-stat threshold =
2.0
- Correlation de-duplication threshold =
0.95
- Training window length =
756 trading days
- Test block length =
63 trading days
- Turnover penalty threshold =
300% annualized
- Max third-order terms =
5
axioms (4)
- standard math HAC/Newey-West standard errors are valid for overlapping multi-day return labels
- domain assumption QQQ-DIA relative return is predictable by state variables constructed from rates, volatility, credit, and relative momentum
- domain assumption Expanding standardization with 252-day warmup produces stable score scales across signal orders
- ad hoc to paper The globally screened signal universe contains genuine predictive structure rather than spurious in-sample correlations
read the original abstract
This paper studies Relief-Gated Relative Rotation (RGRR), a two-ETF rule that allocates between QQQ and DIA by mapping screened relative and macro states into a continuous QQQ weight. RGRR is economic rather than mechanical: it rotates between a growth-heavy sleeve and a Dow/value-heavy sleeve only when QQQ-DIA relative states are confirmed by rate, volatility, credit, or broad-market relief conditions. Candidate main effects and interactions are globally screened with horizon-specific HAC regressions and correlation de-duplication, then held fixed during walk-forward validation. Rolling out-of-sample validation re-selects only signal-family lambdas, not the signal universe or the position mapping. The final stack contains one main effect, nine second-order interactions, and two third-order interactions. Third-order terms must also improve rolling out-of-sample Sharpe versus the main plus second-order base and survive economic-family de-duplication. The final mapping uses a fixed bounded weight transformation and includes a 10 bps one-way turnover cost. Across the 2018, 2020, and 2022 out-of-sample starts, RGRR improves Sharpe versus 100% QQQ and 50/50 QQQ-DIA in every tested interval. It improves CAGR versus 50/50 in every interval, but beats 100% QQQ on CAGR only in the 2022 window. In 2018, RGRR earns an 18.33% CAGR and 0.94 Sharpe, versus 20.50% and 0.89 for QQQ and 16.69% and 0.86 for 50/50. In 2022, it earns a 15.19% CAGR and 0.87 Sharpe, versus 14.65% and 0.70 for QQQ. The evidence supports RGRR as a risk-adjusted relative allocation rule, not a pure return-dominance rule. Its main practical weakness is high turnover, ranging from 354% to 506% annualized.
Figures




Reference graph
Works this paper leans on
- [1]
-
[2]
Brandt, M. W., P. Santa-Clara, and R. Valkanov. 2009. Parametric portfolio policies: Exploiting characteristics in the cross-section of equity returns. Review of Financial Studies 22(9): 3411--3447
work page 2009
- [3]
-
[4]
Carhart, M. M. 1997. On persistence in mutual fund performance. Journal of Finance 52(1): 57--82
work page 1997
- [5]
- [6]
-
[7]
Goyal, A., and I. Welch. 2008. A comprehensive look at the empirical performance of equity premium prediction. Review of Financial Studies 21(4): 1455--1508
work page 2008
-
[8]
Hansen, P. R. 2005. A test for superior predictive ability. Journal of Business and Economic Statistics 23(4): 365--380
work page 2005
-
[9]
White, H. 2000. A reality check for data snooping. Econometrica 68(5): 1097--1126
work page 2000
-
[10]
Xiong, Z. 2026a. Continuous Timing Signals for Growth-Defensive Style Allocation: Factor Attribution, Risk Matching, and Out-of-Sample Evidence. arXiv preprint arXiv:2605.20636
work page internal anchor Pith review Pith/arXiv arXiv
-
[11]
Xiong, Z. 2026b. Continuous Cash-Overlay Filters for a Static Growth--Defensive Risk Sleeve: Slow-Tail Compensation, V-Shape Crash Brakes, Walk-Forward Validation, and Max-Cash Combination. arXiv preprint arXiv:2606.09025
work page internal anchor Pith review Pith/arXiv arXiv
discussion (0)
Sign in with ORCID, Apple, or X to comment. Anyone can read and Pith papers without signing in.