REVIEW 3 major objections 8 minor 66 references
Reviewed by Pith at T0; open to challenge.
T0 means a machine referee read the full paper against a public rubric. The mark states how deep the mechanical check went, never who wrote it. the ladder, T0–T4 →
T0 review · glm-5.2
First 3D map of nearby atomic hydrogen with velocities
2026-07-09 10:21 UTC pith:6GLTOQT2
load-bearing objection First velocity-resolved 3D HI map within 1.25 kpc via IFT forward modeling; synthetic validation is prior-informed but real-data checks are encouraging. the 3 major comments →
Milky Way Atlas: A radial-velocity-resolved, three-dimensional map of H I within 1.25 kpc
The pith
A machine-rendered reading of the paper's core claim, the machinery that carries it, and where it could break.
Core claim
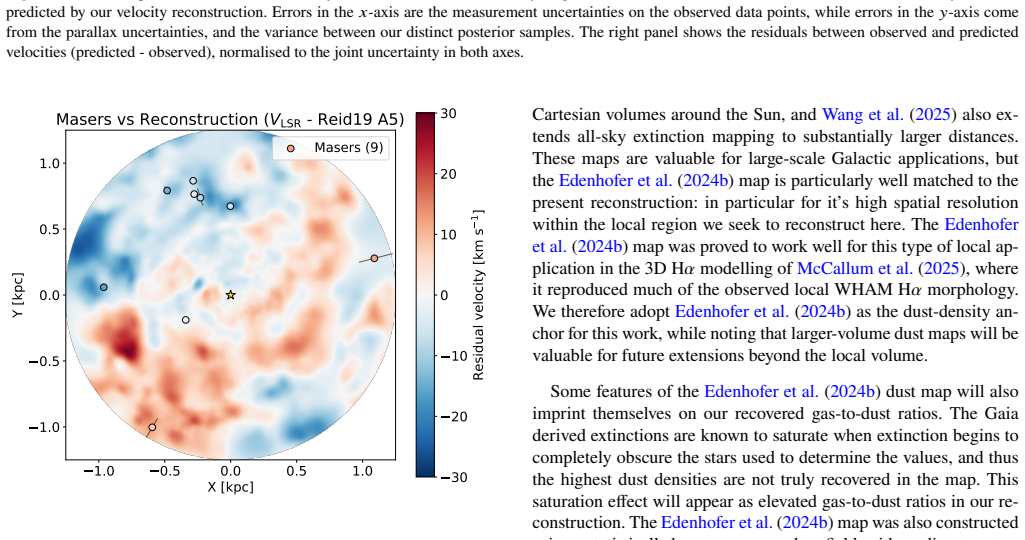
The central object is a jointly inferred set of three 3D fields — HI density, line-of-sight velocity, and effective line width — within 1.25 kpc of the Sun, reconstructed by forward-modeling how these fields would produce the observed HI4PI emission when combined with the Edenhofer et al. (2024) dust map as a spatial anchor. The paper validates this reconstruction through synthetic data tests showing accurate recovery of ground-truth density and velocity structure even with substantial distant-emission contamination, and through comparisons with 11 maser sources (reduced chi-squared of 2.4) and 123 young stellar clusters. The map reveals that local HI is smoother and more diffuse than the粉尘,
What carries the argument
The inference uses Metric Gaussian Variational Inference to handle approximately 25 million free parameters across three 3D correlated Gaussian random fields (HI-to-dust ratio, velocity, line width) plus a 2D remainder-sky component. A forward model computes synthetic 21-cm emission from each voxel including optical-depth self-absorption along the line of sight. The HI-to-dust ratio is modeled as a smooth spatially correlated field rather than a constant, allowing local departures from a fixed gas-to-dust conversion. A velocity-seeding pre-step identifies regions where dust-HI morphological correlation exceeds 0.75 to initialize velocities for kinematically anomalous high-latitude clouds (IV
Load-bearing premise
The reconstruction assumes the HI-to-dust ratio can be modeled as a smooth 3D correlated Gaussian random field, which means HI structures lacking a dust morphological counterpart can only be recovered where the data alone is strong enough to overcome the prior — a limitation demonstrated by the erroneous local placement of the distant Magellanic Stream.
What would settle it
If the velocity field were not physically meaningful, the reconstructed line-of-sight velocities at the positions of independent maser sources (which directly trace gas motion) would show no correlation with observed maser velocities. The paper reports a reduced chi-squared of 2.4 for 11 masers, dominated by two outliers in low-density regions, suggesting the velocities are broadly correct but degrade where HI density is low.
If this is right
- The 3D velocity field can serve as a lookup table: any emission line observed in position-position-velocity space within 1.25 kpc can be localized in true 3D position by matching its velocity to the reconstructed field along the line of sight.
- The recovered HI-to-dust ratio field, which varies significantly in 3D, can replace the constant gas-to-dust conversions assumed in existing 3D models of ionized gas or extinction, improving those reconstructions.
- The local/distant sky decomposition (approximately 50% of emission within |V_LSR| < 75 km/s is local) can inform and constrain larger-scale Galactic gas reconstructions by providing a well-characterized local foreground model.
- Extending the framework to include CO-traced molecular hydrogen would close the hydrogen budget and enable a complete 3D map of all neutral gas phases in the solar neighborhood.
- The velocity field's power spectrum (turnover at 157 pc, slope of -4.0) provides a new observational constraint on the turbulent cascade in the local ISM, though the paper notes this is complicated by the fact that only radial velocity is measured.
Where Pith is reading between the lines
- The Magellanic Stream contamination — where a known distant structure is erroneously placed locally — demonstrates that the method's reliance on dust morphology as a spatial prior creates a systematic blind spot for gas structures that have no dust counterpart. This suggests the map should be used with caution for high-latitude or high-velocity gas where dust is sparse.
- The steeper-than-expected decline in the circular rotation profile compared to Reid et al. (2019) could reflect real non-circular motions from local features (Local Bubble expansion, spiral arm perturbations) rather than a true change in the underlying rotation curve, given the limited radial range sampled.
- The velocity-seeding step's correlation threshold of 0.75 could bias the reconstruction toward gas that follows dust morphology, potentially missing kinematically distinct HI features that are genuinely uncorrelated with dust — a selection effect that would be invisible in the synthetic data tests if those tests draw from the same prior assumptions.
- The fixed spin temperature of 200 K likely causes systematic density underestimation in cold dense regions and overestimation in diffuse regions, which would affect the HI-to-dust ratio measurements precisely where the atomic-to-molecular transition is occurring.
Editorial analysis
A structured set of objections, weighed in public.
Referee Report
Summary. This paper presents a velocity-resolved 3D map of atomic hydrogen within 1.25 kpc of the Sun, constructed by combining the HI4PI 21-cm survey with the Edenhofer et al. (2024) 3D dust map within an Information Field Theory framework. The authors jointly infer three 3D fields — HI-to-dust ratio, LOS velocity, and effective line width — using Metric Gaussian Variational Inference (MGVI), while simultaneously fitting a flexible 'remainder' component that absorbs emission from beyond the mapped volume. The method is validated through synthetic data tests and comparisons with independent kinematic tracers (masers and young stellar clusters). The resulting map shows a smoother HI distribution than dust, a declining HI-to-dust ratio at high dust columns consistent with the atomic-to-molecular transition (matching Krumholz et al. 2009 predictions), and a velocity field capturing both Galactic rotation and local non-circular motions. The data products are publicly available.
Significance. The paper makes a valuable contribution to Galactic ISM studies by producing the first IFT-based, velocity-resolved 3D HI reconstruction tied to the newest generation of parsec-scale dust maps. The approach of jointly modeling local and distant emission via a remainder component is methodologically interesting and addresses a real obstacle in local ISM studies. The HI-to-dust transition matching Krumholz et al. (2009) at the expected column densities is a physically meaningful, falsifiable check that lends credibility to the density reconstruction. The public release of posterior mean grids and samples on Zenodo is a strength. The comparison to the independent Soler et al. (2025) HOG-based velocity field, showing broad agreement on high-confidence structures, is a useful cross-validation. The maser comparison (reduced chi-squared = 2.4 for 11 sources) provides an external kinematic check, though the sample is small.
major comments (3)
- §2.2.6: The synthetic data test draws ground truth from the same Matérn GRF prior family used in the reconstruction. The authors acknowledge this implicitly by noting that IVCs require a manual velocity-seeding workaround (§2.2.7) because they are 'hard to find in parameter space' under the GRF prior, yet the synthetic test does not include such non-Gaussian structures. This means the synthetic test likely overestimates real-data fidelity for structures that depart from the prior's support (sharp filamentary transitions, multiple velocity components along a single sightline, phase boundaries). The paper should explicitly discuss this limitation — ideally quantifying how the velocity-seeding step affects the synthetic test recovery rates, or at minimum adding a caveat that the synthetic test validates recovery within the prior's support and may not represent performance on the full range
- §2.2.7: The velocity seeding step pre-selects regions where dust-HI morphological correlation exceeds 0.75 before the main inference runs. This could bias the reconstruction toward structures that follow dust morphology and against genuinely independent gas features. The threshold of 0.75 and the 70%-of-peak contiguous-range criterion appear to be chosen empirically but no sensitivity analysis is provided. Since the central claim is that the method 'reliably reconstructs 3D HI density, velocity, and line width,' the dependence of the final product on this pre-processing step is load-bearing. The authors should either (a) demonstrate that the reconstruction is insensitive to reasonable variations of these thresholds, or (b) clearly state which structures in the final map owe their placement to the seeding step and would be absent without it.
- §3.3, Fig. 13: The combined maser+cluster reduced chi-squared of 4.85 (or 2.4 for masers alone) is somewhat high for a validation. The authors note that the maser value is 'dominated by only two poorly explained maser velocities, both of which exist in regions of the map with little-to-no HI emission.' This is an important caveat: the velocity field is unreliable in low-density regions. The paper should more prominently flag which regions of the published map have velocity fields that are data-driven versus prior-driven, perhaps by providing a companion map of velocity uncertainty or data-constraint quality. Without this, users of the data product may over-interpret velocities in poorly constrained regions.
minor comments (8)
- §2.1.2, Eq. (7): The conversion factor of 4.5e-23 g cm^-3 per dust map unit is noted as 'somewhat higher than in previous works.' The factor of ~1.6 increase relative to Zucker et al. (2021) is explained by the Draine (2009) to Hensley & Draine (2023) model update. This is clearly stated, but the impact on downstream comparisons (e.g., the HI-to-dust ratio analysis in §3.2/§4.2) should be noted — specifically, whether the Krumholz et al. (2009) transition column comparison is affected.
- §2.2.3, Eq. (8): The forward model assumes a single Gaussian velocity component per voxel. The authors note this limitation in the text, but it would help to state the typical velocity separation below which two components would be unresolved given the grid resolution and spectral resolution.
- §3.2, Fig. 7: The comparison to the Dickey & Lockman (1990) profile shows systematically higher densities at |z| > 500 pc. The authors attribute this partly to IVCs recovered via the velocity-seeding step and partly to Magellanic Stream contamination. Given the small number of voxels at extreme |z|, a simple error bar or shaded region on the reconstructed profile would help readers assess the significance of this difference.
- §3.3, Fig. 12: The circularly averaged rotation profile appears to decline more steeply than the Reid et al. (2019) curve. The authors caution against over-interpretation, but the figure as presented could invite unwarranted claims. A note that this is not a measurement of the Galactic rotation curve but rather a byproduct of the local velocity field reconstruction, affected by non-circular motions, would be useful. The switch from 230 to 237 km/s normalization between reconstruction and post-hoc analysis is mentioned but could be clearer.
- Table C1: The prior table is comprehensive but some entries could benefit from brief physical motivation. For instance, the Matérn lengthscale prior for the velocity field (mean 0.15 kpc) vs. the HI-to-dust field (mean 0.3 kpc) — is the shorter velocity lengthscale motivated by expected velocity coherence scales?
- §4.4, Table 2: The comparison to Soler et al. (2025) notes that quantities depend on the adopted grid and averaging scheme. The velocity dispersion ratio (6.0 vs 10.8 km/s) is a factor of ~1.8 difference; a brief discussion of whether this is physically expected (given the different methods' smoothing properties) or merely a systematic effect of gridding would strengthen the comparison.
- Figures: Several figures (e.g., Fig. 2, Fig. 4) use color bars that could be more clearly labeled with units. The central circular artifact (unmapped d < 69 pc) in face-on views should be masked or noted more prominently in captions.
- §4.6: The discussion of future possibilities is lengthy. While the individual points are reasonable, this section could be condensed to improve focus on the present results.
Simulated Author's Rebuttal
We thank the referee for a careful and constructive report. The referee identifies three main areas for improvement: (1) the synthetic data test draws from the same prior family as the reconstruction, potentially overestimating fidelity for non-Gaussian structures; (2) the velocity-seeding pre-processing step lacks a sensitivity analysis and could bias the reconstruction toward dust-morphology-following structures; and (3) the validation chi-squared values are somewhat high and the map should more prominently flag which regions have data-driven versus prior-driven velocity fields. We agree with all three points and will revise the manuscript accordingly.
read point-by-point responses
-
Referee: §2.2.6: The synthetic data test draws ground truth from the same Matérn GRF prior family used in the reconstruction. The authors acknowledge this implicitly by noting that IVCs require a manual velocity-seeding workaround (§2.2.7) because they are 'hard to find in parameter space' under the GRF prior, yet the synthetic test does not include such non-Gaussian structures. This means the synthetic test likely overestimates real-data fidelity for structures that depart from the prior's support (sharp filamentary transitions, multiple velocity components along a single sightline, phase boundaries). The paper should explicitly discuss this limitation — ideally quantifying how the velocity-seeding step affects the synthetic test recovery rates, or at minimum adding a caveat that the synthetic test validates recovery within the prior's support and may not represent performance on the full range.
Authors: The referee is correct that the synthetic data test draws ground truth from the same Matérn GRF prior family used in the reconstruction, and that this means the test validates recovery within the prior's support rather than for the full range of structures present in the real ISM. We agree that this limitation should be stated explicitly. We will add a caveat to §2.2.6 noting that the synthetic test validates recovery for structures consistent with the GRF prior and may overestimate real-data fidelity for structures that depart from this prior's support, including sharp filamentary transitions, multiple velocity components along a single sightline, and phase boundaries. We will also note that the velocity-seeding step (§2.2.7) was introduced precisely because IVCs — which are non-Gaussian in the sense that they are kinematically anomalous relative to their surroundings — are not well recovered under the GRF prior alone, which itself illustrates the limitation the referee identifies. We will cross-reference §2.2.7 in the synthetic data discussion to make this connection explicit. Regarding the suggestion to quantify how the velocity-seeding step affects synthetic test recovery rates: the synthetic test as currently designed does not include IVC-like structures, so the seeding step is not activated in the synthetic pipeline. Running a synthetic test with manually injected IVC-like structures and comparing recovery with and without seeding would be a valuable additional test, but it requires non-trivial development of a non-Gaussian ground-truth generator that is beyond the scope of this revision. We will state this as a direction for future work. revision: yes
-
Referee: §2.2.7: The velocity seeding step pre-selects regions where dust-HI morphological correlation exceeds 0.75 before the main inference runs. This could bias the reconstruction toward structures that follow dust morphology and against genuinely independent gas features. The threshold of 0.75 and the 70%-of-peak contiguous-range criterion appear to be chosen empirically but no sensitivity analysis is provided. Since the central claim is that the method 'reliably reconstructs 3D HI density, velocity, and line width,' the dependence of the final product on this pre-processing step is load-bearing. The authors should either (a) demonstrate that the reconstruction is insensitive to reasonable variations of these thresholds, or (b) clearly state which structures in the final map owe their placement to the seeding step and would be absent without it.
Authors: The referee raises a valid concern. The velocity-seeding step is indeed load-bearing for the placement of certain structures — specifically the kinematically anomalous high-latitude clouds (IVCs) that are not well recovered by the GRF prior alone. We can address this comment through option (b): we will add a clear statement identifying which structures in the final map owe their placement to the seeding step. In particular, we will note that the high-altitude HI clouds discussed in §4.1 and §4.5 (including IVC 135) are the primary structures whose placement depends on the seeding step, and that without seeding these clouds are absorbed into the distant remainder. We will also note that the seeding step provides only an initial velocity guess that is subsequently refined by the full inference, so the final velocity of these structures is not solely determined by the seed. Regarding option (a), we agree that a sensitivity analysis on the 0.75 threshold and the 70%-of-peak criterion would strengthen the paper. We will run the reconstruction with varied thresholds (e.g., 0.65 and 0.85) and report whether the set of seeded structures and their final reconstructed velocities change significantly. If the sensitivity analysis is not complete in time for the revision, we will at minimum add a discussion of the expected effects of threshold variation and flag the empirical nature of the threshold choice. We acknowledge that the seeding step could in principle bias against genuinely independent gas features that do not correlate with dust morphology; we will add this as an explicit caveat. revision: partial
-
Referee: §3.3, Fig. 13: The combined maser+cluster reduced chi-squared of 4.85 (or 2.4 for masers alone) is somewhat high for a validation. The authors note that the maser value is 'dominated by only two poorly explained maser velocities, both of which exist in regions of the map with little-to-no HI emission.' This is an important caveat: the velocity field is unreliable in low-density regions. The paper should more prominently flag which regions of the published map have velocity fields that are data-driven versus prior-driven, perhaps by providing a companion map of velocity uncertainty or data-constraint quality. Without this, users of the data product may over-interpret velocities in poorly constrained regions.
Authors: We agree that the velocity field reliability is density-dependent and that this should be more prominently communicated to users of the data product. The manuscript already includes uncertainty maps in Figure 4 (bottom row), showing the projected velocity uncertainty from the posterior samples. However, these are somewhat buried in the figure set and the connection between HI density, data-constraint quality, and velocity reliability is not stated prominently enough. We will make the following changes: (1) We will add explicit text in §3.3 and §4.3 stating that velocity reliability is strongly linked to reconstructed HI density, and that velocities in low-density regions should be treated as prior-driven rather than data-driven. (2) We will add a note to the data release documentation on Zenodo flagging this limitation. (3) We will consider adding a companion figure or panel showing a mask or quality flag based on HI column density, though we note that the posterior uncertainty maps already partially serve this purpose. Regarding the chi-squared values: we agree these are somewhat high, and we will add a more prominent discussion of the two outlier masers and the fact that they fall in regions with little HI emission. We will also note that the cluster chi-squared is likely inflated by overconfident error bars on cluster mean velocities, as we already discuss but will make more prominent. revision: yes
Circularity Check
No significant circularity. The synthetic data test draws ground truth from the same Matérn GRF prior family used in reconstruction, which is a mild self-consistency concern, but the central scientific claims are independently validated by external data (masers, clusters, Krumholz et al. 2009).
full rationale
I walked the paper's derivation chain and found no step where a prediction or result reduces to its inputs by construction. (1) The synthetic data test (§2.2.6) does generate ground truth as 'draws from our prior' using the same Matérn GRF family as the reconstruction prior. This is a known limitation of Bayesian synthetic tests — it validates the inverse-problem solution for signals in the prior's support but cannot quantify failures for non-Gaussian ISM structure. However, this is not strictly circular: the forward model (Eq. 8–9) adds non-trivial radiative transfer and optical-depth physics, the test includes independent distant contamination from Söding et al. (2025), and the paper explicitly acknowledges the limitation for IVCs (§2.2.7). The test validates that MGVI can invert the forward model, not that the prior equals the posterior. (2) The real-data validations are independent: maser velocities from Reid et al. (2019) and cluster velocities from Hunt & Reffert (2023) are external datasets not used in the reconstruction. The HI-to-dust transition at dust column densities consistent with Krumholz et al. (2009) is compared against an independent theoretical prediction. The χ² = 1.3 against HI4PI is a goodness-of-fit measure, not claimed as a prediction. (3) Self-citations (Söding et al. 2025 for distant-sky priors and opacity treatment; Edenhofer et al. 2024b for the dust map; McCallum et al. 2025 for prior Hα work) are methodological and do not form a load-bearing chain for the central claims. The remainder-sky scale-height priors are fitted from Söding et al. (2025), but this governs a nuisance component, not the scientific result. Overall, the derivation is self-contained against external benchmarks, and the mild prior-informedness of the synthetic test is a correctness-risk concern rather than a circularity.
Axiom & Free-Parameter Ledger
free parameters (17)
- Mean log(HI/dust) offset =
inferred (prior mean 4.7)
- Matérn variance (HI/dust field) =
inferred (prior mean 0.5)
- Matérn lengthscale (HI/dust field) =
inferred (prior mean 0.3 kpc)
- Matérn slope (HI/dust field) =
inferred (prior mean 3.5)
- Mean velocity offset =
inferred (prior mean 0.01 km/s)
- Matérn variance (velocity field) =
inferred (prior mean 5.0 km²/s²)
- Matérn lengthscale (velocity field) =
inferred (prior mean 0.15 kpc)
- Matérn slope (velocity field) =
inferred (prior mean 3.5)
- Mean log line-width offset =
inferred (prior mean 1.1 log(km/s))
- Matérn variance (line-width field) =
inferred (prior mean 0.05)
- Matérn lengthscale (line-width field) =
inferred (prior mean 0.3 kpc)
- Matérn slope (line-width field) =
inferred (prior mean 3.5)
- Remainder sky parameters (20+ parameters) =
inferred
- T_spin =
200 K (fixed)
- R_V =
3.1 (fixed)
- Rotation curve normalization (reconstruction) =
230 km/s (fixed)
- Rotation curve normalization (post-hoc analysis) =
237 km/s
axioms (6)
- domain assumption HI and dust morphology are sufficiently correlated that the dust map provides a valid spatial prior for HI density structure
- domain assumption The HI-to-dust ratio, velocity, and line-width fields are well-described by Matérn covariance Gaussian processes
- domain assumption A single Gaussian line profile per voxel adequately represents the HI emission
- domain assumption T_spin = 200 K is a reasonable approximation for the 21cm spin temperature throughout the local volume
- domain assumption The remainder-sky model (2-disc latitude profile + correlated PPV field) can adequately represent all non-local emission
- domain assumption Metric Gaussian Variational Inference provides an adequate approximation to the true posterior
invented entities (1)
-
Remainder sky component
independent evidence
read the original abstract
We present a velocity-resolved three-dimensional map of local atomic hydrogen (HI) within 1.25 kpc of the Sun, tackling the challenge of converting emission from position-position-velocity space into true 3D structure. Our method combines the HI4PI full-sky survey with the Edenhofer et al. (2024) 3D dust map in the framework of Information Field Theory, enabling a joint reconstruction of the local HI density, radial velocity field, and effective line width while also separating emission arising inside the mapped local volume from more distant Galactic HI. The inference is driven by morphological matching between dust and HI structures together with kinematic coherence in 3D space. Synthetic data tests show that the method recovers the local density and velocity structure, even in the presence of substantial contamination from distant emission. The resulting map reveals a smoother, more diffuse local HI distribution than the dust, a declining HI-to-dust ratio toward high dust column densities consistent with the atomic-to-molecular transition, and a velocity field that captures both large-scale Galactic rotation and local non-circular velocities. Independent comparisons with maser and young stellar cluster velocities agree with the recovered kinematics. This HI map provides a new three-dimensional, kinematically resolved view of the nearby atomic interstellar medium and a foundation for localising other velocity-resolved Galactic emission in physical space.
Figures




Reference graph
Works this paper leans on
-
[1]
Spatially coherent 3D distributions of HI and CO in the Milky Way. , keywords =. doi:10.1051/0004-6361/202451361 , archivePrefix =. 2407.02859 , primaryClass =
-
[2]
The Accretion of Fuel at the Disk-Halo Interface
The Accretion of Fuel at the Disk-Halo Interface. arXiv e-prints , keywords =. doi:10.48550/arXiv.0907.1023 , archivePrefix =. 0907.1023 , primaryClass =
work page internal anchor Pith review Pith/arXiv arXiv doi:10.48550/arxiv.0907.1023
-
[3]
An all-sky 3D dust map Based on Gaia and LAMOST
An All-sky 3D Dust Map Based on Gaia and LAMOST. , keywords =. doi:10.3847/1538-4365/adea39 , archivePrefix =. 2509.07640 , primaryClass =
work page internal anchor Pith review Pith/arXiv arXiv doi:10.3847/1538-4365/adea39
-
[4]
The Wisconsin H-Alpha Mapper Northern Sky Survey
The Wisconsin H Mapper Northern Sky Survey. , keywords =. doi:10.1086/378850 , archivePrefix =. astro-ph/0309117 , primaryClass =
work page internal anchor Pith review Pith/arXiv arXiv doi:10.1086/378850
-
[5]
Star formation near the Sun is driven by expansion of the Local Bubble
Star formation near the Sun is driven by expansion of the Local Bubble. , keywords =. doi:10.1038/s41586-021-04286-5 , archivePrefix =. 2201.05124 , primaryClass =
work page internal anchor Pith review Pith/arXiv arXiv doi:10.1038/s41586-021-04286-5
-
[6]
A Rv map of the Milky Way revealed by LAMOST
An R _ V Map of the Milky Way Revealed by LAMOST. , keywords =. doi:10.3847/1538-4365/acf764 , archivePrefix =. 2309.04113 , primaryClass =
work page internal anchor Pith review Pith/arXiv arXiv doi:10.3847/1538-4365/acf764
-
[7]
Three-dimensional extinction maps: Inverting inter-calibrated extinction catalogues
Three-dimensional extinction maps: Inverting inter-calibrated extinction catalogues. , keywords =. doi:10.1051/0004-6361/202243319 , archivePrefix =. 2205.09087 , primaryClass =
work page internal anchor Pith review Pith/arXiv arXiv doi:10.1051/0004-6361/202243319
-
[8]
Geometric variational inference
Geometric Variational Inference. Entropy , keywords =. doi:10.3390/e23070853 , archivePrefix =. 2105.10470 , primaryClass =
work page internal anchor Pith review Pith/arXiv arXiv doi:10.3390/e23070853
-
[9]
Multiwavelength probes of the Milky Way's cold interstellar medium: radio H I and optical K I absorption with GASKAP and GALAH. , keywords =. doi:10.1093/mnras/staf1663 , archivePrefix =. 2509.23066 , primaryClass =
- [10]
-
[11]
Re-Envisioning Numerical Information Field Theory (NIFTy.re): A Library for Gaussian Processes and Variational Inference. The Journal of Open Source Software , keywords =. doi:10.21105/joss.06593 , archivePrefix =. 2402.16683 , primaryClass =
work page internal anchor Pith review Pith/arXiv arXiv doi:10.21105/joss.06593
-
[12]
Annalen der Physik , year = 2019, month = mar, volume =
NIFTy 3 - Numerical Information Field Theory: A Python Framework for Multicomponent Signal Inference on HPC Clusters. Annalen der Physik , year = 2019, month = mar, volume =. doi:10.1002/andp.201800290 , adsurl =
-
[13]
NIFTY - Numerical Information Field Theory - a versatile Python library for signal inference
NIFTY - Numerical Information Field Theory. A versatile PYTHON library for signal inference. , keywords =. doi:10.1051/0004-6361/201321236 , archivePrefix =. 1301.4499 , primaryClass =
work page internal anchor Pith review Pith/arXiv arXiv doi:10.1051/0004-6361/201321236
-
[14]
The Journal of Open Source Software , year = 2018, month = jun, volume =
dustmaps: A Python interface for maps of interstellar dust. The Journal of Open Source Software , year = 2018, month = jun, volume =. doi:10.21105/joss.00695 , adsurl =
-
[15]
HEALPix: A Framework for High-Resolution Discretization and Fast Analysis of Data Distributed on the Sphere. , keywords =. doi:10.1086/427976 , archivePrefix =. astro-ph/0409513 , primaryClass =
work page internal anchor Pith review Pith/arXiv arXiv doi:10.1086/427976
-
[16]
Metric Gaussian Variational Inference
Metric Gaussian Variational Inference. arXiv e-prints , keywords =. doi:10.48550/arXiv.1901.11033 , archivePrefix =. 1901.11033 , primaryClass =
work page internal anchor Pith review Pith/arXiv arXiv doi:10.48550/arxiv.1901.11033 1901
-
[17]
Bayesian Reasoning with Trained Neural Networks
Bayesian Reasoning with Trained Neural Networks. Entropy , keywords =. doi:10.3390/e23060693 , archivePrefix =. 2001.11031 , primaryClass =
work page internal anchor Pith review Pith/arXiv arXiv doi:10.3390/e23060693 2001
-
[18]
A Far Ultraviolet Spectroscopic Explorer Survey of Interstellar Molecular Hydrogen in the Galactic Disk. , keywords =. doi:10.3847/1538-4357/abe707 , archivePrefix =. 2102.11301 , primaryClass =
work page internal anchor Pith review Pith/arXiv arXiv doi:10.3847/1538-4357/abe707
-
[19]
Constraining the H _ 2 column densities in the diffuse interstellar medium using dust extinction and H I data. , keywords =. doi:10.1051/0004-6361/202347968 , archivePrefix =. 2312.02274 , primaryClass =
work page internal anchor Pith review Pith/arXiv arXiv doi:10.1051/0004-6361/202347968
-
[20]
Are supernovae driving turbulence in the solar neighborhood?
Are supernovae driving turbulence in the solar neighborhood?. , keywords =. doi:10.1051/0004-6361/202659062 , archivePrefix =. 2603.13008 , primaryClass =
work page internal anchor Pith review Pith/arXiv arXiv doi:10.1051/0004-6361/202659062
-
[21]
Information Theory for Fields. Annalen der Physik , keywords =. doi:10.1002/andp.201800127 , archivePrefix =. 1804.03350 , primaryClass =
work page internal anchor Pith review Pith/arXiv arXiv doi:10.1002/andp.201800127
-
[22]
Information field theory for cosmological perturbation reconstruction and non-linear signal analysis
Information field theory for cosmological perturbation reconstruction and nonlinear signal analysis. , keywords =. doi:10.1103/PhysRevD.80.105005 , archivePrefix =. 0806.3474 , primaryClass =
work page internal anchor Pith review Pith/arXiv arXiv doi:10.1103/physrevd.80.105005
-
[23]
A CO Survey of the Entire Northern Sky. , keywords =. doi:10.3847/1538-4365/ac7e53 , adsurl =
-
[24]
, year = 1957, month = may, volume =
The distribution of atomic hydrogen in the outer parts of the Galactic System. , year = 1957, month = may, volume =
work page 1957
-
[25]
, year = 1958, month = jan, volume =
The galactic system as a spiral nebula (Council Note). , year = 1958, month = jan, volume =. doi:10.1093/mnras/118.4.379 , adsurl =
-
[26]
The HI halo in the inner galaxy. , keywords =. doi:10.1086/162277 , adsurl =
-
[27]
A panoptic view of the Taurus molecular cloud. I. The cloud dynamics revealed by gas emission and 3D dust. , keywords =. doi:10.1051/0004-6361/202346241 , archivePrefix =. 2305.13180 , primaryClass =
work page internal anchor Pith review Pith/arXiv arXiv doi:10.1051/0004-6361/202346241
-
[28]
Atomic Hydrogen in the Milky Way: A Stepping Stone in the Evolution of Galaxies
Atomic Hydrogen in the Milky Way: A Stepping Stone in the Evolution of Galaxies. , keywords =. doi:10.1146/annurev-astro-052920-104851 , archivePrefix =. 2307.08464 , primaryClass =
work page internal anchor Pith review Pith/arXiv arXiv doi:10.1146/annurev-astro-052920-104851
-
[29]
Gass: The Parkes Galactic All-Sky Survey. I. Survey Description, Goals, and Initial Data Release. , keywords =. doi:10.1088/0067-0049/181/2/398 , archivePrefix =. 0901.1159 , primaryClass =
work page internal anchor Pith review Pith/arXiv arXiv doi:10.1088/0067-0049/181/2/398
-
[30]
GASS: the Parkes Galactic all-sky survey. II. Stray-radiation correction and second data release. , keywords =. doi:10.1051/0004-6361/200913979 , archivePrefix =. 1007.0686 , primaryClass =
work page internal anchor Pith review Pith/arXiv arXiv doi:10.1051/0004-6361/200913979
-
[31]
GASS: The Parkes Galactic All-Sky Survey. Update: improved correction for instrumental effects and new data release. , keywords =. doi:10.1051/0004-6361/201525859 , archivePrefix =. 1505.01011 , primaryClass =
work page internal anchor Pith review Pith/arXiv arXiv doi:10.1051/0004-6361/201525859
-
[32]
The Effelsberg-Bonn HI Survey: Milky Way gas. First data release
The Effelsberg-Bonn H I Survey: Milky Way gas. First data release. , keywords =. doi:10.1051/0004-6361/201527007 , archivePrefix =. 1512.05348 , primaryClass =
work page internal anchor Pith review Pith/arXiv arXiv doi:10.1051/0004-6361/201527007
-
[33]
The Effelsberg-Bonn HI Survey (EBHIS)
The Effelsberg Bonn H I Survey (EBHIS). Astronomische Nachrichten , keywords =. doi:10.1002/asna.201011548 , archivePrefix =. 1104.1185 , primaryClass =
work page internal anchor Pith review Pith/arXiv arXiv doi:10.1002/asna.201011548
-
[34]
The Milky Way in Molecular Clouds: A New Complete CO Survey
The Milky Way in Molecular Clouds: A New Complete CO Survey. , keywords =. doi:10.1086/318388 , archivePrefix =. astro-ph/0009217 , primaryClass =
work page internal anchor Pith review Pith/arXiv arXiv doi:10.1086/318388
-
[35]
The Atomic to Molecular Transition in Galaxies. II: HI and H_2 Column Densities
The Atomic-to-Molecular Transition in Galaxies. II: H I and H _ 2 Column Densities. , keywords =. doi:10.1088/0004-637X/693/1/216 , archivePrefix =. 0811.0004 , primaryClass =
work page internal anchor Pith review Pith/arXiv arXiv doi:10.1088/0004-637x/693/1/216
-
[36]
The Magellanic Stream, High-Velocity Clouds and the Sculptor Group
The Magellanic Stream, High-Velocity Clouds, and the Sculptor Group. , keywords =. doi:10.1086/344477 , archivePrefix =. astro-ph/0209127 , primaryClass =
work page internal anchor Pith review Pith/arXiv arXiv doi:10.1086/344477
-
[37]
Akademiia Nauk SSSR Doklady , year = 1941, month = jan, volume =
The Local Structure of Turbulence in Incompressible Viscous Fluid for Very Large Reynolds' Numbers. Akademiia Nauk SSSR Doklady , year = 1941, month = jan, volume =
work page 1941
-
[38]
Dust extinction-curve variation in the translucent interstellar medium is driven by PAH growth
Dust-extinction-curve Variation in the Translucent Interstellar Medium Is Driven by Polycyclic Aromatic Hydrocarbon Growth. , keywords =. doi:10.3847/2041-8213/ada28f , archivePrefix =. 2410.23171 , primaryClass =
work page internal anchor Pith review Pith/arXiv arXiv doi:10.3847/2041-8213/ada28f 2041
-
[39]
Unveiling the Milky Way dust extinction curve in 3D
Three-dimensional maps of the interstellar dust extinction curve within the Milky Way galaxy. Science , keywords =. doi:10.1126/science.ado9787 , archivePrefix =. 2407.14594 , primaryClass =
work page internal anchor Pith review Pith/arXiv arXiv doi:10.1126/science.ado9787
-
[40]
, year = 2009, month = sep, volume =
The Hi Distribution of the Milky Way. , year = 2009, month = sep, volume =. doi:10.1146/annurev-astro-082708-101823 , adsurl =
-
[41]
Planck early results. XXIV. Dust in the diffuse interstellar medium and the Galactic halo. , keywords =. doi:10.1051/0004-6361/201116485 , archivePrefix =. 1101.2036 , primaryClass =
work page internal anchor Pith review Pith/arXiv arXiv doi:10.1051/0004-6361/201116485 2036
-
[42]
Planck intermediate results. XVII. Emission of dust in the diffuse interstellar medium from the far-infrared to microwave frequencies. , keywords =. doi:10.1051/0004-6361/201323270 , archivePrefix =. 1312.5446 , primaryClass =
work page internal anchor Pith review Pith/arXiv arXiv doi:10.1051/0004-6361/201323270
-
[43]
Updated Gaia-2MASS 3D maps of Galactic interstellar dust
Updated Gaia-2MASS 3D maps of Galactic interstellar dust. , keywords =. doi:10.1051/0004-6361/202142846 , archivePrefix =. 2203.01627 , primaryClass =
work page internal anchor Pith review Pith/arXiv arXiv doi:10.1051/0004-6361/202142846
-
[44]
Resolving nearby dust clouds. , keywords =. doi:10.1051/0004-6361/202038169 , archivePrefix =. 2004.06732 , primaryClass =
work page internal anchor Pith review Pith/arXiv arXiv doi:10.1051/0004-6361/202038169 2004
-
[45]
Interstellar Dust Models and Evolutionary Implications
Interstellar Dust Models and Evolutionary Implications. Cosmic Dust - Near and Far , year = 2009, editor =. doi:10.48550/arXiv.0903.1658 , archivePrefix =. 0903.1658 , primaryClass =
work page internal anchor Pith review Pith/arXiv arXiv doi:10.48550/arxiv.0903.1658 2009
-
[46]
The H$\alpha$ sky in three dimensions
The H sky in three dimensions. , keywords =. doi:10.1093/mnrasl/slaf023 , archivePrefix =. 2503.14348 , primaryClass =
work page internal anchor Pith review Pith/arXiv arXiv doi:10.1093/mnrasl/slaf023
-
[47]
Improving the open cluster census. II. An all-sky cluster catalogue with Gaia DR3. , keywords =. doi:10.1051/0004-6361/202346285 , archivePrefix =. 2303.13424 , primaryClass =
work page internal anchor Pith review Pith/arXiv arXiv doi:10.1051/0004-6361/202346285
-
[48]
Trigonometric Parallaxes Of High-Mass Star Forming Regions: Our View Of The Milky Way
Trigonometric Parallaxes of High-mass Star-forming Regions: Our View of the Milky Way. , keywords =. doi:10.3847/1538-4357/ab4a11 , archivePrefix =. 1910.03357 , primaryClass =
work page internal anchor Pith review Pith/arXiv arXiv doi:10.3847/1538-4357/ab4a11 1910
-
[49]
H I in the galaxy. , keywords =. doi:10.1146/annurev.aa.28.090190.001243 , adsurl =
-
[50]
Bayesian inference of three-dimensional gas maps. I. Galactic CO. , keywords =. doi:10.1051/0004-6361/202141000 , archivePrefix =. 2012.15770 , primaryClass =
work page internal anchor Pith review Pith/arXiv arXiv doi:10.1051/0004-6361/202141000 2012
-
[51]
Bayesian inference of three-dimensional gas maps. II. Galactic HI. , keywords =. doi:10.1051/0004-6361/202243326 , archivePrefix =. 2202.02341 , primaryClass =
work page internal anchor Pith review Pith/arXiv arXiv doi:10.1051/0004-6361/202243326
-
[52]
Histogram of oriented gradients: a technique for the study of molecular cloud formation
Histogram of oriented gradients: a technique for the study of molecular cloud formation. , keywords =. doi:10.1051/0004-6361/201834300 , archivePrefix =. 1809.08338 , primaryClass =
work page internal anchor Pith review Pith/arXiv arXiv doi:10.1051/0004-6361/201834300
-
[53]
Toward a 3D kinetic tomography of Taurus clouds. I. Linking neutral potassium and dust. , keywords =. doi:10.1051/0004-6361/202140514 , archivePrefix =. 2104.14227 , primaryClass =
work page internal anchor Pith review Pith/arXiv arXiv doi:10.1051/0004-6361/202140514
-
[54]
Toward a 3D kinetic tomography of Taurus clouds. II. A new automated technique and its validation. , keywords =. doi:10.1051/0004-6361/202345968 , archivePrefix =. 2304.07785 , primaryClass =
work page internal anchor Pith review Pith/arXiv arXiv doi:10.1051/0004-6361/202345968
-
[55]
Kinetic tomography of the Galactic plane within 1.25 kiloparsecs from the Sun: The interstellar flows revealed by H I and CO line emission and 3D dust. , keywords =. doi:10.1051/0004-6361/202453022 , archivePrefix =. 2411.12257 , primaryClass =
work page internal anchor Pith review Pith/arXiv arXiv doi:10.1051/0004-6361/202453022
-
[56]
Kinetic Tomography. II. A Second Method for Mapping the Velocity Field of the Milky Way Interstellar Medium and a Comparison with Spiral Structure Models. , keywords =. doi:10.3847/1538-3881/aae68d , archivePrefix =. 1808.01286 , primaryClass =
work page internal anchor Pith review Pith/arXiv arXiv doi:10.3847/1538-3881/aae68d
-
[57]
Kinetic Tomography. I. A Method for Mapping the Milky Way s Interstellar Medium in Four Dimensions. , keywords =. doi:10.3847/1538-3881/153/1/8 , archivePrefix =. 1611.03867 , primaryClass =
work page internal anchor Pith review Pith/arXiv arXiv doi:10.3847/1538-3881/153/1/8
-
[58]
Sparse Kernel Gaussian Processes through Iterative Charted Refinement (ICR)
Sparse Kernel Gaussian Processes through Iterative Charted Refinement (ICR). arXiv e-prints , keywords =. doi:10.48550/arXiv.2206.10634 , archivePrefix =. 2206.10634 , primaryClass =
work page internal anchor Pith review Pith/arXiv arXiv doi:10.48550/arxiv.2206.10634
-
[59]
A Low Metallicity Molecular Cloud In The Lower Galactic Halo
A Low-metallicity Molecular Cloud in the Lower Galactic Halo. , keywords =. doi:10.1088/0004-637X/777/1/19 , archivePrefix =. 1308.6313 , primaryClass =
work page internal anchor Pith review Pith/arXiv arXiv doi:10.1088/0004-637x/777/1/19
-
[60]
The Distance to an X-Ray Shadowing Molecular Cloud in Ursa Major. , keywords =. doi:10.1086/177369 , adsurl =
-
[61]
The Local Bubble is a Local Chimney: A New Model from 3D Dust Mapping
The Local Bubble Is a Local Chimney: A New Model from 3D Dust Mapping. , keywords =. doi:10.3847/1538-4357/ad61de , archivePrefix =. 2403.04961 , primaryClass =
work page internal anchor Pith review Pith/arXiv arXiv doi:10.3847/1538-4357/ad61de
-
[62]
The Astrodust+PAH Model: A Unified Description of the Extinction, Emission, and Polarization from Dust in the Diffuse Interstellar Medium. , keywords =. doi:10.3847/1538-4357/acc4c2 , archivePrefix =. 2208.12365 , primaryClass =
work page internal anchor Pith review Pith/arXiv arXiv doi:10.3847/1538-4357/acc4c2
-
[63]
On the Three-Dimensional Structure of Local Molecular Clouds
On the Three-dimensional Structure of Local Molecular Clouds. , keywords =. doi:10.3847/1538-4357/ac1f96 , archivePrefix =. 2109.09765 , primaryClass =
work page internal anchor Pith review Pith/arXiv arXiv doi:10.3847/1538-4357/ac1f96
-
[64]
Parameters of 220 million stars from Gaia BP/RP spectra
Parameters of 220 million stars from Gaia BP/RP spectra. , keywords =. doi:10.1093/mnras/stad1941 , archivePrefix =. 2303.03420 , primaryClass =
work page internal anchor Pith review Pith/arXiv arXiv doi:10.1093/mnras/stad1941
-
[65]
A parsec-scale Galactic 3D dust map out to 1.25 kpc from the Sun
A parsec-scale Galactic 3D dust map out to 1.25 kpc from the Sun. , keywords =. doi:10.1051/0004-6361/202347628 , archivePrefix =. 2308.01295 , primaryClass =
work page internal anchor Pith review Pith/arXiv arXiv doi:10.1051/0004-6361/202347628
-
[66]
HI4PI: A full-sky HI survey based on EBHIS and GASS
HI4PI: A full-sky H I survey based on EBHIS and GASS. , keywords =. doi:10.1051/0004-6361/201629178 , archivePrefix =. 1610.06175 , primaryClass =
work page internal anchor Pith review Pith/arXiv arXiv doi:10.1051/0004-6361/201629178
discussion (0)
Sign in with ORCID, Apple, or X to comment. Anyone can read and Pith papers without signing in.