REVIEW 3 major objections 4 minor 81 references
The paper argues that off-axis viewing of standard long-GRB jets cannot explain the ultra-soft, relatively energetic fast X-ray transients seen by the Einstein Probe; these events likely come from a previously under-explored kind of relativ
Reviewed by Pith at T0; open to challenge. T0 means a machine referee read the full paper against a public rubric. the ladder, T0–T4 →
T0 review · deepseek-v4-flash
2026-08-02 02:28 UTC pith:5ZB4KZ2N
load-bearing objection The paper's central claim is probably right—off-axis Type II jets cannot explain the soft, moderately energetic EP FXTs—but the 3-sigma framing is built on three upper limits and a per-patch Amati input that deserves sensitivity checking. the 3 major comments →
Einstein Probe Fast X-ray Transients Extend the Physical Parameter Space of Relativistic Jets
The pith
A machine-rendered reading of the paper's core claim, the machinery that carries it, and where it could break.
Core claim
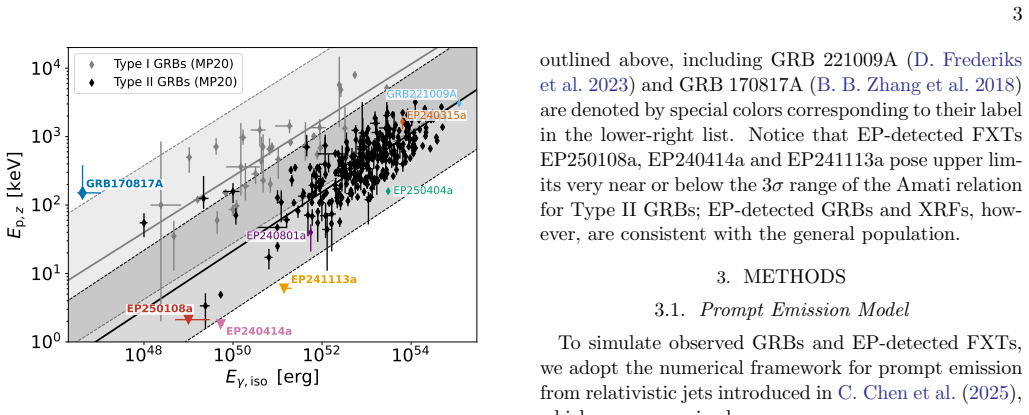
The central claim is a negative result with positive consequences: no standard Type II collapsar jet, whether a smooth Gaussian or a narrow core with a power-law wing, can be placed at any viewing angle and made to reproduce the measured (or lower-limit) spectral peaks of the bright FXTs. In every simulated jet, off-axis observers see emission that is weaker in total energy, but the spectral peak energy stays high or rises because the patches that dominate are Doppler-boosted toward the line of sight. The FXT events sit more than 3 sigma below the Amati correlation that anchors the models and below the X-ray-flash region, so the paper concludes that they are probing an intrinsically differen
What carries the argument
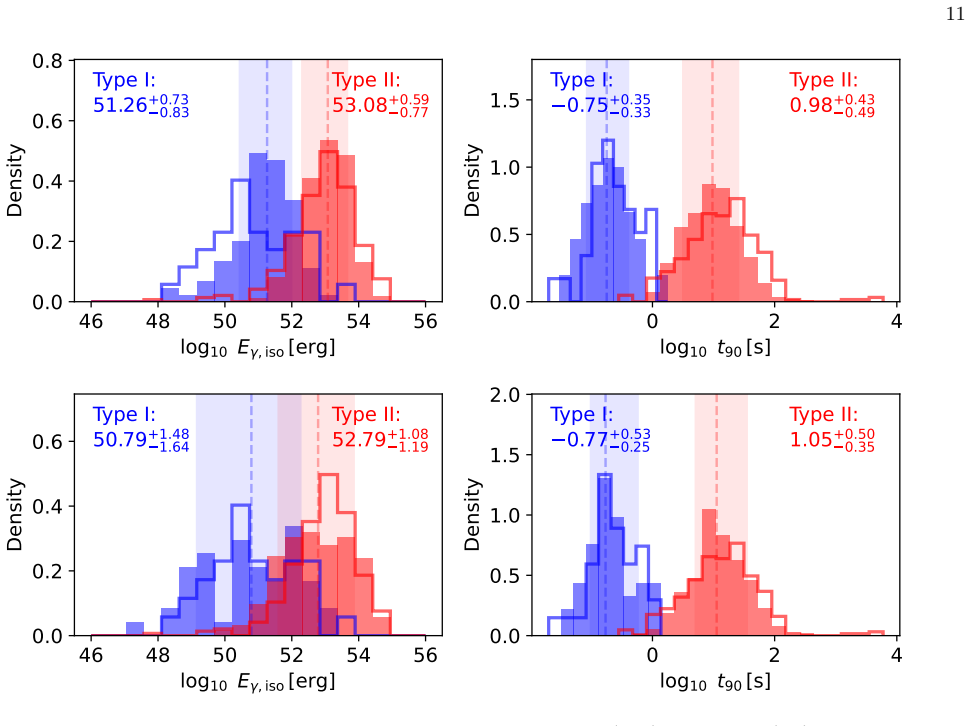
The carrying engine is a structured-jet prompt-emission simulator that tiles the jet into patches, assigns each patch a Band-function spectrum with its peak energy tied to the local isotropic energy through the empirical Amati relation, Doppler-transforms each patch using the ratio of on- to off-axis Doppler factors (R_D, with energy scaling as R_D^3), and sums over the equal-arrival-time surface. Two jet structures are used: a single-component Gaussian and a multi-component core-plus-wing profile. Detection is then filtered through a Swift/BAT-like trigger threshold so the simulated population can be compared directly with the observed E_iso-E_p plane.
Load-bearing premise
The model assumes that the intrinsic brightness-peak correlation measured from mostly head-on bursts also holds for every off-axis patch of the jet; if that link fails at large angles, the simulated plane cannot be trusted.
What would settle it
A decisive test: obtain a secure rest-frame spectral peak for a bright FXT (E_iso greater than about 1e51 erg) instead of an upper limit. If the measured E_p,z falls on the extended Amati scatter, the new-parameter-space conclusion collapses to a selection effect; if it stays below the model boundary while remaining gamma-ray-quiet, the claim survives. A complementary check is to measure the Lorentz factor from afterglow onset and look for values an order of magnitude below canonical GRBs.
If this is right
- The E_iso-E_p plane can be populated by single- and multi-component structured jets, and off-axis viewing reproduces low-luminosity GRBs and GRB 170817A-like events.
- Moderately off-axis observers of structured jets can reach the soft X-ray-flash region at the low-energy end of the Amati correlation.
- But the brighter FXTs with E_iso above about 1e51 erg and E_p below about 2 keV lie more than 3 sigma below the simulated plane's boundary, so geometry alone cannot place them there.
- If the paper is right, FXT spectra imply intrinsically softer emission physics: lower bulk Lorentz factors, higher baryon loading, or different dissipation mechanisms than standard Type II jets.
- The same models predict that events with gamma-ray counterparts should fall on the ordinary GRB relation, which they do, sharpening the contrast with gamma-ray-quiet FXTs.
Where Pith is reading between the lines
- A testable consequence the paper leaves implicit: if FXTs are baryon-loaded, low-Lorentz-factor outflows, their afterglow radio-to-X-ray ratios should differ systematically from classical GRBs, so targeted radio follow-up of gamma-ray-quiet FXTs can distinguish the classes.
- The paper's logic implies that any future FXT with high E_iso and a securely measured (not upper-limit) spectral peak would directly map the low-Lorentz-factor parameter space, turning EP into a population factory for a jet regime that gamma-ray instruments systematically miss.
- The same per-patch construction could be pushed further by modeling the spectral peak as a function of local Lorentz factor and baryon loading instead of local energy, predicting where FXTs, XRFs, and low-luminosity GRBs should separate in the plane.
- If a large fraction of stellar collapses produce such soft jets, the volumetric rate implied by EP detections could exceed the rate of classical long GRBs, suggesting that this regime was simply invisible to past gamma-ray telescopes.
Editorial analysis
A structured set of objections, weighed in public.
Referee Report
Summary. This paper tests the hypothesis that Einstein Probe (EP) fast X-ray transients (FXTs) are the off-axis counterparts of standard Type II GRBs. The authors use a numerical jet model with single-component Gaussian and multi-component core+wing structures, apply Swift/BAT and Konus-Wind detectability criteria, and simulate Type I and Type II GRB populations in the E_iso–E_p plane. They find that the simulated populations reproduce the observed distributions of classical GRBs, low-luminosity GRBs, and X-ray flashes, but that the three energetic EP-FXTs with E_p upper limits ~1–2 keV fall more than 3σ below the simulated/Amati region. They conclude that viewing-angle effects of canonical Type II jets cannot explain these FXTs, pointing instead to intrinsically lower Lorentz factors, higher baryon loading, or alternative jet structures and emission mechanisms.
Significance. If the conclusion holds, the EP FXT sample opens a new window on relativistic jet parameter space, and the paper's framework provides a useful tool for comparing structured-jet models to population-level observations. Strengths include the explicit treatment of jet structure, detectability, and the explicit acknowledgment of the Amati-extrapolation caveat. The central claim is qualitatively supported by basic Doppler scalings (E_p ∝ R_D, E_iso ∝ R_D^3), so an off-axis standard jet should appear harder, rather than softer, at a given E_iso. However, the quantitative ">3σ" exclusion is currently conditional on the per-patch application of the Amati relation and lacks a formal statistical test. The work is likely to be influential for interpreting the growing EP FXT sample, provided the robustness concerns below are addressed.
major comments (3)
- [§3.1, Eq. (10); §5.3] The simulated E_iso–E_p envelope is controlled by the input Amati relation, which is applied per patch. The paper's central exclusion—that no standard Type II jet reaches the FXT region—is therefore conditional on the extrapolation of the Amati relation to jet wings and far off-axis material. The authors acknowledge this in §5.3 but do not test how much the boundary moves if the intrinsic E_p–E_iso relation in wings is softer, has a floor, or has larger scatter than the deterministic mapping used. As written, the abstract's "cannot account" overstates the conclusion. Please add robustness tests (e.g., varying b_II or the slope in wings, introducing a low-E_p floor, or adding per-patch intrinsic scatter) to show the exclusion is not an artifact of Eq. (10).
- [§4, §5.2; Figs. 6–7] The ">3σ outlier" claim is not quantified against the model. The figures compare FXTs to the observed Amati 3σ band, but since the simulation is generated from that same relation, the comparison is partly circular. No p-value or confidence level is computed from the simulated distribution, and the three key FXT E_p values are upper limits. Please provide a statistical statement (e.g., the fraction of simulated bursts that fall at or below the FXT upper limits, given the detection criteria and the model's full scatter) or temper the quantitative claim to an upper-bound exclusion.
- [§2 and Figs. 1, 6–7] FXT E_iso values are reported in the 0.5–4 keV band while the Amati relation and simulated E_iso are in the 1–10^4 keV band. The paper never states whether a bolometric correction is applied. Using the soft-band E_iso shifts the FXTs leftward in the plane; a bolometric correction would move them rightward and increase the apparent offset, but it also changes the quantitative significance and the precise distance from the 3σ boundary. Please either apply and report bandpass corrections to the FXT points or explicitly justify the direct comparison.
minor comments (4)
- [§5.1] The text refers to triangles, squares, and circles for viewing-angle classes, but Figs. 6 and 7 use continuous color coding; the marker description appears to be a leftover from a previous draft and should be removed or corrected.
- [References] Liu et al. 2025a/2025b and Jiang et al. 2025a/2025b are identical in the reference list; Fong et al. 2015a/2015b are also duplicated. Consolidate or clarify.
- [§3.2.1] The parameter list defines θcut as "also referred to as θwing in some contexts," but the notation is not consistently defined elsewhere. Use a single symbol and definition.
- [Figs. 6–7 captions] The phrase "solid lines represent the detectable (full) sample" is ambiguous; specify which line corresponds to the detectable sample and which to the full simulated population.
Circularity Check
No significant circularity: the simulation uses the empirical Amati relation as an input, but the central off-axis result is a derived Doppler/geometry consequence, not an identity with the input; the Amati extrapolation is explicitly acknowledged as a limitation.
full rationale
The central claim—that viewing-angle effects of standard Type II GRB jets cannot explain the low E_p of energetic FXTs—is a model inference, not a restatement of the model's inputs. The model assigns each emitting patch an intrinsic peak energy via the empirical Amati relation (Eq. 10, 'The peak energy scales with isotropic energy via the Amati relation ... with updated coefficients ... (P. Y. Minaev & A. S. Pozanenko 2020)'), then transforms the spectrum with Doppler factors (Eqs. 12 and the R_D scaling of Eq. 8). The resulting off-axis track, E_p ∝ R_D and E_iso ∝ R_D^3, moves simulated bursts upward/harder relative to the input Amati relation because a_II = 0.43 > 1/3. This is a nontrivial consequence of the transformation, not a tautology: if the intrinsic slope were smaller, off-axis emission could soften and reach the FXT region. The paper does not fit the Amati relation to the FXT data or call that input a prediction; it uses published coefficients from an independent sample (Minaev & Pozanenko 2020) and then compares simulated populations to the observed FXT positions. The strongest concern, raised explicitly in the paper, is that applying the Amati relation to off-axis and wing emission is an extrapolation: 'We note that applying the Amati relation to off-axis emission is an extrapolation, since the empirical correlation is derived from the observed population of predominantly (near) on-axis events' (§3.1), and 'Applying this relation to off-axis emission is therefore approximate' (§5.3). That is an honest, load-bearing caveat about validity, not a circular step—it does not make the conclusion equivalent to the input, it only makes the conclusion conditional. Self-citations (e.g., C. Chen et al. 2025 for the numerical framework; B. Zhang et al. 2004 for quasi-universal jet structure) are methodological and are not used to assert uniqueness or forbid alternatives. No quoted reduction shows that Eq. X equals Eq. Y by construction or that a fitted parameter is renamed as a prediction. The observed FXT outlier status is an external benchmark; the model's inability to reach it is a derived, falsifiable statement conditional on the stated Amati extrapolation.
Axiom & Free-Parameter Ledger
free parameters (6)
- Amati intercept b_II (Type II) =
-0.24 ± 0.06
- Amati slope a_II (Type II) =
0.43 ± 0.03
- Lorentz-factor normalization Γ0 =
≈ 180
- Intrinsic Band peak E_p,0 =
≈ 600 keV
- Multi-component wing parameters (A_w, k_w) =
A_w = 1e-2 (σ 0.5 dex); k_w = 4 (σ 0.5)
- Jet core width θ_j and cutoff θ_cut =
θ_j ≈ 3° (log-normal); Type II θ_cut = 4 θ_j
axioms (6)
- domain assumption Amati relation (Eq. 10) can be applied per-patch to the on-axis emission of every jet patch, including wings and large-angle regions.
- standard math Off-axis Doppler scaling: E_iso ∝ R_D^3 and E_p ∝ R_D (Eqs. 7, 8 and discussion in Section 4).
- domain assumption Γ(E_iso) relation (Eq. 4) holds for all patches, including low-luminosity wings.
- domain assumption Prompt spectrum of every patch is a Band function with α = −1, β = −2.3.
- domain assumption Swift/BAT 5σ threshold (Eq. 25) with sliding integration windows adequately represents detectability.
- domain assumption Redshift distributions: Type II follow SFR (Yüksel 2008), Type I follow SFR + delay (Zhu 2021).
read the original abstract
Fast X-ray Transients (FXTs) detected by the Einstein Probe (EP) mission possess exceptionally low spectral peak energies compared to typical long (Type II) GRBs. Some of these extragalactic transients show phenomenological similarities to X-ray flashes (XRFs), but the physical origins of FXTs remain uncertain. In this work, we investigate EP-detected FXTs using various jet structures relevant to Type II GRBs and test the hypothesis that these FXTs belong to the intrinsically same population of known GRBs but viewed at large angles from the jet axis. We apply detectability estimates to evaluate their distribution in the observed E_iso-E_p plane. We find that standard single- and multi-component jet structures can reproduce the energetics of off-axis events such as GRB 170817A and low-luminosity GRBs (llGRBs), while also yielding energetics consistent with XRFs at the lower end of the E_iso-E_p continuum for moderately off-axis observers. However, viewing-angle effects of standard Type II GRBs alone cannot account for the E_p values observed in some energetic FXTs. This tension suggests that EP-detected FXTs are unlikely to be explained solely as classical GRBs viewed off-axis, and may instead probe relativistic explosions in a previously underexplored region of parameter space. In particular, these transients may be associated with lower Lorentz factors, reduced angular momentum in the collapsing core, or alternative jet structures and emission mechanisms. Our results motivate further studies to test these scenarios and constrain the physical properties of FXT progenitors and their outflows.
Figures




Reference graph
Works this paper leans on
-
[1]
2002, A&A, 390, 81, doi: 10.1051/0004-6361:20020722
Amati, L., Frontera, F., Tavani, M., et al. 2002, A&A, 390, 81, doi: 10.1051/0004-6361:20020722
-
[2]
1993, ApJ, 413, 281, doi: 10.1086/172995
Band, D., Matteson, J., Ford, L., et al. 1993, ApJ, 413, 281, doi: 10.1086/172995
doi:10.1086/172995 1993
-
[3]
Baumgartner, W. H., Tueller, J., Markwardt, C. B., et al. 2013, ApJS, 207, 19, doi: 10.1088/0067-0049/207/2/19
-
[4]
L., Yang, Y.-H., Troja, E., et al
Becerra, R. L., Yang, Y.-H., Troja, E., et al. 2026, A&A, 705, A233, doi: 10.1051/0004-6361/202557612
-
[5]
2019, MNRAS, 482, 5430, doi: 10.1093/mnras/sty3110
Beniamini, P., & Nakar, E. 2019, MNRAS, 482, 5430, doi: 10.1093/mnras/sty3110
-
[6]
2014, ARA&A, 52, 43, doi: 10.1146/annurev-astro-081913-035926
Berger, E. 2014, ARA&A, 52, 43, doi: 10.1146/annurev-astro-081913-035926
-
[7]
2011, ApJL, 739, L55, doi: 10.1088/2041-8205/739/2/L55
Bromberg, O., Nakar, E., & Piran, T. 2011, ApJL, 739, L55, doi: 10.1088/2041-8205/739/2/L55
-
[8]
2018, MNRAS, 475, 2971, doi: 10.1093/mnras/stx3316
Bromberg, O., Tchekhovskoy, A., Gottlieb, O., Nakar, E., & Piran, T. 2018, MNRAS, 475, 2971, doi: 10.1093/mnras/stx3316
-
[9]
Campana, S., Mangano, V., Blustin, A. J., et al. 2006, Nature, 442, 1008, doi: 10.1038/nature04892
-
[10]
X-ray Emission Signatures of Neutron Star Mergers
Chen, C., Wang, Y., & Zhang, B. 2025, arXiv e-prints, arXiv:2505.01606, doi: 10.48550/arXiv.2505.01606
work page internal anchor Pith review Pith/arXiv arXiv doi:10.48550/arxiv.2505.01606 2025
-
[11]
Origin Of The Far Off-Axis GRB171205A
Dado, S., & Dar, A. 2017, arXiv e-prints, arXiv:1712.09319, doi: 10.48550/arXiv.1712.09319
work page internal anchor Pith review Pith/arXiv arXiv doi:10.48550/arxiv.1712.09319 2017
-
[12]
2026, arXiv e-prints, arXiv:2603.26213
Dai, C.-Y., Quirola-V´ asquez, J., Wang, Y.-H., et al. 2026, arXiv e-prints, arXiv:2603.26213. https://arxiv.org/abs/2603.26213
arXiv 2026
-
[14]
D., Chiang, J., & B¨ ottcher, M
Dermer, C. D., Chiang, J., & B¨ ottcher, M. 1999, ApJ, 513, 656, doi: 10.1086/306871
doi:10.1086/306871 1999
-
[15]
Eichler, D., Livio, M., Piran, T., & Schramm, D. N. 1989, Nature, 340, 126, doi: 10.1038/340126a0
doi:10.1038/340126a0 1989
-
[16]
2021, MNRAS, 501, 5723, doi: 10.1093/mnras/staa4048
Frontera, F. 2021, MNRAS, 501, 5723, doi: 10.1093/mnras/staa4048
-
[18]
Fong, W., Berger, E., Margutti, R., & Zauderer, B. A. 2015b, ApJ, 815, 102, doi: 10.1088/0004-637X/815/2/102
-
[19]
Frail, D. A., Kulkarni, S. R., Sari, R., et al. 2001, ApJL, 562, L55, doi: 10.1086/338119
doi:10.1086/338119 2001
-
[20]
Frederiks, D., Svinkin, D., Lysenko, A. L., et al. 2023, ApJL, 949, L7, doi: 10.3847/2041-8213/acd1eb
-
[21]
Galama, T. J., Vreeswijk, P. M., van Paradijs, J., et al. 1998, Nature, 395, 670, doi: 10.1038/27150
doi:10.1038/27150 1998
-
[22]
2019, ApJL, 877, L40, doi: 10.3847/2041-8213/ab224b
Geng, J.-J., Zhang, B., K¨ olligan, A., Kuiper, R., & Huang, Y.-F. 2019, ApJL, 877, L40, doi: 10.3847/2041-8213/ab224b
-
[23]
2011, MNRAS, 410, L47, doi: 10.1111/j.1745-3933.2010.00977.x
Ghirlanda, G., Ghisellini, G., Nava, L., & Burlon, D. 2011, MNRAS, 410, L47, doi: 10.1111/j.1745-3933.2010.00977.x
arXiv 2011
-
[24]
2022, The Astrophysical Journal, 932, 10, doi: 10.3847/1538-4357/ac6e43
Ghirlanda, G., & Salvaterra, R. 2022, The Astrophysical Journal, 932, 10, doi: 10.3847/1538-4357/ac6e43
-
[25]
2018, A&A, 609, A112, doi: 10.1051/0004-6361/201731598
Ghirlanda, G., Nappo, F., Ghisellini, G., et al. 2018, A&A, 609, A112, doi: 10.1051/0004-6361/201731598
-
[26]
2018, MNRAS, 478, 4128, doi: 10.1093/mnras/sty1214
Gill, R., & Granot, J. 2018, MNRAS, 478, 4128, doi: 10.1093/mnras/sty1214
-
[27]
Goldstein, A., Connaughton, V., Briggs, M. S., & Burns, E. 2016, ApJ, 818, 18, doi: 10.3847/0004-637X/818/1/18
-
[28]
2018, MNRAS, 479, 588, doi: 10.1093/mnras/sty1462
Gottlieb, O., Nakar, E., Piran, T., & Hotokezaka, K. 2018, MNRAS, 479, 588, doi: 10.1093/mnras/sty1462
-
[29]
Granot, J., Panaitescu, A., Kumar, P., & Woosley, S. E. 2002, ApJL, 570, L61, doi: 10.1086/340991
doi:10.1086/340991 2002
-
[31]
Irwin, C. M., & Chevalier, R. A. 2016, MNRAS, 460, 1680, doi: 10.1093/mnras/stw1058
-
[32]
2019, Nature, 565, 324, doi: 10.1038/s41586-018-0826-3
Izzo, L., de Ugarte Postigo, A., Maeda, K., et al. 2019, Nature, 565, 324, doi: 10.1038/s41586-018-0826-3
-
[34]
Jiang, S.-Q., Xu, D., van Hoof, A. P. C., et al. 2025b, ApJL, 988, L34, doi: 10.3847/2041-8213/addebf
-
[35]
2015, Physics Reports, 561, 1, doi: https://doi.org/10.1016/j.physrep.2014.09.008
Kumar, P., & Zhang, B. 2015, Physics Reports, 561, 1, doi: https://doi.org/10.1016/j.physrep.2014.09.008
-
[36]
Lamb, G. P., & Kobayashi, S. 2017, MNRAS, 472, 4953, doi: 10.1093/mnras/stx2345
-
[37]
Lamb, G. P., & Kobayashi, S. 2018, MNRAS, 478, 733, doi: 10.1093/mnras/sty1108
-
[38]
2019, MNRAS, 488, 4607, doi: 10.1093/mnras/stz2011
Lan, G.-X., Zeng, H.-D., Wei, J.-J., & Wu, X.-F. 2019, MNRAS, 488, 4607, doi: 10.1093/mnras/stz2011
-
[39]
2007, MNRAS, 375, L46, doi: 10.1111/j.1745-3933.2006.00273.x
Lazzati, D., & Perna, R. 2007, MNRAS, 375, L46, doi: 10.1111/j.1745-3933.2006.00273.x
arXiv 2007
-
[40]
Li, W. X., Zhu, Z. P., Zou, X. Z., et al. 2025, arXiv e-prints, arXiv:2504.17034, doi: 10.48550/arXiv.2504.17034
-
[41]
2010, ApJ, 725, 2209, doi: 10.1088/0004-637X/725/2/2209
Liang, E.-W., Yi, S.-X., Zhang, J., et al. 2010, ApJ, 725, 2209, doi: 10.1088/0004-637X/725/2/2209
-
[43]
2025b, Nature Astronomy, 9, 564, doi: 10.1038/s41550-024-02449-8
Liu, Y., Sun, H., Xu, D., et al. 2025b, Nature Astronomy, 9, 564, doi: 10.1038/s41550-024-02449-8
-
[44]
2021, ApJ, 907, 60, doi: 10.3847/1538-4357/abd2be
Maity, B., & Chandra, P. 2021, ApJ, 907, 60, doi: 10.3847/1538-4357/abd2be
-
[45]
Meszaros, P., & Rees, M. J. 1993, ApJ, 405, 278, doi: 10.1086/172360 17
doi:10.1086/172360 1993
-
[46]
2011, MNRAS, 413, 2031, doi: 10.1111/j.1365-2966.2011.18280.x
Bucciantini, N., & Quataert, E. 2011, MNRAS, 413, 2031, doi: 10.1111/j.1365-2966.2011.18280.x
arXiv 2011
-
[47]
Minaev, P. Y., & Pozanenko, A. S. 2020, MNRAS, 492, 1919, doi: 10.1093/mnras/stz3611
-
[48]
2015, A&A, 577, A31, doi: 10.1051/0004-6361/201424490
Mochkovitch, R., & Nava, L. 2015, A&A, 577, A31, doi: 10.1051/0004-6361/201424490
-
[49]
Mooley, K. P., Deller, A. T., Gottlieb, O., et al. 2018, Nature, 561, 355, doi: 10.1038/s41586-018-0486-3
-
[50]
1992, ApJL, 395, L83, doi: 10.1086/186493
Narayan, R., Paczynski, B., & Piran, T. 1992, ApJL, 395, L83, doi: 10.1086/186493
doi:10.1086/186493 1992
-
[51]
Norris, J. P., Bonnell, J. T., Kazanas, D., et al. 2005, ApJ, 627, 324, doi: 10.1086/430294 Paczy´ nski, B. 1998, in American Institute of Physics Conference Series, Vol. 428, Gamma-Ray Bursts, 4th Hunstville Symposium, ed. C. A. Meegan, R. D. Preece, & T. M. Koshut (AIP), 783–787, doi: 10.1063/1.55404
doi:10.1086/430294 2005
-
[52]
Pian, E., Mazzali, P. A., Masetti, N., et al. 2006, Nature, 442, 1011, doi: 10.1038/nature05082
-
[53]
Relativistic Jets in Core Collapse Supernovae
Piran, T., Nakar, E., Mazzali, P., & Pian, E. 2017, arXiv e-prints, arXiv:1704.08298, doi: 10.48550/arXiv.1704.08298
work page internal anchor Pith review Pith/arXiv arXiv doi:10.48550/arxiv.1704.08298 2017
-
[54]
2005, ApJL, 625, L91, doi: 10.1086/431237
Ramirez-Ruiz, E., Granot, J., Kouveliotou, C., et al. 2005, ApJL, 625, L91, doi: 10.1086/431237
doi:10.1086/431237 2005
-
[55]
Rossi, E., Lazzati, D., & Rees, M. J. 2002, MNRAS, 332, 945, doi: 10.1046/j.1365-8711.2002.05363.x Rouco Escorial, A., Fong, W., Berger, E., et al. 2023, ApJ, 959, 13, doi: 10.3847/1538-4357/acf830
arXiv 2002
-
[56]
2020, ApJ, 896, 166, doi: 10.3847/1538-4357/ab93cf
Ryan, G., van Eerten, H., Piro, L., & Troja, E. 2020, ApJ, 896, 166, doi: 10.3847/1538-4357/ab93cf
-
[57]
2024, ApJ, 975, 131, doi: 10.3847/1538-4357/ad6a14
Ryan, G., van Eerten, H., Troja, E., et al. 2024, ApJ, 975, 131, doi: 10.3847/1538-4357/ad6a14
-
[58]
B., & Lightman, A
Rybicki, G. B., & Lightman, A. P. 1979, Radiative processes in astrophysics
1979
-
[59]
Sakamoto, T., Lamb, D. Q., Graziani, C., et al. 2004, ApJ, 602, 875, doi: 10.1086/381232
-
[60]
Sakamoto, T., Lamb, D. Q., Kawai, N., et al. 2005, ApJ, 629, 311, doi: 10.1086/431235
doi:10.1086/431235 2005
-
[61]
Sazonov, S. Y., Lutovinov, A. A., & Sunyaev, R. A. 2004, Nature, 430, 646, doi: 10.1038/nature02748
-
[62]
Soderberg, A. M., Kulkarni, S. R., Nakar, E., et al. 2006, Nature, 442, 1014, doi: 10.1038/nature05087
-
[63]
Sun, H., Li, W. X., Liu, L. D., et al. 2025, Nature Astronomy, 9, 1073, doi: 10.1038/s41550-025-02571-1
-
[64]
2018, MNRAS, 478, L18, doi: 10.1093/mnrasl/sly061
Troja, E., Piro, L., Ryan, G., et al. 2018, MNRAS, 478, L18, doi: 10.1093/mnrasl/sly061
-
[65]
2020, MNRAS, 498, 5643, doi: 10.1093/mnras/staa2626
Troja, E., van Eerten, H., Zhang, B., et al. 2020, MNRAS, 498, 5643, doi: 10.1093/mnras/staa2626
-
[66]
2017, ApJ, 850, 161, doi: 10.3847/1538-4357/aa96af
Tsvetkova, A., Frederiks, D., Golenetskii, S., et al. 2017, ApJ, 850, 161, doi: 10.3847/1538-4357/aa96af
-
[67]
2010, MNRAS, 406, 1944, doi: 10.1111/j.1365-2966.2010.16787.x
Wanderman, D., & Piran, T. 2010, MNRAS, 406, 1944, doi: 10.1111/j.1365-2966.2010.16787.x
arXiv 2010
-
[68]
2015, MNRAS, 448, 3026, doi: 10.1093/mnras/stv123
Wanderman, D., & Piran, T. 2015, MNRAS, 448, 3026, doi: 10.1093/mnras/stv123
-
[69]
2007, ApJ, 664, 1026, doi: 10.1086/519228
Wang, X.-Y., Li, Z., Waxman, E., & M´ esz´ aros, P. 2007, ApJ, 664, 1026, doi: 10.1086/519228
doi:10.1086/519228 2007
-
[70]
Woosley, S. E., & Bloom, J. S. 2006, ARA&A, 44, 507, doi: 10.1146/annurev.astro.43.072103.150558
Pith/arXiv arXiv 2006
-
[71]
2023, A&A, 673, A20, doi: 10.1051/0004-6361/202245414
Xu, F., Huang, Y.-F., Geng, J.-J., et al. 2023, A&A, 673, A20, doi: 10.1051/0004-6361/202245414
-
[72]
2003, ApJL, 594, L79, doi: 10.1086/378736
Yamazaki, R., Yonetoku, D., & Nakamura, T. 2003, ApJL, 594, L79, doi: 10.1086/378736
doi:10.1086/378736 2003
-
[73]
I., Fang, Y., Zhang, B.-B., et al
Yin, Y.-H. I., Fang, Y., Zhang, B.-B., et al. 2025, ApJL, 989, L39, doi: 10.3847/2041-8213/adf552
-
[74]
2025, Science China
Yuan, W., Dai, L., Feng, H., et al. 2025, Science China
2025
-
[75]
Physics, Mechanics, and Astronomy, 68, 239501, doi: 10.1007/s11433-024-2600-3 Y¨ uksel, H., Kistler, M. D., Beacom, J. F., & Hopkins, A. M. 2008, ApJL, 683, L5, doi: 10.1086/591449
-
[76]
2006, Nature, 444, 1010, doi: 10.1038/4441010a
Zhang, B. 2006, Nature, 444, 1010, doi: 10.1038/4441010a
doi:10.1038/4441010a 2006
-
[77]
2018, The Physics of Gamma-Ray Bursts, doi: 10.1017/9781139226530
Zhang, B. 2018, The Physics of Gamma-Ray Bursts, doi: 10.1017/9781139226530
-
[78]
Zhang, B., Dai, X., Lloyd-Ronning, N. M., & M´ esz´ aros, P. 2004, ApJL, 601, L119, doi: 10.1086/382132
doi:10.1086/382132 2004
-
[79]
2002, ApJ, 571, 876, doi: 10.1086/339981
Zhang, B., & M´ esz´ aros, P. 2002, ApJ, 571, 876, doi: 10.1086/339981
doi:10.1086/339981 2002
-
[80]
2024, Journal of High Energy Astrophysics, 41, 42, doi: 10.1016/j.jheap.2024.01.002
Zhang, B., Wang, X.-Y., & Zheng, J.-H. 2024, Journal of High Energy Astrophysics, 41, 42, doi: 10.1016/j.jheap.2024.01.002
-
[81]
2007, ApJL, 655, L25, doi: 10.1086/511781
Zhang, B., Zhang, B.-B., Liang, E.-W., et al. 2007, ApJL, 655, L25, doi: 10.1086/511781
doi:10.1086/511781 2007
-
[82]
Zhang, B., Zhang, B.-B., Virgili, F. J., et al. 2009, ApJ, 703, 1696, doi: 10.1088/0004-637X/703/2/1696
-
[83]
Zhang, B. B., Zhang, B., Sun, H., et al. 2018, Nature Communications, 9, 447, doi: 10.1038/s41467-018-02847-3
-
[84]
Zhang, W., Woosley, S. E., & Heger, A. 2004, ApJ, 608, 365, doi: 10.1086/386300
doi:10.1086/386300 2004
-
[85]
2024, ApJ, 966, 141, doi: 10.3847/1538-4357/ad3949
Zheng, J.-H., Wang, X.-Y., Liu, R.-Y., & Zhang, B. 2024, ApJ, 966, 141, doi: 10.3847/1538-4357/ad3949
discussion (0)
Sign in with ORCID, Apple, or X to comment. Anyone can read and Pith papers without signing in.