REVIEW 4 major objections 4 minor 37 references
The intrinsic spatial position resolution of a point-contact germanium detector is non-uniform, anisotropic, and energy-dependent, reaching millimeter precision near the electrode while vanishing in the upper bulk.
Reviewed by Pith at T0; open to challenge. T0 means a machine referee read the full paper against a public rubric. the ladder, T0–T4 →
T0 review · deepseek-v4-flash
2026-08-02 00:42 UTC pith:OQIKIDET
load-bearing objection Genuinely new quantitative resolution map for pPCGe detectors, but the numbers are simulation-derived model estimates, not measured values; the qualitative picture is solid. the 4 major comments →
Intrinsic Spatial Position Resolution of P-type Point-Contact Germanium Detector
The pith
A machine-rendered reading of the paper's core claim, the machinery that carries it, and where it could break.
Core claim
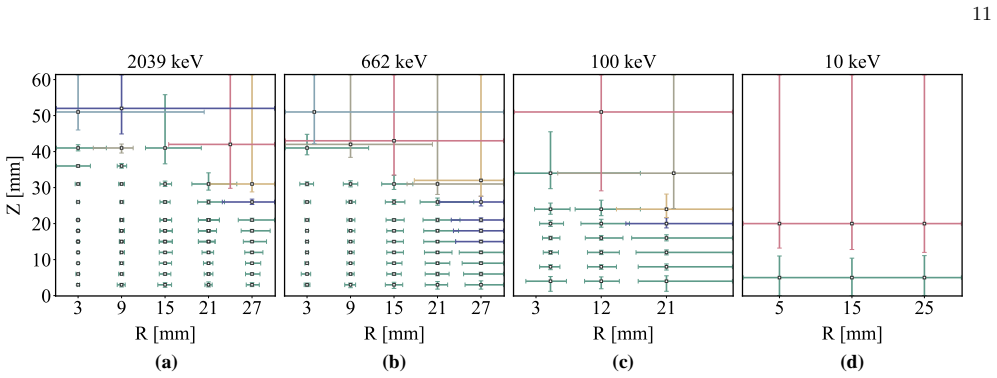
The paper's central discovery is a two-dimensional map of the intrinsic single-site spatial position resolution of the CDEX-1B detector, evaluated at 10, 100, 662, and 2039 keV. 'Intrinsic' here means the resolution set by the physics of signal formation and electronic noise, with experimental smearing from collimator width and event selection removed. The map shows three systematic features: resolution is best near the point contact and degrades outward; axial (Z) resolution is substantially better than radial (R); and the upper bulk has almost no resolving power. The authors also use a non-uniform grid built from this map to reconstruct the positions of environmental-background single-site
What carries the argument
The cross-scanning localization method, a pulse-shape comparison scan adapted to the point-contact geometry: two collimated cesium-137 beams enter from orthogonal directions, and only events whose pulse shapes match across the two samples are taken to come from the geometric intersection of the beams. The resolution criterion is a chi-square comparison between noise-only variations of a pulse at one position and variations between pulses at adjacent positions; the intrinsic resolution in each direction is the minimum distance at which fewer than 5% of adjacent-position comparisons fall below the one-sided 95% noise threshold. The underlying physics this exploits is the weighting-potential ge
Load-bearing premise
The resolution map is computed from simulated pulse shapes, and the simulation has been checked against real measurements at only a handful of collimated beam positions; if the crystal's true impurity profile or the electronics noise differs from the model, every resolution number shifts.
What would settle it
Place two collimated sources (or two collimator positions) so their beams intersect at a separation equal to the claimed intrinsic resolution at 662 keV and compare the recorded pulse-shape distributions: if their mutual chi-square distribution overlaps the noise-only distribution by more than 5%, the map overstates the resolution. Similarly, a collimated low-energy source scanning radially across the bulk should show no position dependence if the 10 keV map is right.
If this is right
- Pulse-shape databases can be built on non-uniform grids that match the resolution map: fine near the point contact, coarse in the bulk, rather than wasting grid points where pulses are indistinguishable.
- Background events in a real deployment can be localized: the roughly 610-720 keV Compton single-site events traced to the bottom outer ring of the detector, matching an environmental model with radiation entering from below.
- Dark-matter search analyses at low energy (about 10 keV) should treat the detector as essentially two-region (bulk vs fast bulk) with no useful radial position information.
- Any position estimate from pulse shape must respect the anisotropy: axial information is more reliable than radial, so orientation-aware localization or error assignment is needed.
- Rise-time-only matching has a hard limit in the degenerate regions; higher-dimensional features or machine-learning classifiers are needed to approach the physical resolution.
Where Pith is reading between the lines
- The resolution framework could be inverted as a design tool: electrode geometry, crystal dimensions, and electronics noise can be varied in simulation to predict which changes improve position resolution where rare-event backgrounds actually concentrate.
- An obvious but unstated test is to repeat the collimated scanning at low and high energies (10 keV and 2039 keV) with appropriate sources; the paper's energy dependence is calculated from simulation and currently verified only at 662 keV.
- If the same protocol were applied to other p-type point-contact detectors before deployment, their individual impurity profiles and noise characteristics would produce slightly different resolution maps, suggesting per-detector calibration rather than a universal value.
- The bottom-edge background accumulation implies that passive or active shielding design for future reactors and ton-scale arrays should target radiation from below; the paper does not draw that engineering conclusion explicitly.
Editorial analysis
A structured set of objections, weighed in public.
Referee Report
Summary. The manuscript characterizes the position-dependent pulse-shape response of the CDEX-1B p-type point-contact germanium detector and, for the first time, attempts a quantitative evaluation of its intrinsic single-site spatial position resolution. The experimental method is an optimized pulse-shape comparison scan (PSCS) using two collimated 137Cs beams, with event selection by self-screening and cross-screening. A Geant4+Siggen simulation chain is built and compared with experimental t1-50 distributions and mean pulse shapes at a limited set of collimated positions. The simulated pulses are then used to compute, for each grid point and direction, the distance to the nearest position whose pulse shape can be statistically separated at the 5% overlap criterion, yielding the resolution maps in Fig. 12. The paper also applies the resulting pulse-shape database to reconstruct environmental-background events from the Sanmen measurement, finding a bottom-accumulation pattern consistent with an approximate Geant4 background model, and discusses the R-Z degeneracy in pulse-shape matching.
Significance. If the quantitative resolution map is reliable, this is a useful result: it provides a direct estimate of the ultimate position-discrimination power of pPCGe detectors, guides pulse-shape-database grid construction, and supports background-origin studies for CDEX/RECODE and future ton-scale arrays. The paper has real strengths: the PSCS variant is tailored to the single-channel point-contact geometry; the simulation framework is full-chain (Geant4 transport, Siggen fields, electronics response, noise); and the validation shown in Figs. 9-10 demonstrates that the simulation reproduces the key qualitative features of the measured pulse morphology, including the kink feature and the Z-vs-R anisotropy. The background tracing application is a constructive demonstration of the method. However, the central quantitative claim—the mm-level intrinsic resolution values in Fig. 12—is computed entirely from simulated pulse shapes, with no independent position-tagging validation and no propagation of model uncertainties. The manuscript itself admits deviations between the linear impurity-concentration model and the real crystal (Sec. IV.B). This is the main gap between what is experimentally est
major comments (4)
- [Sec. V, Fig. 12] The central quantitative result—the intrinsic spatial position resolution map—is a pure simulation product. The resolution at each point is obtained from the χ2-noise and χ2-ab distributions in Eqs. (5)-(6), using simulated signals with injected noise. Every input to that calculation (impurity-gradient model, field/weighting-potential solution, drift model, noise amplitude, electronics response) directly scales the χ2 separation, so model error propagates into the reported mm values. The experimental validation in Sec. IV is limited to t1-50 histograms and mean pulse shapes at a small set of collimated positions; it tests gross pulse morphology, not the pairwise distinguishability margins that define resolution. The manuscript explicitly states 'minor deviations between the linear impurity concentration model adopted in the simulation and the actual gradient profile of the crystal' (Sec.
- [Sec. V vs. Sec. VI.C] The quantity called 'intrinsic spatial position resolution' is defined as the nearest distinguishable position along the R or Z axis at fixed other coordinate. But Sec. VI.C and Fig. 15 show a strong R-Z degeneracy in pulse-shape features: pulses at (larger R, smaller Z) can closely resemble pulses at (smaller R, larger Z). Therefore a 1D resolution value along a coordinate axis does not describe the actual localization capability in the 2D detector volume; a position may be confused with an off-axis position lying on the degenerate contour. This should be stated explicitly in Sec. V, and ideally quantified (e.g., the extent of degenerate contours) so that the Fig. 12 map is not interpreted as a true 2D position-resolution map.
- [Sec. IV.B, Eqs. (5)-(6)] The discrimination criterion in Sec. V depends on the simulated noise amplitude and on the normalization of the pulses, but the manuscript does not report how the noise amplitude was calibrated to the real CDEX-1B electronics or how sensitive the 5% overlap threshold is to that calibration. Since Fig. 11 is presented as a schematic, the actual χ2_noise distribution should be compared with the measured pulse-to-pulse variability at a fixed collimated position. This would provide a direct, position-tagged check of the central resolution criterion rather than only of mean pulse shapes. Without this calibration step, the absolute mm values in Fig. 12 remain model-dependent.
- [Sec. VI.A, Fig. 13] The position-reconstruction validation uses the same simulation database and the same χ2 matching logic as the resolution map. It demonstrates that the simulated database can reproduce the macroscopic collimation-line morphology, but it is not an independent verification of the mm-level resolution claim: the reconstruction does not have an external position tag with known mm accuracy. The 'upturn' near R<10 mm in Fig. 13(a), attributed to degeneracy, is itself a sign that the effective localization accuracy is position-dependent and can be worse than the local R/Z resolution values. Please discuss how the Fig. 12 resolution values relate to the actual reconstruction accuracy observed in Fig. 13.
minor comments (4)
- [Eq. (5)] After Eq. (5), define precisely what is meant by 'normalized' pulse shapes: are the pulses amplitude-normalized before calculating χ2? Is there time alignment? The number of sampling points N and the time window should be specified because they enter the χ2 scale and therefore the 95% threshold.
- [Fig. 12] The caption describes the bar lengths as the resolution; using 'error bars' in the caption is confusing because they are not statistical uncertainties. Rephrase to avoid misinterpretation and add a statement that no systematic uncertainties are shown.
- [General] There are minor copyediting issues: 'volumn' in Fig. 1, '0νββdecay' missing space, 'ground-breakingly' is informal, and the t1-50 notation appears with inconsistency (e.g., 't1−50%' vs. 't1−50').
- [Sec. III.A] The retained-event fraction (1/30 to 1/15) and final 40-60 events are described as optimized but no uncertainty or sensitivity analysis is given for the final extracted pulse shapes. Since these choices affect the mean pulse shapes used in validation, it would be helpful to state their effect on the extracted PSCS responses.
Circularity Check
No significant circularity: the resolution is defined operationally from simulated pulse pairs and anchored to external collimated-scan data; admitted model-fidelity caveats are correctness issues, not circular reductions.
full rationale
The derivation chain is a forward model: geometry + linear-gradient impurity model (Sec. III.B) -> Siggen/Geant4 pulses -> experimental validation against collimated 662-keV scans (Figs. 9-10) -> operational definition of resolution via the 95% noise-only chi2 threshold and 5% overlap of chi2_ab (Eqs. 5-6, Sec. V) -> resolution map. No step reduces to its own output by construction. The chi2_limit is an explicit statistical definition, not a fitted parameter; the resolution is not obtained by inverting the same experimental data used to set it. The validation is against measured t1-50 distributions and PSCS-extracted mean pulses, not against the resolution map itself. The paper's own caveat, 'minor deviations between the linear impurity concentration model adopted in the simulation and the actual gradient profile of the crystal' (Sec. IV.B), is an important model-fidelity/robustness limitation: model error propagates into the quantitative mm-level resolution values. That is a correctness/validation concern, not circularity, because the model is not tuned to force the reported resolution numbers. The only self-citation ([25]) supports the identification of fast bulk events and a qualitative 10-keV consistency statement; it is not load-bearing for the central quantitative result and is an externally falsifiable experimental observation, so under the given rules it does not raise the circularity score. The Sec. VI position-tracing comparisons are applications/self-consistency checks, not inputs to the resolution definition. Overall, no circular step is quoteable from the paper's equations or citation chain.
Axiom & Free-Parameter Ledger
free parameters (5)
- Retained event count in cross-screening =
40–60 events (≈1/300 of dataset)
- Self-screening retention fraction =
1/30 to 1/15 of original dataset
- Chi2_limit confidence level and overlap tolerance =
one-sided 95% CI; 5% overlap
- Impurity concentration linear gradient =
not stated (simulation input)
- Noise amplitude in simulation =
not stated
axioms (6)
- standard math Shockley-Ramo theorem governs signal induction
- domain assumption Geant4 and Siggen accurately simulate particle transport and pulse formation for HPGe detectors
- domain assumption Zero space-charge weighting potential and linear impurity gradient
- domain assumption Charge cloud size, diffusion, and self-repulsion are negligible
- domain assumption The 662 keV 137Cs source calibration pulse shapes generalize to other energies
- domain assumption Crystal axis effects are correctly modeled
read the original abstract
The p-type point-contact germanium detectors have emerged as the ideal detection technology for rare-event experiments such as direct dark matter searches and neutrinoless double beta decay, and have been verified to be capable of single-site spatial position resolution. Accurately characterizing the position-dependent pulse shape responses of the detector is a crucial prerequisite for deepening background understanding and achieving background reduction. Relying on an optimized cross-scanning localization method and a full-chain physical framework, this study extracted the pulse shape responses in critical regions of the CDEX detector, quantitatively evaluated its intrinsic spatial position resolution for the first time, and ultimately achieved the position tracing of real environmental backgrounds using the constructed pulse shape database. This study completely establishes a physical analysis closed-loop for spatial position resolution, providing critical theoretical and technical support for background analysis in future ton-scale arrays.
Figures




Reference graph
Works this paper leans on
-
[1]
Since the weighting potential in the vast peripheral region is extremely low, the contribution of electron drift to the net induced charge is negligible
Hole-dominated signals:In p-type detectors, holes drift toward the central point-contact, while electrons drift toward the outer surface. Since the weighting potential in the vast peripheral region is extremely low, the contribution of electron drift to the net induced charge is negligible. Consequently, the output signal is primarily determined by the co...
-
[2]
This results in a distinctive, prolonged flat baseline or an extremely slow rising component in the initial phase of the pulse shape
Drift phase characteristics:When holes drift through the bulk region whereϕ≈0, they induce minimal charge on the electrode. This results in a distinctive, prolonged flat baseline or an extremely slow rising component in the initial phase of the pulse shape
-
[3]
This leads to a sudden and steep rising edge at the end of the drift path
F ast rising edge:Significant charge induction is stimulated only when holes enter the high weighting potential region near the point-contact. This leads to a sudden and steep rising edge at the end of the drift path. Based on the aforementioned physical mechanisms, the pulse shape is strictly dependent on the spatial position of the initial energy deposi...
-
[4]
These conclusions possess fundamental reference value for guiding the future construction of pulse shape databases
Energy dependence:Higher event energies cor- relate with superior detector resolution. These conclusions possess fundamental reference value for guiding the future construction of pulse shape databases. VI. SP A TIAL POSITION TRACING OF BACKGROUND EVENTS AND RESUL T ANAL YSIS A. Construction of the pulse shape database and validation of event localization...
2039
-
[5]
Spatial non-uniformity:Overall, the detector’s pulse shape discrimination capability is optimal in the fast bulk region (particularly in the vicinity of the point-contact), and progressively degrades ra- diating outward from this center
-
[6]
Anisotropy:The resolution in the axial (Z) di- rection is significantly superior to that in the radial (R) direction, which strictly maps the physical dis- tribution characteristics of the weighting potential 10 gradient
-
[7]
Resolution blind spots:The bulk region at the top of the detector possesses almost no effective position resolution
-
[9]
P. N. Luke, F. S. Goulding, N. W. Madden et al., IEEE Trans. Nucl. Sci., 36(1): 926-930 (1989). doi: 10.1109/23.34577
-
[10]
P. S. Barbeau, J. I. Collar, and O. Tench, J. Cosmol. As- tropart. Phys., 2007(09): 009 (2007). doi: 10.1088/1475- 7516/2007/09/009
doi:10.1088/1475- 2007
-
[11]
A. K. Soma, M. K. Singh, L. Singh et al., Nucl. Instrum. Meth. A, 836: 67-82 (2016). doi: 10.1016/j.nima.2016.08.044
-
[14]
H. T. Wong, H. B. Li, S. T. Lin et al., Phys. Rev. D, 75(1): 012001 (2007). doi: 10.1103/PhysRevD.75.012001
-
[16]
J. P. Cheng, K. J. Kang, J. M. Li et al., Annu. Rev. Nucl. Part. Sci., 67(1): 231-251 (2017). doi: 10.1146/annurev- nucl-102115-044842
doi:10.1146/annurev- 2017
-
[18]
H. Acharya et al. (LEGEND Collaboration), Phys. Rev. Lett., 136(2): 022701 (2026). doi: 10.1103/25tk-nctn
-
[19]
N. Abgrall et al. (LEGEND Collaboration), arXiv: 2107.11462. doi: 10.48550/ARXIV.2107.11462
-
[20]
R. J. Cooper, D. C. Radford, K. Lagergren et al., Nucl. Instrum. Meth. A, 629(1): 303-310 (2011). doi: 10.1016/j.nima.2010.11.029
-
[21]
S. I. Alvis et al. (Majorana Collaboration), Phys. Rev. C, 99(6): 065501 (2019). doi: 10.1103/PhysRevC.99.065501
-
[22]
K. J. Kang et al. (CDEX Collaboration), Front. Phys., 8(4): 412-437 (2013). doi: 10.1007/s11467-013-0349-1
-
[23]
K. J. Kang, J. P. Cheng, Y. H. Chen et al., J. Phys.: Conf. Ser., 203: 012028 (2010). doi: 10.1088/1742- 6596/203/1/012028
doi:10.1088/1742- 2010
-
[24]
E. Aguayo, M. Amman, F. T. Avignone et al., Nucl. Instrum. Meth. A, 701: 176-185 (2013). doi: 10.1016/j.nima.2012.11.004
-
[25]
S. K. Liu et al. (CDEX Collaboration), Phys. Rev. D, 90(3): 032003 (2014). doi: 10.1103/PhysRevD.90.032003
-
[26]
W. Zhao et al. (CDEX Collaboration), Phys. Rev. D, 93(9): 092003 (2016). doi: 10.1103/PhysRevD.93.092003
-
[27]
H. Jiang et al. (CDEX Collaboration), Phys. Rev. Lett., 120(24): 241301 (2018). doi: 10.1103/Phys- RevLett.120.241301
doi:10.1103/phys- 2018
-
[28]
H. Ma, Z. She, Z. Liu et al., J. Phys.: Conf. Ser., 1468(1): 012070 (2020). doi: 10.1088/1742-6596/1468/1/012070
-
[29]
relies on data acquired using two collimatedγ-ray sources incident from specific directions (typically or- thogonal) to achieve waveform sampling at specific po- sitions within the detector. Theoretically, for position- sensitive detectors, when evaluating the two separately acquired datasets (denoted as the horizontal datasetH and the vertical datasetV),...
2039
-
[30]
L. T. Yang et al. (CDEX Collaboration), Chinese Phys. C, 42(2): 023002 (2018). doi: 10.1088/1674- 1137/42/2/023002
doi:10.1088/1674- 2018
-
[31]
H. B. Li, L. Singh, M. K. Singh et al., Astroparticle Physics, 56: 1-8 (2014). doi: 10.1016/j.astropartphys.2014.02.005
-
[32]
L. T. Yang, H. B. Li, H. T. Wong et al., Nucl. Instrum. Meth. A, 886: 13-23 (2018). doi: 10.1016/j.nima.2017.12.078
-
[33]
R. M. J. Li, S. K. Liu, S. T. Lin et al., NUCL SCI TECH, 33(5): 57 (2022). doi: 10.1007/s41365-022-01041-x
-
[34]
Shockley, Journal of Applied Physics, 9(10): 635-636 (1938)
W. Shockley, Journal of Applied Physics, 9(10): 635-636 (1938). doi: 10.1063/1.1710367
- [35]
-
[36]
Z. He, Nucl. Instrum. Meth. A, 463(1-2): 250-267 (2001). doi: 10.1016/S0168-9002(01)00223-6
-
[37]
F. C. L. Crespi, F. Camera, B. Million et al., Nucl. Instrum. Meth. A, 593(3): 440-447 (2008). doi: 10.1016/j.nima.2008.05.057
-
[38]
S. Agostinelli, J. Allison, K. Amako et al., Nucl. Instrum. Meth. A, 506(3): 250-303 (2003). doi: 10.1016/S0168- 9002(03)01368-8
doi:10.1016/s0168- 2003
-
[39]
D. C. Radford, mjd fieldgen and mjd siggen software (2025). https://github.com/radforddc/icpc siggen
2025
-
[40]
S. E. Boggs and S. N. Pike, Exp Astron, 56(2-3): 403-420 (2023). doi: 10.1007/s10686-023-09914-8
-
[41]
B. De Canditiis and G. Duchˆ ene, Eur. Phys. J. A, 56(10): 276 (2020). doi: 10.1140/epja/s10050-020-00287-6
-
[42]
L. T. Yang, Y. F. Liang, and Q. Yue, RECODE Program for Reactor Neutrino CEvNS Detection with PPC Ger- manium Detector, in Proceedings of XVIII International Conference on Topics in Astroparticle and Underground Physics — PoS(TAUP2023) (University of Vienna: Sissa Medialab, 2024), p. 296. doi: 10.22323/1.441.0296
discussion (0)
Sign in with ORCID, Apple, or X to comment. Anyone can read and Pith papers without signing in.