REVIEW 4 major objections 5 minor 103 references
S-PLUS DR5 presents a uniformly calibrated 12-band photometric survey of 4,592 square degrees and grows the known Hydra–Antlia cluster membership from 462 to 1,706 objects.
Reviewed by Pith at T0; open to challenge. T0 means a machine referee read the full paper against a public rubric. the ladder, T0–T4 →
T0 review · deepseek-v4-flash
2026-08-01 22:00 UTC pith:76WRTZRC
load-bearing objection Solid, useful data-release paper; the Gaia-XP-based calibration is credible but the blue end is the least independently checked, and the photo-z validation needs a clearer independent split. the 4 major comments →
The S-PLUS Fifth Data-Release: Over 4500 square degrees of the Southern Sky and a multicolor view of the Hydra and Antlia galaxy clusters
The pith
A machine-rendered reading of the paper's core claim, the machinery that carries it, and where it could break.
Core claim
The central claim is that S-PLUS DR5 is a uniformly calibrated, 12-filter survey covering 4,592 square degrees in 2,491 fields, with photometric depths reaching 21.5 mag in r (S/N≥3) and a photometric-redshift scatter of 0.0248 (σ_NMAD) with a 1.44% outlier fraction for r-band 14–21 galaxies. The release claims the first systematic coverage of fields adjacent to the Galactic bulge and disk (about 110 square degrees), enabled by a new astrometric pipeline that handles crowded fields, and a calibration anchored to synthetic magnitudes from Gaia DR3 XP spectra in 11 bands with u-band zero-points derived from SED fitting; the internal Gaia-G offset is 3.8 mmag. Applying the data to the Hydra and
What carries the argument
The 12-filter Javalambre photometric system (five broad bands—u,g,r,i,z—and seven narrowbands, e.g., J0660 for Hα) is the observing instrument, but the machinery that carries the argument is the calibration chain: synthetic magnitudes from Gaia DR3 XP spectra serve as reference for 11 bands, the u-band zero-point is predicted by fitting SEDs to those 11 calibrated bands, and the mode of the instrumental-minus-reference magnitude distribution fixes each field's zero-point. This chain is what makes the 4,592-square-degree footprint uniform and extinction-aware. On the science side, the shifting-gapper technique plus photo-z odds>0.6 defines cluster membership, and the narrowband J0660 excess (
Load-bearing premise
The entire survey's photometric scale rests on assuming the synthetic magnitudes computed from Gaia DR3 XP spectra are accurate in 11 bands and that the u-band zero-point can be predicted by fitting those 11 bands; if that reference is biased, especially in the blue, the bias flows into every magnitude, photometric redshift, extinction value, and cluster membership list.
What would settle it
Obtain independent photometric zero-points for the u band and at least one blue narrowband (e.g., J0378) in a handful of DR5 fields using standard-star observations; if the differences from DR5 values correlate with stellar color or extinction and exceed the stated few-mmag internal scatter, the Gaia-XP-anchored calibration chain is falsified and the photo-z and cluster-membership results built on it are biased.
If this is right
- If the calibration is sound, all 113 million detections share a single homogeneous photometric scale, so fields can be combined for Galactic-structure and large-scale-structure studies without region-dependent corrections.
- The first bulge/disk coverage opens S-PLUS to studies of crowded stellar populations, metal-poor star searches, Cepheid period-luminosity relations, and variable stars in the Galactic plane.
- The value-added catalogs (photo-zs, SQG, masks, extinction coefficients, overlap flags, unique IDs) make the release directly usable; photo-z scatter of 0.0248 and outlier fraction 1.44% support cluster and large-scale structure analyses.
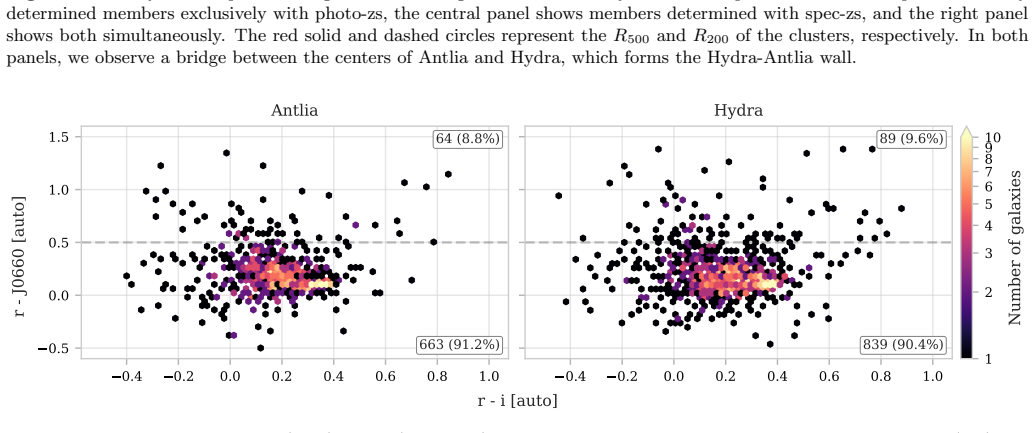
- For Hydra and Antlia, the data imply both clusters contain roughly 9% Hα-excess galaxies, with an increasing fraction toward larger radius and Hydra's core hosting about twice Antlia's core fraction, pointing to environmental quenching differences.
- The 'bridge' between the clusters appears in both photometric and spectroscopic member maps, supporting the existence of a Hydra–Antlia wall/filament in the local Universe.
Where Pith is reading between the lines
- The Gaia-anchored calibration decouples S-PLUS from external photometric catalogs; if it holds, future releases and the planned full 9,300-square-degree footprint can be added without re-deriving zero-points, making DR5 a template for survey calibration.
- The same calibration chain means any wavelength-dependent error in Gaia XP spectra—especially in the blue where u and J0378–J0430 live—would propagate into photo-zs, extinction coefficients, and the Hα-excess fractions; this is testable by comparing DR5 blue zero-points against independent standard-star observations.
- The cluster-member expansion (1,706 members, mostly photo-z selected) likely includes interlopers at the 5×R200 outskirts despite the gapper; spectroscopic follow-up of a random subset of the 1,244 new members would quantify the contamination and harden the bridge detection.
- The Hα-excess comparison could be sharpened by continuum subtraction (three-filter method or SED fitting); applying the same J0660-excess measurement to other S-PLUS clusters would show whether the Hydra/Antlia radial trends are generic in low-richness environments.
Editorial analysis
A structured set of objections, weighed in public.
Referee Report
Summary. This paper presents the fifth data release (DR5) of the Southern Photometric Local Universe Survey (S-PLUS): 4592 square degrees, 2491 fields, and over 113 million detections in the 12-filter Javalambre system. It introduces the MAR reduction pipeline for 2200 fields, a Gaia DR3 XP-spectra-based calibration, and several value-added catalogs (star/galaxy/QSO classification, photometric redshifts, bright-star masks, extinction coefficients, overlap-region flags, unique IDs). It is the first S-PLUS release covering the Galactic bulge/disk region, and it presents a representative science application to the Hydra and Antlia clusters, reporting 1706 cluster members (up from 462) and a comparative analysis of H-alpha-excess galaxies. The paper argues that DR5 provides a uniformly calibrated, publicly accessible multicolor survey suitable for stellar and extragalactic science.
Significance. If the calibration and photo-z validation concerns are resolved, DR5 would be a major community resource. The area increase, the first bulge/disk coverage, the public TAP access, the new masks with quantified false-positive/false-negative rates, and the overlap flags and unique IDs are concrete contributions that will benefit many science cases. The paper also makes reproducible data products available and cites the separately published MAR pipeline. The cluster application is illustrative but potentially valuable for nearby-cluster studies. However, the release's central promise of a uniform 12-band photometric scale rests on the Gaia XP anchoring, and the photo-z and cluster-membership claims need stronger independent validation.
major comments (4)
- [Section 4.2.2] The calibration anchor is a potential common-mode bias. Synthetic Gaia XP magnitudes are used as references for 11 of the 12 S-PLUS bands, and the quoted 3.8 mmag check between predicted and observed Gaia G/BP/RP magnitudes validates internal consistency with XP, not the absolute accuracy of XP. Any wavelength-dependent error in the XP blue end, where u and the blue narrowbands lie, would propagate into all zero-points, photo-zs, extinction coefficients, and the cluster analysis. The u band is additionally inferred by SED fitting outside XP coverage. Please add an independent validation: compare S-PLUS blue and u-band photometry against external spectrophotometric standards or against other surveys not anchored to XP, and quantify how a plausible blue systematic (e.g., 1-3%) would affect the value-added products.
- [Section 5.1] The photometric-redshift performance metrics are quoted for the 'entire sample' (sigma_NMAD = 0.0248, bias = -5.03e-4, outlier fraction = 1.44%) and for five magnitude bins, but the paper does not state whether these metrics are computed on a held-out test set or on the training sample. Since the BMDN is trained on 867,636 galaxies, metrics evaluated on the training sample would be optimistically biased. Please specify the train/validation/test split and report the same metrics, including bin-wise outlier fractions, on an independent spectroscopic sample.
- [Section 5.1] The cluster photo-z bias correction is circular as presented. Gaussian fits are made to the spec-z and photo-z histograms of the same Antlia and Hydra clusters, and the measured shifts (0.0022 and 0.0027) are then applied as global corrections to the photo-zs used for membership selection. Because the same clusters define both the correction and the subsequent member sample, the reported member counts and radial H-alpha fractions are not independently calibrated. The method is also referenced as 'Mendes de Oliveira et al., in prep.' Please validate the shift with an out-of-sample procedure (e.g., leave-one-cluster-out or a spec-z subset not used in the fit), report the uncertainty on the shift, and quantify how the membership catalog changes if the shift is varied by its uncertainty.
- The photometric membership selection uses a broad window: z = 0.0111 +0.015/-0.005, odds >= 0.6, and a 'broadened' shifting-gapper envelope tuned to contain at least 90% of the spectroscopic members. At z ~ 0.01, +-0.015 in redshift corresponds to roughly +-4500 km/s, which is very wide for cluster membership and likely admits substantial foreground/background contamination. Please quantify the expected interloper fraction (e.g., using background counts in the same photo-z window, or the spec-z galaxies that are not cluster members) and state its effect on the 1706-member total and on the H-alpha radial fractions in Figure 10.
minor comments (5)
- [Section 4.2.5] The ORF description is clear, but Figure 6 would benefit from a caption explicitly stating that panel (a) shows raw number density before applying the flag and panel (b) after; this is implied but not stated.
- [Section 4.2.3] The bright-star mask availability is given as a placeholder ('[will be added after the report process.]'). In a data-release paper, all URL/DOI links should be finalized before publication, not deferred.
- [References] The two Gutiérrez-Soto et al. entries (2025a and 2025b) appear to be the same paper (A&A 695, A104) but are cited as distinct works; please merge or clearly differentiate them.
- [Section 2.3.2] Minor wording: the paper says the calibration 'naturally accounts for interstellar extinction' in the reference magnitudes, but later the extinction coefficients VAC is provided separately. A brief clarification that the calibration is extinction-inclusive at the reference-star level while per-source extinction corrections are still necessary would avoid confusion.
- [Various] The phrase 'We are grateful to the referee that provided useful comments...' in the acknowledgments is inappropriate for a submitted manuscript and should be removed.
Circularity Check
No significant circularity: DR5 calibration is anchored to external Gaia XP data and photo-zs are trained on an external spec-z compilation; cluster bias correction is a transparent calibration, not a forced prediction.
full rationale
The derivation chain is not circular. The photometric scale is anchored to Gaia DR3 XP spectra (Section 2.3.2): synthetic magnitudes from XP are external references for 11 S-PLUS bands, and the u-band zero-point is obtained by SED-fitting those calibrated bands. This is a calibration against an external catalog, not a self-defined prediction; the same section's 3.8 mmag Gaia G/BP/RP check is an internal consistency check between XP-based synthetic magnitudes and Gaia observed photometry, not an independent validation of S-PLUS, so any XP blue-end systematics are a correctness risk rather than circularity. The photo-z VAC is trained on 867,636 galaxies with spectroscopic redshifts from an external Southern-Hemisphere compilation (Section 4.2.2) and is evaluated with standard metrics, providing independent content. The cluster analysis in Section 5.1 does apply a Gaussian shift to align the photo-z and spec-z distributions of the same clusters, but the fitted offsets (0.0022, 0.0027) only recenter the photo-zs; the membership count (1244 new photo-z members), the bridge, and the Hα fractions are outputs of the subsequent selection and color-color analysis, not values fixed by the fitted shift. The 'broadened shifting-gapper envelope' is calibrated to contain 90% of spec-z members, but again the resulting sample and scientific trends are data-dependent. Self-citations (MAR pipeline, photo-z method, bias-correction note) are either described in the text or supported by code/data, and no load-bearing argument reduces to an unverified self-citation. Therefore no circular step meets the quoted-evidence bar.
Axiom & Free-Parameter Ledger
free parameters (5)
- Photo-z cluster bias offsets (Antlia, Hydra) =
0.0022, 0.0027
- Photo-z BMDN model weights =
not enumerated (trained on 867,636 galaxies)
- H-alpha excess color threshold =
r - J0660 >= 0.5
- Photo-z membership selection window =
z = 0.0111 +0.015/-0.005; odds >= 0.6
- Shifting-gapper algorithm parameters =
initial bin 0.42 h^-1 Mpc; min 15 galaxies/bin; facgap min(300, |v_low-v_high|/10)
axioms (8)
- domain assumption Gaia DR3 XP spectra convolved with S-PLUS filter curves yield accurate synthetic reference magnitudes in 11 bands.
- domain assumption u-band zero-points can be predicted from SED fits to the other 11 calibrated bands.
- domain assumption The MAR and legacy jype pipelines produce sufficiently homogeneous calibrated photometry to merge all fields.
- domain assumption The Southern Hemisphere Spectroscopic Redshift Compilation (Lima 2025) is accurate and representative for training photo-zs and defining cluster members.
- domain assumption The shifting-gapper technique removes interlopers and provides unbiased cluster membership.
- domain assumption Adopted flat LCDM cosmology with H0 = 70 km/s/Mpc, Omega_m = 0.3, Omega_Lambda = 0.7.
- domain assumption RV = 3.1 with the Fitzpatrick (1999) extinction law and SFD/SFLY/GAIA3 maps provide correct extinction coefficients.
- domain assumption BMDN photo-z PDFs are well-calibrated and generalize to the cluster fields.
read the original abstract
We present the 5th data release (DR5) of the Southern Photometric Local Universe Survey (S-PLUS), covering 4592 square degrees across 2491 fields. Observations were conducted with the T80-South, a Brazilian robotic telescope equipped with the Javalambre 12-filter system, containing five broad- and seven narrowband filters. Data products feature FITS images and extensive catalogs containing fluxes, magnitudes, and shape parameters for over 113 million detections. In addition, several value-added catalogs are provided, offering photometric redshifts (photo-zs), object classifications, masks, and extinction coefficients. For the first time, this release includes coverage of 110 square degrees along the Galactic disk, facilitating new research into Galactic structure and stellar populations. The release also provides full coverage of the Hydra Supercluster and numerous other nearby clusters with improved data reduction and calibration, enhancing photo-z accuracy, which is vital for large-scale structure studies. A preliminary analysis of the Hydra and Antlia galaxy clusters up to $5 \times R_{200}$ yields an updated catalog of 1706 cluster members based on both spectroscopic and high-quality photo-zs. Our photometric data shows that both clusters have a similar proportion of galaxies with an H$\alpha$ excess relative to their clustercentric distance, though Hydra has a higher fraction near its center. Additionally, the spatial distribution of all objects in our sample highlights a bridge connecting both clusters. We verify that S-PLUS DR5 provides a solid foundation for future scientific investigations, ranging from Solar System studies to Cosmology.
Figures



Reference graph
Works this paper leans on
-
[1]
F., Argudo-Fern´ andez, M., et al
Almeida, A., Anderson, S. F., Argudo-Fern´ andez, M., et al. 2023, ApJS, 267, 44, doi: 10.3847/1538-4365/acda98
-
[2]
Almeida-Fernandes, F., SamPedro, L., Herpich, F. R., et al. 2022, MNRAS, 511, 4590, doi: 10.1093/mnras/stac284
-
[3]
Almeida-Fernandes, F., Placco, V. M., Rocha-Pinto, H. J., et al. 2023, MNRAS, 523, 2934, doi: 10.1093/mnras/stad1561
-
[4]
Beers, T. C., Flynn, K., & Gebhardt, K. 1990, AJ, 100, 32, doi: 10.1086/115487
doi:10.1086/115487 1990
-
[5]
2014, in The Third Hot-wiring the Transient Universe Workshop, ed
Bellm, E. 2014, in The Third Hot-wiring the Transient Universe Workshop, ed. P. R. Wozniak, M. J. Graham, A. A. Mahabal, & R. Seaman, 27–33, doi: 10.48550/arXiv.1410.8185
-
[6]
Belokurov, V., Zucker, D. B., Evans, N. W., et al. 2006, ApJL, 642, L137, doi: 10.1086/504797
doi:10.1086/504797 2006
-
[7]
2000, The Astrophysical Journal, 536, 571, doi: 10.1086/308947
Benitez, N. 2000, The Astrophysical Journal, 536, 571, doi: 10.1086/308947
doi:10.1086/308947 2000
-
[8]
1996, A&AS, 117, 393, doi: 10.1051/aas:1996164
Bertin, E., & Arnouts, S. 1996, A&AS, 117, 393, doi: 10.1051/aas:1996164
-
[9]
1994, Mixture density networks, Workingpaper, Aston University
Bishop, C. 1994, Mixture density networks, Workingpaper, Aston University
1994
-
[10]
Bolzonella, M., Miralles, J. M., & Pell´ o, R. 2000, A&A, 363, 476, doi: 10.48550/arXiv.astro-ph/0003380
-
[11]
Brammer, G. B., van Dokkum, P. G., & Coppi, P. 2008, The Astrophysical Journal, 686, 1503, doi: 10.1086/591786 19
doi:10.1086/591786 2008
-
[12]
2025, A&A, 694, A276, doi: 10.1051/0004-6361/202452915 Calder´ on, J
Buttitta, C., Iodice, E., Doll, G., et al. 2025, A&A, 694, A276, doi: 10.1051/0004-6361/202452915 Calder´ on, J. P., Bassino, L. P., Cellone, S. A., G´ omez, M., & Caso, J. P. 2020, MNRAS, 497, 1791, doi: 10.1093/mnras/staa2043 Calder´ on, J. P., Bassino, L. P., Cellone, S. A., et al. 2015, MNRAS, 451, 791, doi: 10.1093/mnras/stv926
-
[13]
Cardelli, J. A., Clayton, G. C., & Mathis, J. S. 1989, ApJ, 345, 245, doi: 10.1086/167900
doi:10.1086/167900 1989
-
[14]
2010, A&A, 512, A54, doi: 10.1051/0004-6361/200913204
Asplund, M. 2010, A&A, 512, A54, doi: 10.1051/0004-6361/200913204
-
[15]
Caso, J. P., & Richtler, T. 2015, A&A, 584, A125, doi: 10.1051/0004-6361/201527136
-
[16]
J., Moles, M., Crist´ obal-Hornillos, D., et al
Cenarro, A. J., Moles, M., Crist´ obal-Hornillos, D., et al. 2019, A&A, 622, A176, doi: 10.1051/0004-6361/201833036
-
[17]
Cerdosino, M. C., O’Mill, A. L., Rodriguez, F., et al. 2024, MNRAS, 528, 4993, doi: 10.1093/mnras/stae334
-
[18]
2025, ApJ, 979, 164, doi: 10.3847/1538-4357/ad8eba
Cerny, W., Chiti, A., Geha, M., et al. 2025, ApJ, 979, 164, doi: 10.3847/1538-4357/ad8eba
-
[19]
2023, ApJ, 958, 118, doi: 10.3847/1538-4357/acf4a1
Chiang, Y.-K. 2023, ApJ, 958, 118, doi: 10.3847/1538-4357/acf4a1
-
[20]
Cunningham, E. C., Hunt, J. A. S., Price-Whelan, A. M., et al. 2024, ApJ, 963, 95, doi: 10.3847/1538-4357/ad187b De Angeli, F., Weiler, M., Montegriffo, P., et al. 2023, A&A, 674, A2, doi: 10.1051/0004-6361/202243680 de Jong, R. S., Agertz, O., Berbel, A. A., et al. 2019, The Messenger, 175, 3, doi: 10.18727/0722-6691/5117
-
[21]
Deason, A. J., & Belokurov, V. 2024, NewAR, 99, 101706, doi: 10.1016/j.newar.2024.101706 DESI Collaboration, Abareshi, B., Aguilar, J., et al. 2022, AJ, 164, 207, doi: 10.3847/1538-3881/ac882b Dias dos Santos, D., Rodr ´ ıguez-Ardila, A., Panda, S., &
arXiv 2024
-
[22]
2023, ApJL, 953, L3, doi: 10.3847/2041-8213/ace974
Marinello, M. 2023, ApJL, 953, L3, doi: 10.3847/2041-8213/ace974
-
[23]
Drlica-Wagner, A., Bechtol, K., Rykoff, E. S., et al. 2015, ApJ, 813, 109, doi: 10.1088/0004-637X/813/2/109
-
[24]
2014, A&A, 570, A119, doi: 10.1051/0004-6361/201424259
Eckert, D., Molendi, S., Owers, M., et al. 2014, A&A, 570, A119, doi: 10.1051/0004-6361/201424259
-
[25]
Ester, M., Kriegel, H.-P., Sander, J., & Xu, X. 1996, in Proceedings of the Second International Conference on Knowledge Discovery and Data Mining, KDD’96 (AAAI Press), 226–231 Euclid Collaboration, Scaramella, R., Amiaux, J., et al. 2022, A&A, 662, A112, doi: 10.1051/0004-6361/202141938
-
[26]
1996, ApJ, 473, 670, doi: 10.1086/178180 Fern´ andez-Soto, A., Lanzetta, K
Mezzetti, M. 1996, ApJ, 473, 670, doi: 10.1086/178180 Fern´ andez-Soto, A., Lanzetta, K. M., Chen, H. W., Levine, B., & Yahata, N. 2002, MNRAS, 330, 889, doi: 10.1046/j.1365-8711.2002.05131.x Ferreira Lopes, C. E., Guti´ errez-Soto, L. A., Ferreira
arXiv 1996
-
[27]
Alberice, V. S., et al. 2025, A&A, 693, A306, doi: 10.1051/0004-6361/202451491
-
[28]
Fitzpatrick, E. L. 1999, PASP, 111, 63, doi: 10.1086/316293 Gaia Collaboration, Prusti, T., de Bruijne, J. H. J., et al. 2016, A&A, 595, A1, doi: 10.1051/0004-6361/201629272 Gaia Collaboration, Brown, A. G. A., Vallenari, A., et al. 2021, A&A, 649, A1, doi: 10.1051/0004-6361/202039657 Gaia Collaboration, Vallenari, A., Brown, A. G. A., et al. 2023, A&A, 6...
doi:10.1086/316293 1999
-
[29]
Gallagher, III, J. S., & Ostriker, J. P. 1972, AJ, 77, 288, doi: 10.1086/111280
doi:10.1086/111280 1972
-
[30]
Gondhalekar, Y., Chies-Santos, A. L., de Souza, R. S., et al. 2024, MNRAS, 532, 270, doi: 10.1093/mnras/stae1410
-
[31]
Gunn, J. E., & Gott, III, J. R. 1972, ApJ, 176, 1, doi: 10.1086/151605 Guti´ errez-Soto, L. A., Lopes de Oliveira, R., Akras, S., et al. 2025a, A&A, 695, A104, doi: 10.1051/0004-6361/202453167 Guti´ errez-Soto, L. A., Lopes de Oliveira, R., Akras, S., et al. 2025b, A&A, 695, A104, doi: 10.1051/0004-6361/202453167
doi:10.1086/151605 1972
-
[32]
Haack, R. F., Smith Castelli, A. V., Sodr´ e, Jr., L., et al. 2026, arXiv e-prints, arXiv:2602.10244, doi: 10.48550/arXiv.2602.10244
work page internal anchor Pith review Pith/arXiv arXiv doi:10.48550/arxiv.2602.10244 2026
-
[33]
2023, The Messenger, 190, 31, doi: 10.18727/0722-6691/5308
Haines, C., Jaff´ e, Y., Tejos, N., et al. 2023, The Messenger, 190, 31, doi: 10.18727/0722-6691/5308
-
[34]
Haines, C. P., Pereira, M. J., Smith, G. P., et al. 2015, ApJ, 806, 101, doi: 10.1088/0004-637X/806/1/101
-
[35]
J., & Biemesderfer, C
Hanisch, R. J., & Biemesderfer, C. D. 1989, in BAAS, 780
1989
-
[36]
2020, ARA&A, 58, 205, doi: 10.1146/annurev-astro-032620-021917
Helmi, A. 2020, ARA&A, 58, 205, doi: 10.1146/annurev-astro-032620-021917
-
[37]
Hernandez-Jimenez, J. A., & Krabbe, A. C. 2022, Astromorphlib: Python scripts to analyze the morphology of isolated and interacting galaxies, 0.2 Zenodo, doi: 10.5281/zenodo.6940848
-
[38]
R., Almeida-Fernandes, F., Oliveira Schwarz, G
Herpich, F. R., Almeida-Fernandes, F., Oliveira Schwarz, G. B., et al. 2024, A&A, 689, A249, doi: 10.1051/0004-6361/202449725
-
[39]
Hopkins, A. M., Miller, C. J., Nichol, R. C., et al. 2003, ApJ, 599, 971, doi: 10.1086/379608
doi:10.1086/379608 2003
-
[40]
K., Dey, S., Ronconi, T., et al
Humire, P. K., Dey, S., Ronconi, T., et al. 2025, A&A, 699, A183, doi: 10.1051/0004-6361/202553897
-
[41]
Ilbert, O., Arnouts, S., McCracken, H. J., et al. 2006, Astronomy & Astrophysics, 457, 841, doi: 10.1051/0004-6361:20065138 20
-
[42]
2023, A&A, 679, A69, doi: 10.1051/0004-6361/202347129 Ivezi´ c,ˇZ., Sesar, B., Juri´ c, M., et al
Iodice, E., Hilker, M., Doll, G., et al. 2023, A&A, 679, A69, doi: 10.1051/0004-6361/202347129 Ivezi´ c,ˇZ., Sesar, B., Juri´ c, M., et al. 2008, ApJ, 684, 287, doi: 10.1086/589678 Ivezi´ c,ˇZ., Kahn, S. M., Tyson, J. A., et al. 2019, ApJ, 873, 111, doi: 10.3847/1538-4357/ab042c Jaff´ e, Y. L., Smith, R., Candlish, G. N., et al. 2015, MNRAS, 448, 1715, do...
-
[43]
Johnson, B. D., Conroy, C., Naidu, R. P., et al. 2020, ApJ, 900, 103, doi: 10.3847/1538-4357/abab08 Juri´ c, M., Ivezi´ c,ˇZ., Brooks, A., et al. 2008, ApJ, 673, 864, doi: 10.1086/523619
-
[44]
2025, arXiv e-prints, arXiv:2506.09136, doi: 10.48550/arXiv.2506.09136
Kaviraj, S. 2025, arXiv e-prints, arXiv:2506.09136, doi: 10.48550/arXiv.2506.09136
-
[45]
Kraan-Korteweg, R. C. 2000, A&AS, 141, 123, doi: 10.1051/aas:2000314
-
[47]
Kraan-Korteweg, R. C., Fairall, A. P., & Balkowski, C. 1995b, A&A, 297, 617, doi: 10.48550/arXiv.astro-ph/9411089
work page internal anchor Pith review Pith/arXiv arXiv doi:10.48550/arxiv.astro-ph/9411089
-
[48]
2024, MNRAS, 528, 1125, doi: 10.1093/mnras/stad3881
Oliveira, C., et al. 2024, MNRAS, 528, 1125, doi: 10.1093/mnras/stad3881
-
[49]
G., Rosdahl, J., Blaizot, J., et al
Kramarenko, I. G., Rosdahl, J., Blaizot, J., et al. 2026, A&A, 707, A184, doi: 10.1051/0004-6361/202557114
-
[50]
Kunzli, M., North, P., Kurucz, R. L., & Nicolet, B. 1997, A&AS, 122, 51, doi: 10.1051/aas:1997291
-
[51]
2014, AJ, 147, 108, doi: 10.1088/0004-6256/147/5/108
Lang, D. 2014, AJ, 147, 108, doi: 10.1088/0004-6256/147/5/108
-
[52]
2025, ApJS, 277, 26, doi: 10.3847/1538-4365/adaf27
Li, X., Xiao, K., Huang, Y., et al. 2025, ApJS, 277, 26, doi: 10.3847/1538-4365/adaf27
-
[53]
Lima, E. V. R. 2025, The Southern Hemisphere Spectrocopic Redshift Compilation, Zenodo, doi: 10.5281/zenodo.15114194
-
[54]
Lima, E. V. R., Sodr´ e, L., Bom, C. R., et al. 2022, Astronomy and Computing, 38, 100510, doi: 10.1016/j.ascom.2021.100510
arXiv 2022
-
[55]
2021, MNRAS, 500, 1323, doi: 10.1093/mnras/staa3326
Lima-Dias, C., Monachesi, A., Torres-Flores, S., et al. 2021, MNRAS, 500, 1323, doi: 10.1093/mnras/staa3326
-
[56]
2024, MNRAS, 527, 5792, doi: 10.1093/mnras/stad3571
Lima-Dias, C., Monachesi, A., Torres-Flores, S., et al. 2024, MNRAS, 527, 5792, doi: 10.1093/mnras/stad3571
-
[57]
Limberg, G., Placco, V. M., Ji, A. P., et al. 2025, ApJL, 989, L18, doi: 10.3847/2041-8213/adf196
-
[58]
Lopes, A. R., Smith Castelli, A. V., Krabbe, A. C., et al. 2025, A&A, 699, A331, doi: 10.1051/0004-6361/202554159
-
[60]
Lopes, P. A. A., Ribeiro, A. L. B., & Brambila, D. 2024, MNRAS, 527, L19, doi: 10.1093/mnrasl/slad134
-
[61]
Louys, M., Tody, D., Dowler, P., et al. 2017, Observation Data Model Core Components, its Implementation in the Table Access Protocol Version 1.1,, IVOA Recommendation 09 May 2017 doi: 10.5479/ADS/bib/2017ivoa.spec.0509L
-
[62]
C., Fanson, J., Schiminovich, D., et al
Martin, D. C., Fanson, J., Schiminovich, D., et al. 2005, ApJL, 619, L1, doi: 10.1086/426387
doi:10.1086/426387 2005
-
[63]
G., Banerji, M., Gonzalez, E., et al
McMahon, R. G., Banerji, M., Gonzalez, E., et al. 2021, VizieR Online Data Catalog: The VISTA Hemisphere Survey (VHS) catalog DR5 (McMahon+, 2020),, VizieR On-line Data Catalog: II/367. Originally published in: 2013Msngr.154...35M Mej ´ ıa-Narv´ aez, A., Bruzual, G., Magris, C. G., et al. 2017, MNRAS, 471, 4722, doi: 10.1093/mnras/stx1758 Mendes de Olivei...
-
[64]
Minniti, D., Lucas, P. W., Emerson, J. P., et al. 2010, NewA, 15, 433, doi: 10.1016/j.newast.2009.12.002
-
[65]
2008, A&A, 486, 697, doi: 10.1051/0004-6361:200810014
Misgeld, I., Mieske, S., & Hilker, M. 2008, A&A, 486, 697, doi: 10.1051/0004-6361:200810014
-
[66]
2024, A&A, 691, A144, doi: 10.1051/0004-6361/202451059
Molina-Jorquera, F., Damke, G., Fern´ andez-Olivares, D., et al. 2024, A&A, 691, A144, doi: 10.1051/0004-6361/202451059
-
[67]
P., Monachesi, A., Torres-Flores, S., et al
Montaguth, G. P., Monachesi, A., Torres-Flores, S., et al. 2025, A&A, 696, A240, doi: 10.1051/0004-6361/202451198
-
[68]
P., Mendes de Oliveira, C., Lima-Dias, C., et al
Montaguth, G. P., Mendes de Oliveira, C., Lima-Dias, C., et al. 2026a, ApJ, 999, 160, doi: 10.3847/1538-4357/ae42ca
-
[69]
Montaguth, G. P., O’Mill, A. L., Mendes de Oliveira, C., et al. 2026b, ApJ, 998, 91, doi: 10.3847/1538-4357/ae2bdd
-
[70]
1996, Nature, 379, 613, doi: 10.1038/379613a0
Moore, B., Katz, N., Lake, G., Dressler, A., & Oemler, A. 1996, Nature, 379, 613, doi: 10.1038/379613a0
doi:10.1038/379613a0 1996
-
[71]
2001, AJ, 121, 1752, doi: 10.1086/319383
Lasker, B. 2001, AJ, 121, 1752, doi: 10.1086/319383
-
[72]
Nakazono, L., Mendes de Oliveira, C., Hirata, N. S. T., et al. 2021, MNRAS, 507, 5847, doi: 10.1093/mnras/stab1835
-
[73]
R., & Prieto, E
Navarro, R., Cunningham, C. R., & Prieto, E. 2012, in Proc. of SPIE Vol, Vol. 8450, 845001–1 21
2012
-
[74]
Olave-Rojas, D. A. 2023, MNRAS, 519, 4171, doi: 10.1093/mnras/stac3762 Oliveira Schwarz, G. B. 2022, Southern Photometric Local Universe Survey Cloud, Zenodo, doi: 10.5281/zenodo.10980447 Oliveira Schwarz, G. B., Herpich, F., Almeida-Fernandes, F., et al. 2025, Astronomy and Computing, 51, 100899, doi: 10.1016/j.ascom.2024.100899
arXiv 2023
-
[75]
Onken, C. A., Wolf, C., Bessell, M. S., et al. 2024, PASA, 41, e061, doi: 10.1017/pasa.2024.53
-
[76]
2023, ApJ, 954, 98, doi: 10.3847/1538-4357/ace71f
Park, S.-M., Chun, K., Shin, J., et al. 2023, ApJ, 954, 98, doi: 10.3847/1538-4357/ace71f
-
[77]
2011, Journal of Machine Learning Research, 12, 2825
Pedregosa, F., Varoquaux, G., Gramfort, A., et al. 2011, Journal of Machine Learning Research, 12, 2825
2011
-
[78]
Perin, G., Nakazono, L., Oliveira, C., & Hirata, N. 2023, in Anais Estendidos da XXXVI Conference on Graphics, Patterns and Images (Porto Alegre, RS, Brasil: SBC), 160–163, doi: 10.5753/sibgrapi.est.2023.27472
arXiv 2023
-
[79]
Perottoni, H. D., Placco, V. M., Almeida-Fernandes, F., et al. 2024, A&A, 691, A138, doi: 10.1051/0004-6361/202348801
-
[80]
M., Almeida-Fernandes, F., Arentsen, A., et al
Placco, V. M., Almeida-Fernandes, F., Arentsen, A., et al. 2022, ApJS, 262, 8, doi: 10.3847/1538-4365/ac7ab0
-
[81]
Placco, V. M., Roederer, I. U., Lee, Y. S., et al. 2021, ApJL, 912, L32, doi: 10.3847/2041-8213/abf93d
-
[82]
M., Almeida-Fernandes, F., Holmbeck, E
Placco, V. M., Almeida-Fernandes, F., Holmbeck, E. M., et al. 2023, ApJ, 959, 60, doi: 10.3847/1538-4357/ad077e
discussion (0)
Sign in with ORCID, Apple, or X to comment. Anyone can read and Pith papers without signing in.