REVIEW 3 major objections 4 minor 49 references
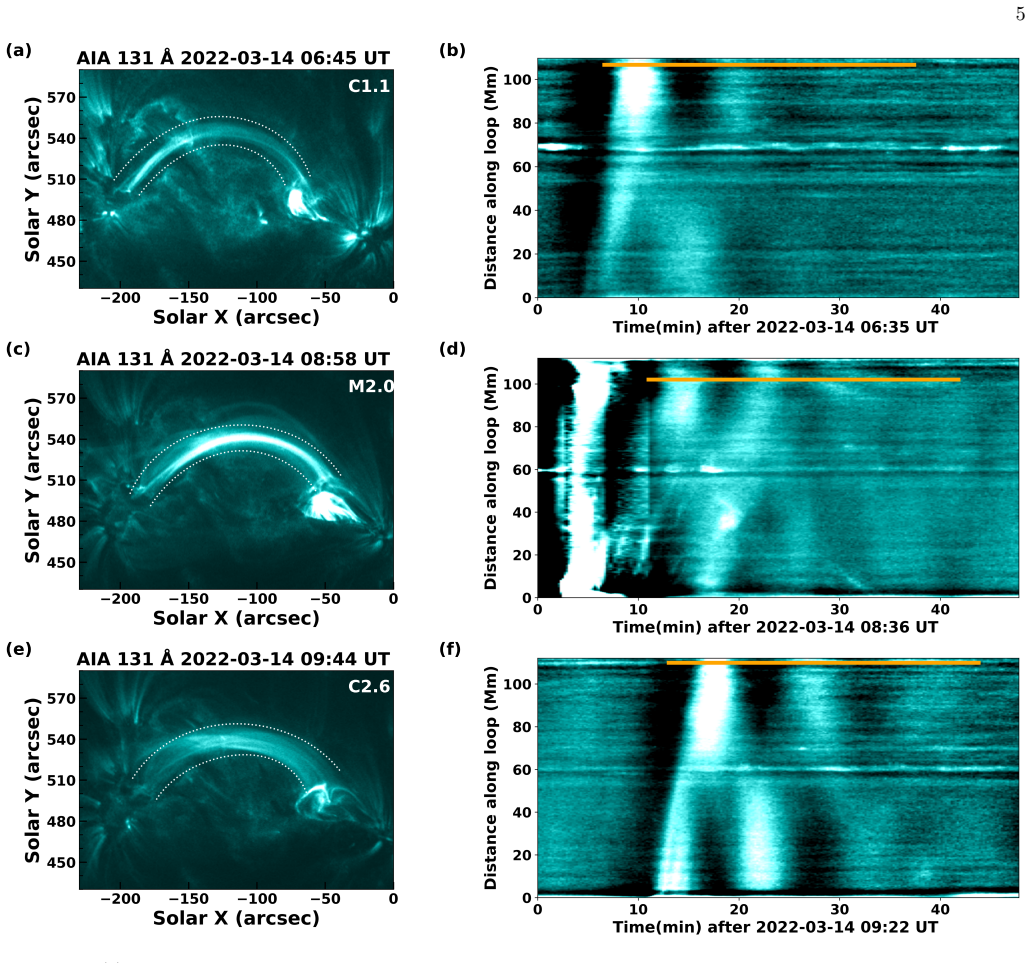
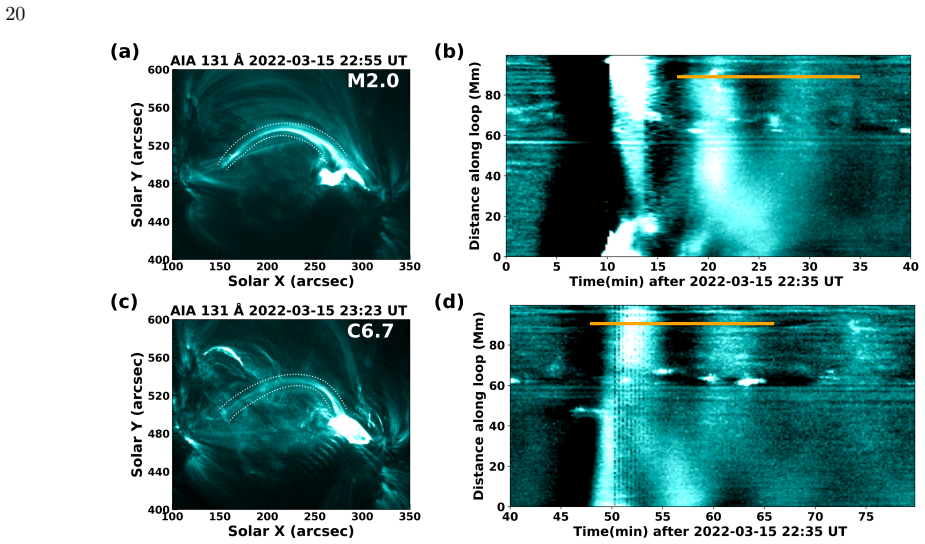
This paper reports fifteen sloshing oscillations in seven coronal loops, triggered by successive M- and C-class flares, and shows that their periods, damping times, and inferred temperatures vary from flare to flare, with damping not always
Reviewed by Pith at T0; open to challenge. T0 means a machine referee read the full paper against a public rubric. the ladder, T0–T4 →
T0 review · deepseek-v4-flash
2026-08-01 17:15 UTC pith:U6VLWQUG
load-bearing objection Useful new sloshing-oscillation events, but the derived temperatures and scaling exponents rest on an unquantified loop-length geometry assumption and pooled non-independent events; the 131/94 damping comparison is the most robust result. the 3 major comments →
Sloshing Oscillations in coronal loops excited by successive M- and C-Class flares
The pith
A machine-rendered reading of the paper's core claim, the machinery that carries it, and where it could break.
Core claim
The central claim is that sloshing oscillations excited by successive M- and C-class flares provide a rare controlled comparison of flare strength as a driver of loop oscillations. Fifteen events in seven loops yield periods from 304 to 637 s, damping times from 129 to 1660 s, and phase speeds from 446 to 842 km/s; interpreting the phase speed v=2L/P as sound speed gives plasma temperatures of 9–31 MK. Two results stand out: the damping time is not always longer in the cooler 94 Å channel than in 131 Å, contrary to the earlier thermal-conduction picture, and the damping-time–period power-law exponent (≈1.4) is significantly steeper than the ≈1.0 found for standing slow waves, while the perio
What carries the argument
The analysis rests on two tools: a modified damped-sloshing light-curve model (an exponential decay times a Gaussian spatial envelope of a cosine-shaped back-and-forth perturbation, plus a quadratic background) fitted to footpoint time series in AIA 131 and 94 Å channels, and the semicircular-loop deprojection model of Aschwanden et al. (2002) that turns a manually traced 2D loop path into a length L=πr. The length enters the phase speed v=2L/P, and the temperature T=(v/152)² MK; the loop length is the quantity that carries all absolute scaling.
Load-bearing premise
The paper assumes each loop is a semicircular arc whose length is well estimated by fitting a projected 2D image with the Aschwanden model; every derived speed and temperature scales linearly with that length, and the authors note the true length uncertainty may be substantially larger than the quoted statistical errors.
What would settle it
Measure the same seven loops with a three-dimensional reconstruction (e.g., stereoscopy or a magnetic-field model) and recompute L; if the true lengths differ systematically from the semicircular estimates by more than ~20%, the reported phase speeds (446–842 km/s), temperatures (9–31 MK), and the ~600 km/s period–length slope would shift correspondingly. Alternatively, an independent dataset of sloshing events with more non-flare triggers could test whether the steeper damping-time–period exponent is real or a small-sample artifact.
If this is right
- If sloshing oscillations respond measurably to flare strength, repeated flares in the same loop become natural experiments for tracking how individual flares deposit energy and alter local loop conditions.
- The finding that 94 Å damping is not always longer than 131 Å damping implies thermal conduction is not the sole or dominant damping mechanism; compressive viscosity or heating-cooling misbalance must be invoked in at least some events.
- A steeper-than-linear damping-time–period relation (1.38–1.44) for sloshing oscillations, distinct from the ~1.0 exponent for standing slow waves, points to a different or additional damping channel for propagating sloshing modes.
- The tight linear period–loop-length scaling with ~600 km/s representative phase speed means sloshing events are mostly governed by loop length, and shorter loops should host shorter periods regardless of flare strength.
- Extending the observed period range to C-class flares suggests short-period sloshing events are not confined to strong flares, enlarging the coronal-seismology sample.
Where Pith is reading between the lines
- The near-constant phase speed across loops (~600 km/s) hints that these flare-heated loops settle into a common temperature regime; if so, the damping-time scatter may be a cleaner diagnostic of loop density and magnetic field than the period itself.
- One could test the flare-strength dependence directly by comparing energy-flux-normalized properties: the paper's C1.1 vs M2.0 contrast in loop 1 suggests a scaling of damping time with peak GOES flux that a dedicated multi-event study could quantify.
- If the semicircular length assumption is the main systematic, the quoted 9–31 MK temperatures should be treated as provisional; a stereoscopic or magnetic-field-model validation of a few loops would calibrate the whole sample.
- A natural extension is to search for sloshing oscillations in the same loops during quiescent (non-flare) brightenings; the absence of oscillation then would prove the flare trigger rather than loop properties is what sets the period.
Editorial analysis
A structured set of objections, weighed in public.
Referee Report
Summary. The paper reports 15 sloshing-oscillation events in 7 distinct coronal loops observed with SDO/AIA, triggered by successive M- and C-class flares. For each event the authors fit a damped sinusoidal model (Eq. 1) to time series extracted near a loop footpoint in the 131 and 94 Å channels, obtaining periods of 304–637 s and damping times of 129–1660 s. Loop lengths are estimated by fitting a semicircular Aschwanden model to manually traced loop points (Appendix A), and phase speeds are computed as v = 2L/P and converted to temperatures through the sound-speed relation T = (v/152)^2. The central claims are that oscillation properties vary from flare to flare within the same loop, that damping times are not always longer in the cooler 94 Å channel, and that period and loop length follow a linear scaling with a representative phase speed near 600 km/s. The paper also compares the damping-time/period power-law slope with earlier standing-mode results.
Significance. If the results hold, this is the largest targeted sample of sloshing oscillations in flaring coronal loops, and the first to compare multiple M- and C-class flares in the same loops. The 94 Å damping-time comparison challenges the assumption that thermal conduction is the sole or dominant damping mechanism, and the P–L scaling suggests that short-period sloshing events may be common in shorter loops regardless of flare class. The parameter extraction is transparent: uncertainties on period and damping time are propagated from AIA noise estimates, exposure-time variations are explicitly handled, cases with poor visibility are left blank, and the appendices show the time–distance maps and fits for all loops. These are real strengths. The quantitative temperature and phase-speed results, however, rest on an unquantified semicircular-geometry assumption for loop length and on treating a partly non-independent sample as independent in the scaling relations, so the numerical precision of the headline seismological values is not yet established.
major comments (3)
- [Section 3; Appendix A, Eq. A1; Table 1; Fig. 4] Loop length L is the most load-bearing derived quantity: it enters every phase speed v=2L/P and every temperature T=(2L/152P)^2. The quoted uncertainties (e.g., 179.5±2.7 Mm) are only statistical fit errors from the semicircular Aschwanden model and manual tracing. The text acknowledges that the true uncertainty may be substantially larger, but this is never quantified or propagated. Because T scales as L^2, a 20% systematic error in L produces a 44% error in T, which would expand or shift the claimed 9–31 MK range and the P–L phase speed of 641±34 km/s. Please estimate the systematic length uncertainty by, for example, varying the traced points, using multiple reference frames, fitting an elliptical/arcade model instead of a purely semicircular one, or cross-checking against stereoscopic or DEM-constrained loop models, and propagate that into the reported quantities.
- [Table 1; Figs. 3 and 4] The statistical independence of the 15 events is overstated. Loops 3, 5, and 6 share the same flare start times and coordinates (2022-06-16T02:03 for the C1.4 flare and 03:52 for the M1.6 flare), and each loop contributes 2–3 events with the same L. In the P–L fits of Figure 4, repeated points for the same loop are not independent, and the effective number of independent L values is only 7. The similarly correlated structure applies to the τ–P fits. Please report cluster-robust uncertainties, or average per loop per flare, or otherwise account for the non-independence before claiming a 'strong' Pearson correlation of 0.8 and a 1.38–1.56 power-law slope.
- [Section 3, Eq. (4) and the DEM paragraph] The conversion from phase speed to temperature assumes v equals the local adiabatic sound speed. The DEM analysis yields peak temperatures clustered at 10–12 MK, which the authors attribute to DEM saturation. This is plausible, but the alternative interpretation — that the seismological temperatures are biased by the semicircular length assumption or by a non-sound-speed phase speed — is not ruled out. Since the shorter-period-during-M-flare inference is explicitly acknowledged to be circular (T is derived from P), that part of the argument should be removed or rephrased. More generally, please compare the seismological temperatures with an independent, saturation-aware temperature diagnostic (e.g., including GOES or high-temperature emission in the DEM) or state explicitly that the 9–31 MK range is conditional on the sound-speed identification and nominal geometry.
minor comments (4)
- [Throughout] The manuscript would benefit from a final proofread: e.g., the LaTeX header shows 'LATEXdefaultstyle', and some in-text references in figure legends and captions omit author initials (e.g., 'Kumar 2013' in Fig. 3 should be 'P. Kumar et al. 2013').
- [Section 3, Eqs. (2)–(3)] Define 'DN' explicitly at first use and clarify that the exposure-normalized intensities are still fitted in DN-like units; the noise model is quoted for raw DN only.
- [Section 4 and Fig. 3] The text reports Pearson r values of ~0.5 for the τ–P relation, but the figure also lists R values for combined data; please state in the text whether the quoted r is for the present sample alone or the combined sample, and give the number of points used in each fit.
- [Appendix A, Eq. A1] Eq. A1 defines r from h0 and Lbase, but the text says L=πr; please explicitly note that the semi-circular assumption fixes the arc length to πr and that the inclination angle θ enters only through the projection. This will make the geometric assumption clearer to readers.
Circularity Check
No significant circularity: derived temperatures are explicitly flagged as dependent on measured periods; the P–L and τ–P scalings are fits of the same data, not predictions; self-citations are methodological, not load-bearing.
full rationale
The paper's derivation chain is not circular. The oscillation period and damping time are obtained by fitting the time series model (Eq. 1), while loop lengths are estimated independently from the Aschwanden semi-circular model (Eq. A1). The phase speed and temperature are then derived via v = 2L/P and T = (v/152)^2; this is a physical conversion with explicitly stated assumptions, and the authors themselves acknowledge that these temperature estimates cannot be used to explain the period differences because the period enters the calculation (Section 3). The P–L scaling in Figure 4 is presented as a fit whose slope gives a representative phase speed, not as a prediction of a separate quantity, and the τ–P scaling is likewise a correlation of two independently fitted parameters. Self-citations to S. Krishna Prasad & T. Van Doorsselaere (2021) are used for a fitting approach and for contextual comparison, not to justify a uniqueness theorem or to substitute for an argument. The acknowledged limitation that the quoted loop-length uncertainties exclude systematic errors from the semi-circular geometry assumption is a statement about uncertainty, not a definitional equivalence. No load-bearing step reduces to its own input by construction.
Axiom & Free-Parameter Ledger
free parameters (4)
- Loop center height h0 (Aschwanden model) =
25.4 Mm for Loop 1; per loop otherwise
- Loop inclination angle θ (Aschwanden model) =
-89.5 deg for Loop 1; per loop otherwise
- Fitted model constants in Eq. 1 (A0, B0, C0, D, phi, sigma) =
Per event
- Oscillation period P and damping time tau per event =
Listed in Table 1 for each event/channel
axioms (6)
- domain assumption Semi-circular loop geometry and Aschwanden deprojection model (Appendix A, Eq. A1)
- domain assumption Sloshing phase speed satisfies v = 2L/P (round-trip distance 2L per period)
- domain assumption Phase speed equals local sound speed, with gamma=1.67 and mu=0.6, to convert v to temperature (Eq. 4)
- domain assumption Exponential damping plus moving Gaussian pulse model (Eq. 1) describes the observed light curves
- domain assumption AIA 131 and 94 Å intensity at the chosen footpoint location is dominated by the selected loop
- domain assumption Visually selected events are representative of the sloshing-oscillation population
read the original abstract
Slow magnetoacoustic waves in hot coronal loops have remained a topic of considerable interest and debate over the past two decades. The periodic back-and-forth motion of plasma within a coronal loop, often initiated by a flare, is commonly referred to as sloshing oscillation. In the present study, we report unprecedented observations of sloshing oscillations in coronal loops excited by successive M- and C-class flares, using data from the Atmospheric Imaging Assembly (AIA) onboard the Solar Dynamics Observatory (SDO). A total of fifteen oscillation events were identified within seven distinct coronal loops, providing the rare opportunity to evaluate the influence of flare strength on the characteristics of the oscillations. Based on the appearance of the oscillations, their properties were extracted mainly from the AIA 131 and 94 {\AA} channels. Additionally, we estimate the deprojected length of each loop by assuming a semi-circular geometry. Our results indicate considerable changes in the properties of oscillations from one flare to another, suggesting the role of individual flares in shaping the local physical conditions. The plasma temperature estimated from the loop length and oscillation period ranges from 9 to 31 MK. Additionally, we find that the damping times are not always longer in the colder 94 {\AA} channel as previously observed. By combining the results obtained from all events, we study the inter-dependences between various parameters, including oscillation period, damping time, loop length, and plasma temperature, and discuss these results in the context of the theory of slow waves.
Figures



Reference graph
Works this paper leans on
-
[1]
The Solar Dynamics Observatory (SDO). , keywords =. doi:10.1007/s11207-011-9841-3 , adsurl =
-
[2]
A statistical study of decaying kink oscillations detected using SDO/AIA. , keywords =. doi:10.1051/0004-6361/201527341 , archivePrefix =. 1511.03558 , primaryClass =
-
[3]
Decayless low-amplitude kink oscillations: a common phenomenon in the solar corona?. , keywords =. doi:10.1051/0004-6361/201526195 , archivePrefix =. 1509.05519 , primaryClass =
-
[4]
Magnetohydrodynamic Waves in Open Coronal Structures. , keywords =. doi:10.1007/s11214-021-00849-0 , archivePrefix =. 2012.08802 , primaryClass =
Pith/arXiv arXiv 2012
-
[5]
Design and Pre-Flight Calibration
GOES-R Series X-Ray Sensor (XRS): 1. Design and Pre-Flight Calibration. Journal of Geophysical Research (Space Physics) , keywords =. doi:10.1029/2024JA032925 , adsurl =
-
[6]
GOES-8 and Beyond , year = 1996, editor =
Design and calibration of the GOES-8 solar x-ray sensor: the XRS. GOES-8 and Beyond , year = 1996, editor =. doi:10.1117/12.254082 , adsurl =
-
[7]
The Atmospheric Imaging Assembly (AIA) on the Solar Dynamics Observatory (SDO). , keywords =. doi:10.1007/s11207-011-9776-8 , adsurl =
-
[8]
Hot coronal loop oscillations observed with SUMER: Examples and statistics. , keywords =. doi:10.1051/0004-6361:20030858 , adsurl =
-
[9]
Doppler Shift Oscillations of Hot Solar Coronal Plasma Seen by SUMER: A Signature of Loop Oscillations?. , keywords =. doi:10.1086/342189 , adsurl =
-
[10]
Initiation of hot coronal loop oscillations: Spectral features. , keywords =. doi:10.1051/0004-6361:20052680 , adsurl =
-
[11]
Solar Dynamics Observatory/Atmospheric Imaging Assembly Observations of a Reflecting Longitudinal Wave in a Coronal Loop. , keywords =. doi:10.1088/2041-8205/779/1/L7 , archivePrefix =. 1409.3896 , primaryClass =
Pith/arXiv arXiv 2041
-
[12]
X-Ray and EUV Observations of Simultaneous Short and Long Period Oscillations in Hot Coronal Arcade Loops. , keywords =. doi:10.1088/0004-637X/804/1/4 , archivePrefix =. 1502.07117 , primaryClass =
-
[13]
Compressive Oscillations in Hot Coronal Loops: Are Sloshing Oscillations and Standing Slow Waves Independent?. , keywords =. doi:10.3847/1538-4357/abfb01 , archivePrefix =. 2104.12038 , primaryClass =
-
[14]
Hot Coronal Loop Oscillations Observed by SUMER: Slow Magnetosonic Wave Damping by Thermal Conduction. , keywords =. doi:10.1086/345548 , adsurl =
-
[15]
Evidence of Thermal Conduction Suppression in a Solar Flaring Loop by Coronal Seismology of Slow-mode Waves. , keywords =. doi:10.1088/2041-8205/811/1/L13 , archivePrefix =. 1509.00920 , primaryClass =
Pith/arXiv arXiv 2041
-
[16]
Effect of Transport Coefficients on Excitation of Flare-induced Standing Slow-mode Waves in Coronal Loops. , keywords =. doi:10.3847/1538-4357/aac38a , archivePrefix =. 1805.03282 , primaryClass =
-
[17]
Effect of Local Thermal Equilibrium Misbalance on Long-wavelength Slow Magnetoacoustic Waves. , keywords =. doi:10.3847/1538-4357/aa8ea3 , adsurl =
-
[18]
Plasma Sloshing in Pulse-heated Solar and Stellar Coronal Loops. , keywords =. doi:10.3847/2041-8205/826/2/L20 , archivePrefix =. 1607.01329 , primaryClass =
Pith/arXiv arXiv 2041
-
[19]
Reflection of Propagating Slow Magneto-acoustic Waves in Hot Coronal Loops: Multi-instrument Observations and Numerical Modeling. , keywords =. doi:10.3847/0004-637X/828/2/72 , archivePrefix =. 1604.08133 , primaryClass =
-
[20]
Measuring the apparent phase speed of propagating EUV disturbances. , keywords =. doi:10.1051/0004-6361/201218848 , adsurl =
-
[21]
Time Variability of the ``Quiet'' Sun Observed with TRACE. I. Instrumental Effects, Event Detection, and Discrimination of Extreme-Ultraviolet Microflares. , keywords =. doi:10.1086/308866 , adsurl =
-
[22]
Measurements of Geometric and Physical Parameters
Transverse Oscillations in Coronal Loops Observed with TRACE II. Measurements of Geometric and Physical Parameters. , keywords =. doi:10.1023/A:1014916701283 , adsurl =
-
[23]
Sloshing Oscillations in Hot Coronal Loops Associated with M-Class Flares. , keywords =. doi:10.1007/s11207-024-02404-w , adsurl =
-
[24]
Differential emission measures from the regularized inversion of Hinode and SDO data. , keywords =. doi:10.1051/0004-6361/201117576 , archivePrefix =. 1201.2642 , primaryClass =
-
[25]
Advances in Observing Various Coronal EUV Waves in the SDO Era and Their Seismological Applications (Invited Review). , keywords =. doi:10.1007/s11207-014-0528-4 , archivePrefix =. 1404.0670 , primaryClass =
-
[26]
Philosophical Transactions of the Royal Society of London Series A , keywords =
Magnetohydrodynamic waves and coronal seismology: an overview of recent results. Philosophical Transactions of the Royal Society of London Series A , keywords =. doi:10.1098/rsta.2011.0640 , archivePrefix =. 1202.1944 , primaryClass =
arXiv 2011
-
[27]
Waves and Oscillations in the Corona - (Invited Review). , keywords =. doi:10.1023/A:1005237109398 , adsurl =
-
[28]
Advances in Space Research , keywords =
Bayesian coronal seismology. Advances in Space Research , keywords =. doi:10.1016/j.asr.2017.09.031 , archivePrefix =. 1709.08372 , primaryClass =
Pith/arXiv arXiv 2017
-
[29]
Coronal Heating by MHD Waves. , keywords =. doi:10.1007/s11214-020-00770-y , archivePrefix =. 2012.01371 , primaryClass =
Pith/arXiv arXiv 2012
-
[30]
Slow-Mode Magnetoacoustic Waves in Coronal Loops. , keywords =. doi:10.1007/s11214-021-00811-0 , archivePrefix =. 2102.11376 , primaryClass =
-
[31]
Slow-mode standing waves observed by SUMER in hot coronal loops. , keywords =. doi:10.1051/0004-6361:20030448 , adsurl =
-
[32]
SOLMAG 2002
Hot loop oscillations seen by SUMER: examples and statistics. SOLMAG 2002. Proceedings of the Magnetic Coupling of the Solar Atmosphere Euroconference , year = 2002, editor =
2002
-
[33]
Observations of Solar Flare Doppler Shift Oscillations with the Bragg Crystal Spectrometer on Yohkoh. , keywords =. doi:10.1086/428611 , archivePrefix =. astro-ph/0501093 , primaryClass =
-
[34]
Characteristics of Solar Flare Doppler-Shift Oscillations Observed with the Bragg Crystal Spectrometer on Yohkoh. , keywords =. doi:10.1086/499296 , archivePrefix =. astro-ph/0511070 , primaryClass =
-
[35]
Observations of Doppler Shift Oscillations with the EUV Imaging Spectrometer on Hinode. , keywords =. doi:10.1086/590341 , archivePrefix =. 0806.0265 , primaryClass =
-
[36]
Damping of slow magnetoacoustic oscillations by the misbalance between heating and cooling processes in the solar corona. , keywords =. doi:10.1051/0004-6361/201936072 , archivePrefix =. 1907.07051 , primaryClass =
Pith/arXiv arXiv 1907
-
[37]
Excitation and damping of slow magnetosonic standing waves in a solar coronal loop. , keywords =. doi:10.1051/0004-6361:20042319 , adsurl =
-
[38]
Annales Geophysicae , year = 2009, month = oct, volume =
3-D numerical simulations of coronal loops oscillations. Annales Geophysicae , year = 2009, month = oct, volume =. doi:10.5194/angeo-27-3899-2009 , adsurl =
-
[39]
Slow Magnetosonic Waves and Fast Flows in Active Region Loops. , keywords =. doi:10.1088/0004-637X/754/2/111 , archivePrefix =. 1205.5732 , primaryClass =
-
[40]
Radiative damping of standing acoustic waves in solar coronal loops. , keywords =. doi:10.1051/0004-6361:20079128 , adsurl =
-
[41]
Damping of Slow MHD Coronal Loop Oscillations by Shocks. , keywords =. doi:10.1086/591077 , adsurl =
-
[42]
Nonlinear damped standing slow waves in hot coronal magnetic loops. , keywords =. doi:10.1051/0004-6361/201321175 , adsurl =
-
[43]
Longitudinal Magnetohydrodynamics Oscillations in Dissipative, Cooling Coronal Loops. , keywords =. doi:10.1088/0004-637X/786/1/36 , adsurl =
-
[44]
Acoustic oscillations in solar and stellar flaring loops. , keywords =. doi:10.1051/0004-6361:20031738 , archivePrefix =. astro-ph/0402223 , primaryClass =
-
[45]
Modulation of gyrosynchrotron emission in solar and stellar flares by slow magnetoacoustic oscillations. , keywords =. doi:10.1051/0004-6361:20053944 , adsurl =
-
[46]
Forward Modeling of Standing Slow Modes in Flaring Coronal Loops. , keywords =. doi:10.1088/0004-637X/807/1/98 , archivePrefix =. 1504.07475 , primaryClass =
-
[47]
Modeling of Reflective Propagating Slow-mode Wave in a Flaring Loop. , keywords =. doi:10.1088/0004-637X/813/1/33 , archivePrefix =. 1509.04536 , primaryClass =
-
[48]
Slow Magnetoacoustic Oscillations in the Microwave Emission of Solar Flares. , keywords =. doi:10.1088/2041-8205/756/2/L36 , archivePrefix =. 1310.2796 , primaryClass =
Pith/arXiv arXiv 2041
-
[49]
A simultaneous view by SXT, EIT and TRACE
Active region transient brightenings. A simultaneous view by SXT, EIT and TRACE. , keywords =. doi:10.1051/0004-6361:20010142 , adsurl =
discussion (0)
Sign in with ORCID, Apple, or X to comment. Anyone can read and Pith papers without signing in.