REVIEW 3 major objections 4 minor 52 references
How genome redundancy can promote evolutionary innovation
T0 review · 3 major / 4 minor · reviewed 2026-08-01 · deepseek-v4-flash
Pith's one-line read This paper argues that polyploidy's evolutionary value is context-dependent, with an optimal chromosome-copy range near N≈15–30 under stabilizing selection, matching ploidy distributions observed in some plants and bacteria.
desk verdict The mean-set optimal ploidy range is not evolutionarily stable under the model's own free-N dynamics, which undermines the headline empirical match; the rest of the paper is a solid simulation study worth engaging. read the letter →
The pith
A machine-rendered reading of the paper's core claim, the machinery that carries it, and where it could break.
The reading
What carries the argument
The model's central object is a one-dimensional population-genetic simulation: M individuals, each with N homologous gene copies whose activities x_ij in [0,1] determine a phenotype y_i by either the mean or the maximum of the copies. Inheritance occurs in two extreme modes: 'set' (each parent's copy set is duplicated and transmitted together) and 'random' (copies are sampled independently, approximating polysomic segregation). Mutations occur at rate λ per copy per generation, with new values drawn from a Beta distribution. The key machinery is the comparison of the four model variants across four fitness landscapes (neutral, smooth, valley, peak), and the identification of N-dependent peak
What would settle it
Run a parameter sweep over mutation rate λ ∈ [10^-5, 10^-2] and fitness amplitudes in [0.2, 0.8] for the mean-set model; if the peaks in mean phenotype, variance, and acceleration do not cluster in a low-to-intermediate N range for a substantial fraction of the sweep, the claimed optimal ploidy range is not generic.
Extended reading notes
Core claim
The central claim is that polyploidy's evolutionary value is context-dependent and can be traced to a tradeoff among three measurable population-level properties: exploitation (proximity to the fitness optimum), exploration (phenotypic variance), and convergence speed (generations to stationarity). In the mean-set model, which the authors argue approximates structured inheritance with additive gene dosage, the tradeoff yields a non-monotonic dependence of all three properties on N, with a coherent optimal ploidy range of roughly 15–30 copies. The paper further claims that these N values are quantitatively consistent with the ploidy distributions observed in certain polyploid bacteria, cyanob
Load-bearing premise
The load-bearing premise is that the chosen parameters (λ=0.00032, Beta(1,1) mutation increments, initial value 0.2, fitness amplitudes and widths) faithfully represent dosage-sensitive traits under stabilizing selection; if the parameter set is unrepresentative or lacks sensitivity, the 15–30 optimal window may be an artifact.
Editorial extensions
If this is right
- Under stabilizing selection, populations exhibiting structured inheritance and additive gene action are expected to evolve toward roughly 15–30 chromosome copies, a window the model finds consistent with natural ploidy distributions in polyploid bacteria, cyanobacteria, and seed plants.
- Abrupt environmental changes favor polyploidy in all four model variants, because extra chromosome copies raise phenotypic variance and thus the chance of escaping fitness valleys or local optima.
- The best combination for both exploitation and exploration is random (stochastic) inheritance paired with a maximum-based phenotype map, indicating that redundancy is most beneficial when it can generate diversity through segregation noise and nonlinear readouts.
- When chromosome number is an inherited trait, selection does not maximize any single objective; it tunes ploidy to balance exploitation, exploration, and convergence speed, with the balance determined by the environment.
Reading between the lines
- The model implies that species with dosage-sensitive traits and structured inheritance should show a modal ploidy near 15–30; this can be tested across independent phylogenetic contrasts, rather than just the taxa cited.
- The framework suggests that polyploidy's role in cancer—where cells undergo whole-genome duplication during therapy—may be an instance of the same exploration-exploitation tradeoff under abrupt environmental change; this is an extension the authors mention as a practical motivation.
- Because the optimal range is derived from a single parameter set, an immediate test is to sweep the mutation rate and fitness curvature; if the peaks are robust, the 15–30 window becomes a strong quantitative prediction, if not, the match with natural ploidies may be coincidental.
- The model's 'max' mapping could represent threshold or dominant gene effects; real organisms with such regulatory architectures should show even stronger advantages from polyploidy than those with purely additive dosage.
Signed reviews
Editorial analysis
A structured set of objections, weighed in public.
Referee Report
Summary. The paper introduces a minimal one-dimensional evolutionary model to study how ploidy level N, inheritance mode (set vs. random), and genotype-phenotype mapping (mean vs. max) jointly shape adaptation. Four model variants (mean-set, mean-random, max-set, max-random) are compared under neutral, smooth, and rough fitness landscapes, and in mixed-N populations where N is inherited. The central claims are that (i) max-random maximizes both exploitation and exploration; (ii) the mean-set model displays an optimal ploidy range N≈15–30 under stabilizing selection, quantitatively consistent with empirical ploidy distributions; (iii) polyploidy facilitates escape from fitness valleys; and (iv) free evolution of N reflects a balance between exploitation, exploration, and convergence speed. The paper includes 100 independent repetitions for each condition and a PCA-based analysis linking fixed-N features to success in mixed-N populations.
Significance. If the central claims held, the model would offer a tractable framework for understanding when polyploidy is favored, connecting ploidy level to ecological selection pressures and making testable predictions about natural ploidy distributions. The systematic comparison of inheritance modes and genotype-phenotype mappings is a strength, and the simulation protocol is clearly specified with an unusually large number of replicates. The model's qualitative results, particularly the advantage of stochastic inheritance with max-mapping, are plausible and could inform empirical work. However, the paper's headline quantitative claim—the optimal ploidy range in the mean-set model—is undermined by an internal inconsistency with the free-N simulations and by the absence of sensitivity analysis, so the significance of the current version is limited.
major comments (3)
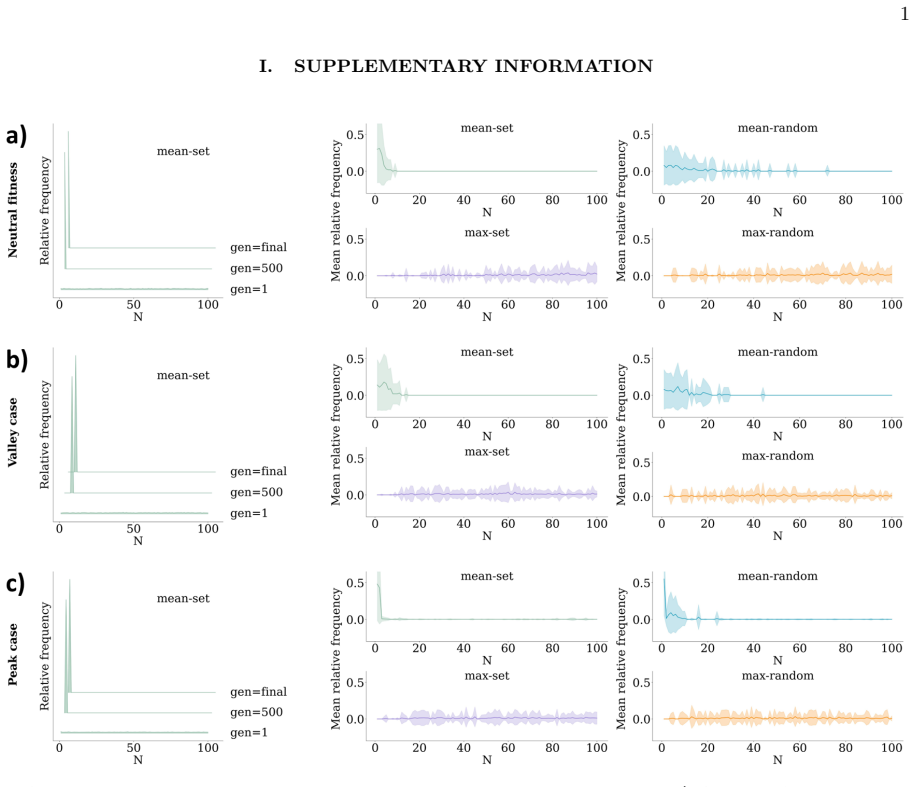
- [§4 and Conclusions (ii)] The free-N simulation in the smooth fitness landscape (Figure 4a) shows that low N values progressively prevail, while the fixed-N analysis (Figure 2d) identifies an optimal ploidy range N≈15–30. The authors call this 'consistent' because low N provides faster convergence, but this is not a reconciliation: if heritable N evolves to low values, the fixed-N optimum is not an evolutionary attractor. Moreover, the stationarity criterion used to stop the simulation is based on the mean phenotype, not on the N distribution; the N distribution may still be transient at the stopping time. Thus the coloring of points in Figure 4b and the PCA-based claims about 'successful N' may be artifacts of the stopping rule. As it stands, the paper contains a direct contradiction between Conclusion (ii) and the free-N result. The authors should either demonstrate that the N≈15–30 range is an attractor under
- [Methods and Figure 2d–e] The predicted optimal ploidy range and its quantitative comparison with empirical ploidy distributions rest on a single, hand-picked parameter set: mutation rate λ=0.00032, Beta(1,1) mutation increments, initial gene value 0.2, fitness amplitudes A=0.5, A_v=0.3, A_p=0.3, and peak widths σ=0.09/0.05. No sensitivity analysis is provided. The peaks in exploitation (N≈22), exploration (N≈16), and convergence speed (N≈30) are numerical outcomes; without varying λ, the mutation distribution, or the fitness curvature, one cannot determine whether these peaks are robust or whether the match to PloiDB data is coincidental. For a claim of 'quantitative consistency' (Conclusions, point ii), the authors should show how the optimal range shifts under plausible parameter variations, or at minimum provide a phase diagram over key parameters.
- [§3 and Conclusions (iii)] The text states that 'the mean-set model is confirmed to be the least adaptable model: in the peak landscape it fails to reach the global maximum for any value of N' yet later claims that 'polyploidy can confer an adaptive advantage during abrupt environmental changes in all four models.' For the mean-set model under the peak fitness, polyploidy may increase phenotypic variance, but it does not lead to escape from the suboptimal peak. The conclusion (iii) that polyploidy 'facilitates escape from suboptimal fitness states in all four models' is therefore unsupported. The authors should either soften the claim to 'increases phenotypic variability in all models, but does not guarantee escape in all cases' or provide evidence that mean-set populations with larger N move closer to the global optimum.
minor comments (4)
- [§2] The 'neutral fitness' f(y)=y is not neutral; it is directional selection favoring higher phenotypes. This is misleading because the 'baseline' environment is not selection-free. The authors should rename it (e.g., 'unimodal directional fitness' or 'no-optimum fitness') and adjust the interpretation of the 'neutral' results throughout, particularly in the derivation of the acceleration Ac.
- [Methods] The mutation distribution is described as Beta(1,β) with β=1/x̄−1 and x̄=0.5, which gives Beta(1,1), i.e., the uniform distribution on [0,1]. The text states that this distribution 'explores the full range [0,1] with a bias toward intermediate values.' A uniform distribution is not biased toward intermediate values; please correct this description.
- [Figure 2e] The claim that the simulated optimal range 'closely matches' the PloiDB histogram would be strengthened by a formal statistical comparison (e.g., overlap coefficient, Kolmogorov–Smirnov test) and by reporting confidence intervals on the simulated peak locations. As presented, the visual match is subjective.
- [Figures 1–3] In several figures (e.g., Figures 1–3), error bars or confidence bands from the 100 independent repetitions are not shown, making it difficult to assess the statistical significance of the reported peak and plateau differences. The shaded regions in Figure 4a are welcome; similar treatment elsewhere would improve the paper.
Circularity Check
No significant circularity; the claimed optimum is an emergent simulation result, not a fitted or self-referential prediction.
full rationale
The derivation chain is self-contained. The fixed-N simulations define phenotype mappings (Eqs. 1-2), inheritance modes, mutation scheme, and fitness landscapes from explicit parameters; the claimed mean-set optimal ploidy range N≈15–30 is read off from simulated maxima of mean phenotype, variance, and acceleration Ac, none of which are fit to the empirical ploidy distributions cited in Conclusions (PloiDB etc.). The empirical distributions are introduced after the fact as a qualitative comparison, not as constraints on parameter selection. The free-N simulation is an independent, same-model check; although its outcome (low N prevails in the smooth landscape) appears at odds with the fixed-N 'optimum' claim, this is a potential internal inconsistency or interpretive gap, not a reduction of the prediction to its inputs. Self-citations to the authors' prior work ([42], [43], [50]–[52]) appear only as background or methodological references and are not load-bearing for the central result. No fitted parameter is renamed as a prediction, no uniqueness theorem from prior work is invoked, and no ansatz is smuggled in via citation: the inheritance modes are explicitly attributed to Hatakeyama et al. [23]. Therefore no circular step meets the evidentiary bar.
Assumptions & free parameters
free parameters (8)
- Mutation rate λ =
0.00032 per gene copy per generation
- Mutation increment distribution Beta(1,β), β=1/x̄−1 with x̄=0.5 =
Beta(1,1), i.e. uniform on [0,1]
- Initial gene copy value =
0.2
- Smooth fitness parameters A, B, C =
A=0.5, B=2π, C=0.5π
- Valley fitness parameters =
A_v=0.3, peaks at μ=0.2 and 0.8 with σ=0.09
- Peak fitness parameters =
A_p=0.3, peaks at μ=0.5 and 0.8 with σ=0.05
- Population size M =
10,000
- Stationarity threshold =
|mean phenotype change| < 10^-3 over 500 generations
assumptions (6)
- domain assumption Wright-Fisher-like selection where each individual is chosen as a parent with probability equal to its fitness f(y)
- domain assumption Single-locus, one-dimensional trait with no recombination, epistasis, or linkage
- domain assumption Phenotype is either the mean or the maximum of all gene copies
- domain assumption Set and random inheritance capture the extremes of disomic and polysomic segregation
- domain assumption Number of mutated copies per individual per generation is Poisson(λN) and mutated values are drawn from Beta(1,1)
- domain assumption The three fitness landscape families (neutral, smooth, rough) represent distinct environmental regimes
Cite this review
Pith. "Pith review of How genome redundancy can promote evolutionary innovation." pith.science (2026). https://pith.science/paper/WPRNG6PM
@misc{pith2026260717687,
  author       = {Pith},
  title        = {Pith review of: How genome redundancy can promote evolutionary innovation},
  year         = {2026},
  howpublished = {\url{https://pith.science/paper/WPRNG6PM}},
  note         = {Machine review of arXiv:2607.17687}
}
read the original abstract
Polyploidy is defined as the existence of more than two complete sets of homologous chromosomes. Despite it being a widespread phenomenon across the tree of life, its role as either an evolutionary innovation or a dead end is still debated. Here, we investigate how under varying selective pressures the degree of ploidy interacts with two key biological factors: the mode of inheritance and the genotype-phenotype mapping. Through a minimal evolutionary model we find that polyploidy is especially advantageous during abrupt environmental changes, confirming that polyploidization is often associated with ecological upheavals. We observe that stochastic inheritance combined with a nonlinear (maximum-based) genotype-phenotype mapping maximizes both phenotypic exploitation and landscape exploration across all environments. By contrast, structured inheritance with an additive phenotype mapping systematically underperforms, yet displays a pronounced optimum at low-to-intermediate ploidy level that mirrors the distribution observed in natural plant and bacterial populations. When individuals are free to carry different chromosome numbers, selection drives the population toward values that reflect an interplay between exploitation, exploration, and convergence speed rather than any single evolutionary objective. The relative weight of these three factors depends on the fitness landscape, providing a unifying framework for understanding when and why polyploidy is favored by natural selection.
Figures


Figures from the paper (3 more)


Reference graph
Works this paper leans on
-
[1]
The nature of the last universal common ancestor and its impact on the early earth system.Nature Ecology & Evolution, 8(9):1654–1666, 2024
Edmund RR Moody, Sandra ´Alvarez-Carretero, Tara A Mahendrarajah, James W Clark, Holly C Betts, Nina Dombrowski, L´ en´ ard L Sz´ anth´ o, Richard A Boyle, Stuart Daines, Xi Chen, et al. The nature of the last universal common ancestor and its impact on the early earth system.Nature Ecology & Evolution, 8(9):1654–1666, 2024
2024
-
[2]
Tree of life reveals clock-like speciation and diversifica- tion.Molecular biology and evolution, 32(4):835– 845, 2015
S Blair Hedges, Julie Marin, Michael Suleski, Madeline Paymer, and Sudhir Kumar. Tree of life reveals clock-like speciation and diversifica- tion.Molecular biology and evolution, 32(4):835– 845, 2015. 10
2015
-
[3]
Insights into the role of dynamical features in protein complex for- mation: The case of sars-cov-2 spike binding with ace2.Computational and Structural Biotechnology Journal, 2025
Greta Grassmann, Mattia Miotto, Francesca Alessandrini, Giancarlo Ruocco, Edoardo Milan- etti, Andrea Giansanti, et al. Insights into the role of dynamical features in protein complex for- mation: The case of sars-cov-2 spike binding with ace2.Computational and Structural Biotechnology Journal, 2025
2025
-
[4]
Differences in the organization of interface residues tunes the stability of the sars- cov-2 spike-ace2 complex.Frontiers in Molecular Biosciences, 10:1205919, 2023
Mattia Miotto, Lorenzo Di Rienzo, Greta Grass- mann, Fausta Desantis, Gianluca Cidonio, Gior- gio Gosti, Marco Leonetti, Giancarlo Ruocco, and Edoardo Milanetti. Differences in the organization of interface residues tunes the stability of the sars- cov-2 spike-ace2 complex.Frontiers in Molecular Biosciences, 10:1205919, 2023
2023
-
[5]
The new mutation theory of phe- notypic evolution.Proceedings of the National Academy of Sciences, 104(30):12235–12242, 2007
Masatoshi Nei. The new mutation theory of phe- notypic evolution.Proceedings of the National Academy of Sciences, 104(30):12235–12242, 2007
2007
-
[6]
Disentangling cell-intrinsic and cell-extrinsic factors underlying evolution
Alexander L Starr, Toshiya Nishimura, Kyomi J Igarashi, Chihiro Funamoto, Hiromitsu Nakauchi, and Hunter B Fraser. Disentangling cell-intrinsic and cell-extrinsic factors underlying evolution. Cell Genomics, 5(8), 2025
2025
-
[7]
The evolutionary significance of polyploidy.Nature Reviews Genetics, 18(7):411– 424, 2017
Yves Van de Peer, Eshchar Mizrachi, and Kath- leen Marchal. The evolutionary significance of polyploidy.Nature Reviews Genetics, 18(7):411– 424, 2017
2017
-
[8]
Polyploidy: an evo- lutionary and ecological force in stressful times
Yves Van de Peer, Tia-Lynn Ashman, Pamela S Soltis, and Douglas E Soltis. Polyploidy: an evo- lutionary and ecological force in stressful times. The Plant Cell, 33(1):11–26, 2021
2021
Show all 52 references
-
[9]
Polyploidy: pit- falls and paths to a paradigm.American journal of botany, 103(7):1146–1166, 2016
Douglas E Soltis, Clayton J Visger, D Blaine Marchant, and Pamela S Soltis. Polyploidy: pit- falls and paths to a paradigm.American journal of botany, 103(7):1146–1166, 2016
2016
-
[10]
Genome duplication in amphibians and fish: an extended synthesis.Journal of zoology, 284(3):151–182, 2011
BK Mable, MA Alexandrou, and MI Tay- lor. Genome duplication in amphibians and fish: an extended synthesis.Journal of zoology, 284(3):151–182, 2011
2011
-
[11]
Polyploid incidence and evolution.Annual review of genet- ics, 34(1):401–437, 2000
Sarah P Otto and Jeannette Whitton. Polyploid incidence and evolution.Annual review of genet- ics, 34(1):401–437, 2000
2000
-
[12]
Rarely success- ful polyploids and their legacy in plant genomes
Nils Arrigo and Michael S Barker. Rarely success- ful polyploids and their legacy in plant genomes. Current opinion in plant biology, 15(2):140–146, 2012
2012
-
[13]
Methods for studying polyploid di- versification and the dead end hypothesis: a reply to soltis et al.(2014).New Phytologist, 206(1):27– 35, 2015
Itay Mayrose, Shing H Zhan, Carl J Rothfels, Nils Arrigo, Michael S Barker, Loren H Rieseberg, and Sarah P Otto. Methods for studying polyploid di- versification and the dead end hypothesis: a reply to soltis et al.(2014).New Phytologist, 206(1):27– 35, 2015
2014
-
[14]
Kevin Vanneste, Steven Maere, and Yves Van de Peer. Tangled up in two: a burst of genome dupli- cations at the end of the cretaceous and the conse- quences for plant evolution.Philosophical Trans- actions of the Royal Society B: Biological Sciences, 369(1648), 2014
2014
-
[15]
The frequency of polyploid speciation in vascular plants.Proceedings of the national Academy of sciences, 106(33):13875– 13879, 2009
Troy E Wood, Naoki Takebayashi, Michael S Barker, Itay Mayrose, Philip B Greenspoon, and Loren H Rieseberg. The frequency of polyploid speciation in vascular plants.Proceedings of the national Academy of sciences, 106(33):13875– 13879, 2009
2009
-
[16]
The more the better? the role of polyploidy in facilitating plant invasions.Annals of botany, 109(1):19–45, 2012
Mariska Te Beest, Johannes J Le Roux, David M Richardson, Anne K Brysting, Jan Suda, Mag- dalena Kubeˇ sov´ a, and Petr Pyˇ sek. The more the better? the role of polyploidy in facilitating plant invasions.Annals of botany, 109(1):19–45, 2012
2012
-
[17]
Increased phenotypic plasticity to climate may have boosted the invasion suc- cess of polyploid centaurea stoebe.PloS one, 7(11):e50284, 2012
Min A Hahn, Mark Van Kleunen, and Heinz M¨ uller-Sch¨ arer. Increased phenotypic plasticity to climate may have boosted the invasion suc- cess of polyploid centaurea stoebe.PloS one, 7(11):e50284, 2012
2012
-
[18]
Polyploidy and ecological adapta- tion in wild yarrow.Proceedings of the National Academy of Sciences, 108(17):7096–7101, 2011
Justin Ramsey. Polyploidy and ecological adapta- tion in wild yarrow.Proceedings of the National Academy of Sciences, 108(17):7096–7101, 2011
2011
-
[19]
Polyploidy and its effect on evolutionary success: old questions revisited with new tools.Heredity, 110(2):99–104, 2013
Andreas Madlung. Polyploidy and its effect on evolutionary success: old questions revisited with new tools.Heredity, 110(2):99–104, 2013
2013
-
[20]
Evolution vs the number of gene copies per primitive cell.Journal of molecular evo- lution, 20(1):71–76, 1984
Arthur L Koch. Evolution vs the number of gene copies per primitive cell.Journal of molecular evo- lution, 20(1):71–76, 1984
1984
-
[21]
Oxford University Press, 1999
Ronald Aylmer Fisher.The genetical theory of natural selection: a complete variorum edition. Oxford University Press, 1999
1999
-
[22]
Springer Science & Business Media, 2013
Susumu Ohno.Evolution by gene duplication. Springer Science & Business Media, 2013
2013
-
[23]
Evolutionary innovation by polyploidy.PRX Life, 2(4):043021, 2024
Tetsuhiro S Hatakeyama and Ryudo Ohbayashi. Evolutionary innovation by polyploidy.PRX Life, 2(4):043021, 2024
2024
-
[24]
Inference of polyploid origin and inheritance mode from population genomic data
Alison Dawn Scott, Jozefien D Van de Velde, and Polina Yu Novikova. Inference of polyploid origin and inheritance mode from population genomic data. InPolyploidy: Methods and protocols, pages 279–295. Springer, 2023
2023
-
[25]
Making a functional diploid: from polysomic to disomic inheritance.New Phytolo- gist, 186(1):113–122, 2010
SC Le Comber, ML Ainouche, A Kovarik, and AR Leitch. Making a functional diploid: from polysomic to disomic inheritance.New Phytolo- gist, 186(1):113–122, 2010
2010
-
[26]
Marc Stift, Camillo Berenos, Peter Kuperus, and Peter H van Tienderen. Segregation models for disomic, tetrasomic and intermediate inheritance in tetraploids: a general procedure applied to ror- ippa (yellow cress) microsatellite data.Genetics, 179(4):2113–2123, 2008
2008
-
[27]
Coordination of polyploid chromosome replication with cell size and growth in a cyanobacterium.MBio, 10(2):10–1128, 2019
Ryudo Ohbayashi, Ai Nakamachi, Tetsuhiro S Hatakeyama, Satoru Watanabe, Yu Kanesaki, Taku Chibazakura, Hirofumi Yoshikawa, and Shin-ya Miyagishima. Coordination of polyploid chromosome replication with cell size and growth in a cyanobacterium.MBio, 10(2):10–1128, 2019
2019
-
[28]
Basic mechanism of eukary- otic chromosome segregation.Philosophical Trans- actions of the Royal Society B: Biological Sciences, 360(1455):609–621, 2005
Mitsuhiro Yanagida. Basic mechanism of eukary- otic chromosome segregation.Philosophical Trans- actions of the Royal Society B: Biological Sciences, 360(1455):609–621, 2005
2005
-
[29]
Data and theory point to mainly ad- ditive genetic variance for complex traits.PLoS genetics, 4(2):e1000008, 2008
William G Hill, Michael E Goddard, and Peter M Visscher. Data and theory point to mainly ad- ditive genetic variance for complex traits.PLoS genetics, 4(2):e1000008, 2008
2008
-
[30]
Sinauer asso- ciates Sunderland, MA, 2007
Michael Lynch and Bruce Walsh.The origins of genome architecture, volume 98. Sinauer asso- ciates Sunderland, MA, 2007
2007
-
[31]
The pleiotropic structure of the genotype–phenotype map: the evolvability of complex organisms.Na- ture Reviews Genetics, 12(3):204–213, 2011
G¨ unter P Wagner and Jianzhi Zhang. The pleiotropic structure of the genotype–phenotype map: the evolvability of complex organisms.Na- ture Reviews Genetics, 12(3):204–213, 2011
2011
-
[32]
The integrative biology of genetic domi- nance.Biological Reviews, 96(6):2925–2942, 2021
Sylvain Billiard, Vincent Castric, and Violaine Llaurens. The integrative biology of genetic domi- nance.Biological Reviews, 96(6):2925–2942, 2021
2021
-
[33]
Cyanobac- teria maintain constant protein concentration de- spite genome copy-number variation.Cell reports, 11 19(3):497–504, 2017
Xiao-yu Zheng and Erin K O’Shea. Cyanobac- teria maintain constant protein concentration de- spite genome copy-number variation.Cell reports, 11 19(3):497–504, 2017
2017
-
[34]
The molecular basis of carbon- starvation-induced general resistance in es- cherichia coli.Molecular microbiology, 5(1):3–10, 1991
A Matin. The molecular basis of carbon- starvation-induced general resistance in es- cherichia coli.Molecular microbiology, 5(1):3–10, 1991
1991
-
[35]
Accelerated crossing of fitness valleys through division of labor and cheating in asexual populations.Scientific reports, 2(1):917, 2012
Natalia L Komarova, Erin Urwin, and Dominik Wodarz. Accelerated crossing of fitness valleys through division of labor and cheating in asexual populations.Scientific reports, 2(1):917, 2012
2012
-
[36]
Rapid evo- lutionary escape by large populations from lo- cal fitness peaks is likely in nature.Evolution, 59(6):1175–1182, 2005
Daniel M Weinreich and Lin Chao. Rapid evo- lutionary escape by large populations from lo- cal fitness peaks is likely in nature.Evolution, 59(6):1175–1182, 2005
2005
-
[37]
The rate at which asexual populations cross fitness valleys.Theoret- ical population biology, 75(4):286–300, 2009
Daniel B Weissman, Michael M Desai, Daniel S Fisher, and Marcus W Feldman. The rate at which asexual populations cross fitness valleys.Theoret- ical population biology, 75(4):286–300, 2009
2009
-
[38]
Natural selection and random ge- netic drift in phenotypic evolution.Evolution, pages 314–334, 1976
Russell Lande. Natural selection and random ge- netic drift in phenotypic evolution.Evolution, pages 314–334, 1976
1976
-
[39]
Robust assessment of asymmetric division in colon cancer cells.eLife, 14:RP104528, 2026
Domenico Caudo, Chiara Giannattasio, Simone Scalise, Valeria de Turris, Fabio Giavazzi, Gi- ancarlo Ruocco, Giorgio Gosti, Giovanna Pe- ruzzi, and Mattia Miotto. Robust assessment of asymmetric division in colon cancer cells.eLife, 14:RP104528, 2026
2026
-
[40]
Measuring and comparing evolvability and constraint in mul- tivariate characters.Journal of evolutionary biol- ogy, 21(5):1201–1219, 2008
Thomas F Hansen and David Houle. Measuring and comparing evolvability and constraint in mul- tivariate characters.Journal of evolutionary biol- ogy, 21(5):1201–1219, 2008
2008
-
[41]
Evolution of evolvability in a developmental model.Evolu- tion, 62(2):301–315, 2008
Jeremy Draghi and G¨ unter P Wagner. Evolution of evolvability in a developmental model.Evolu- tion, 62(2):301–315, 2008
2008
-
[42]
Exploration-exploitation tradeoffs dic- tate the optimal distributions of phenotypes for populations subject to fitness fluctuations.Phys- ical Review E, 99(1):012417, 2019
Andrea De Martino, Thomas Gueudr´ e, and Mat- tia Miotto. Exploration-exploitation tradeoffs dic- tate the optimal distributions of phenotypes for populations subject to fitness fluctuations.Phys- ical Review E, 99(1):012417, 2019
2019
-
[43]
Genome heterogeneity drives the evolution of species
Mattia Miotto and Lorenzo Monacelli. Genome heterogeneity drives the evolution of species. Physical Review Research, 2(4):043026, 2020
2020
-
[44]
Macromolecular composition of spores from the filamentous cyanobacterium anabaena cylindrica.Journal of Bacteriology, 129(2):1154–1155, 1977
Robert D Simon. Macromolecular composition of spores from the filamentous cyanobacterium anabaena cylindrica.Journal of Bacteriology, 129(2):1154–1155, 1977
1977
-
[45]
Evolutionary changes in dnaa-dependent chromosomal replication in cyanobacteria.Frontiers in microbiology, 11:786, 2020
Ryudo Ohbayashi, Shunsuke Hirooka, Ryo Onuma, Yu Kanesaki, Yuu Hirose, Yusuke Kobayashi, Takayuki Fujiwara, Chikara Furusawa, and Shin-ya Miyagishima. Evolutionary changes in dnaa-dependent chromosomal replication in cyanobacteria.Frontiers in microbiology, 11:786, 2020
2020
-
[46]
Ploidb: the plant ploidy database.New Phytol- ogist, 240(3):918–927, 2023
Keren Halabi, Anat Shafir, and Itay Mayrose. Ploidb: the plant ploidy database.New Phytol- ogist, 240(3):918–927, 2023
2023
-
[47]
Xiaoli Shi, Changqing Zhang, Dae Kwan Ko, and Z Jeffrey Chen. Genome-wide dosage-dependent and-independent regulation contributes to gene expression and evolutionary novelty in plant polyploids.Molecular Biology and Evolution, 32(9):2351–2366, 2015
2015
-
[48]
The advantages and disadvan- tages of being polyploid.Nature reviews genetics, 6(11):836–846, 2005
Luca Comai. The advantages and disadvan- tages of being polyploid.Nature reviews genetics, 6(11):836–846, 2005
2005
-
[49]
The evolution- ary theory of cancer: challenges and potential so- lutions.Nature Reviews Cancer, 24(10):718–733, 2024
Lucie Laplane and Carlo C Maley. The evolution- ary theory of cancer: challenges and potential so- lutions.Nature Reviews Cancer, 24(10):718–733, 2024
2024
-
[50]
Inheritance entropy: A model- independent method to probe the hereditary structure of cell lineage trees.PRX Life, 4(2):023023, 2026
Alessandro Allegrezza, Riccardo Beschi, Domenico Caudo, Andrea Cavagna, Alessan- dro Corsi, Antonio Culla, Samantha Donsante, Giuseppe Giannicola, Irene Giardina, Giorgio Gosti, et al. Inheritance entropy: A model- independent method to probe the hereditary structure of cell l...
2026
-
[51]
Lineage topology, replication kinetics and cell cycle synchronization reveal regulated growth dynamics in human bone marrow stromal cell colonies.Scientific Reports, 2026
Alessandro Allegrezza, Riccardo Beschi, Domenico Caudo, Andrea Cavagna, Alessan- dro Corsi, Antonio Culla, Samantha Donsante, Giuseppe Giannicola, Irene Giardina, Giorgio Gosti, et al. Lineage topology, replication kinetics and cell cycle synchronization reveal regulated growt...
2026
-
[52]
Exploring neural networks to uncover information- richer features for protein interaction predic- tion.European Biophysics Journal, 55(2):123–134, 2026
Greta Grassmann, Lorenzo Di Rienzo, Giancarlo Ruocco, Edoardo Milanetti, and Mattia Miotto. Exploring neural networks to uncover information- richer features for protein interaction predic- tion.European Biophysics Journal, 55(2):123–134, 2026. 1 I. SUPPLEMENT AR Y INFORMA TIO...
2026
Reviewed August 1, 2026 · model on record in the stance chip above.
Discussion (0). Continue with ORCID to comment.