REVIEW 4 major objections 4 minor 52 references
In the Hydra-A cluster, the jet's energy goes into gas motion near the nucleus but fades by ~100 kpc, leaving the giant northern cavity's enthalpy largely unaccounted for in detected kinematics.
Reviewed by Pith at T0; open to challenge. T0 means a machine referee read the full paper against a public rubric. the ladder, T0–T4 →
T0 review · deepseek-v4-flash
2026-08-01 20:51 UTC pith:PVIZCLFP
load-bearing objection Solid sub-array XRISM measurements of Hydra-A gas motions; the NE-quarter highlight is only ~2-3 sigma and the northern 'inefficient' claim hinges on an internal enthalpy inconsistency (9.9 vs 4e60 erg). the 4 major comments →
Gas Motions in Hydra-A: XRISM Constraints on ICM Kinematics Across Jet-Inflated Cavities
The pith
A machine-rendered reading of the paper's core claim, the machinery that carries it, and where it could break.
Core claim
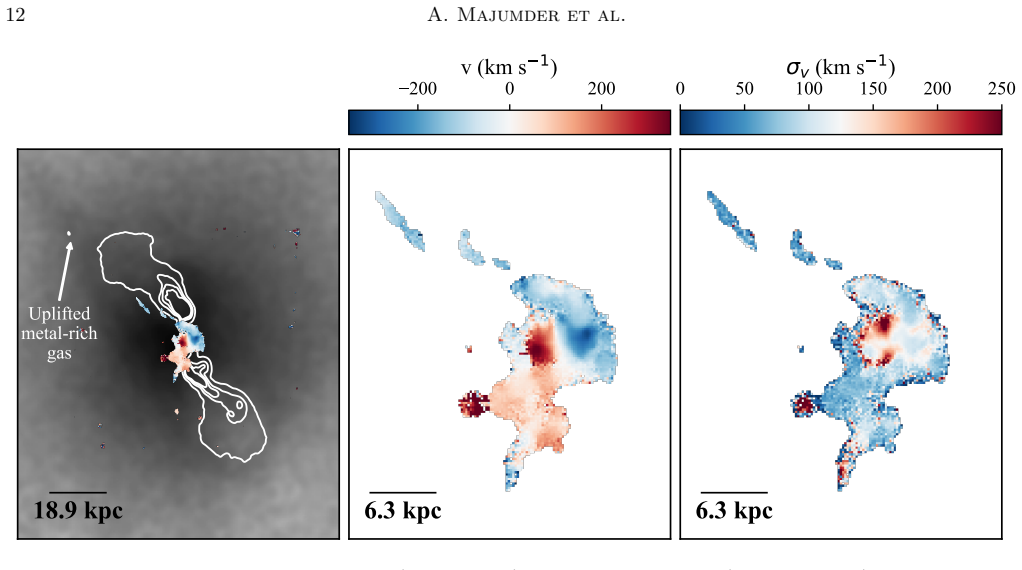
On the paper's own terms, Hydra-A's jet feedback does not uniformly stir its atmosphere. The central pointing has σ_v = 162±10 km/s overall, but when split into quarters the northeast shows 260±50 km/s while the other three quarters are ≤120 km/s; this hotspot coincides with a Chandra X-ray-bright, metal-rich feature attributed to gas uplifted by previous cavities. The northern pointing, spanning the large cavity E, shows σ_v = 140±30 km/s, comparable to the core. Kinetic-energy accounting—1.4×10^60 erg in the central footprint versus 1.2×10^60 erg of cavity enthalpy, and 1.3×10^60 erg in the north versus ~9.9×10^60 erg of cavity E's enthalpy—leads the authors to conclude that the jet drives
What carries the argument
The central technique is spatial-spectral mixing (SSM): tailored ARFs built by ray-tracing Chandra's high-resolution surface-brightness image let spectra from different XRISM sub-regions be fitted simultaneously, recovering kinematics where XRISM's ~1.3-arcmin resolution alone could not. The interpretation of the northern dispersion leans on a second mechanism: modeling the unresolved cocoon shock as a thin spherical shell expanding at speed v_e, whose projected line-of-sight velocities are uniformly distributed, giving a root-mean-square dispersion σ = v_e/√3 ≈ 153–286 km/s for Mach 1.2–1.4.
Load-bearing premise
The northern-dispersion conclusion assumes the cocoon shock is a thin spherical shell expanding at a single speed (Mach 1.2–1.4), so its line-of-sight velocity contribution is a uniform distribution with σ = v_e/√3; if the front is strongly aspherical, time-dependent, or faster/slower than assumed, the shock explanation loses its quantitative grip.
What would settle it
Measure the shape of a strong line (e.g., Fe XXV) in the northern pointing: a uniform-velocity shell predicts a flat-topped line profile with width set by v_e, while turbulence or sloshing would produce a Gaussian profile. A flat-topped profile around the 140 km/s level would confirm the shell model; a Gaussian profile would mean most of the northern dispersion is not the shock. Independently, measuring the Mach number from the shock's temperature/density jump would check whether v_e is in the 265–500 km/s range.
If this is right
- If the jet efficiently stirs gas only inside ~95 kpc, then jet-driven turbulence is unlikely to offset radiative cooling in the outer atmosphere of Hydra-A.
- The true turbulent velocity may be as low as ~100 km/s (the southern-half value), making turbulent heating even less competitive with cooling than the full-field 160 km/s suggested.
- Unresolved bulk flows—from shock fronts and uplifted metal-rich gas—can masquerade as high velocity dispersion, so dispersion-only measurements overestimate turbulence.
- Splitting a field of view into azimuthal sub-regions is necessary to detect jet-driven gas motion; whole-field averages hide localized high-dispersion regions.
- The flat dispersion profile along the jet is not evidence of sustained turbulence: much of it may be the expanding cocoon shock's line-of-sight smearing.
Where Pith is reading between the lines
- If the cocoon-shock interpretation is right, future spatially resolved observations should see a top-hat (uniform) line-of-sight velocity distribution in the northern pointing, not a Gaussian; that shape is a clean signature to test the model.
- The northeast-quarter result implies that metal-rich filaments lifted by buoyant cavities carry substantial kinetic energy; searches for 'turbulence' in cluster cores should separate such coherent bulk flows before claiming isotropic turbulence.
- The same SSM approach could map azimuthal dispersion in other cavity systems (for example Perseus or Centaurus) to see whether the efficiency-with-radius decline is generic to jet feedback or peculiar to Hydra-A's powerful jet and large shock.
- A Mach number measured independently from the shock's density/temperature jump would tighten the northern-dispersion interpretation; if the true Mach number is below ~1.2, the predicted shell contribution drops below the observed 140 km/s.
Editorial analysis
A structured set of objections, weighed in public.
Referee Report
Summary. This paper analyzes two deep XRISM Resolve pointings of Hydra-A, using Chandra-based spatial-spectral mixing to measure ICM velocity dispersions and bulk velocities in the central and northern fields. The central full-FOV dispersion is 162±10 km/s, reproducing Rose et al. (2025). Sub-array fits yield a high dispersion in the northeast quarter (260±50 km/s), low dispersions in the other quarters, and a comparable dispersion in the northern pointing (140+30−20 km/s). Converting dispersions into kinetic energies, the authors conclude that jet-driven gas motions are energetically efficient in the core but roughly an order of magnitude below the enthalpy of the northern cavity E, and they propose that much of the northern dispersion may be unresolved cocoon-shock expansion. They also report a bulk flow of about −100±30 km/s in the southwest quarter, attributed to sloshing.
Significance. If the results hold, this is one of the first spatially resolved XRISM line-broadening studies across a full sequence of jet-inflated cavities, and it would support the picture that jets couple efficiently to the inner ICM while old cavity enthalpy is not primarily converted into detected gas motion. The spectral fitting is standard and well documented: C-stat values are close to their expected ranges, the energy-scale and line-spread-function systematics are quantified, and the independent recovery of the central 162±10 km/s dispersion is a strong consistency check. The sub-array spatial-spectral mixing is technically careful. The main limitations are internal and fixable: an inconsistency in the cavity E enthalpy used for the headline efficiency comparison, a marginal and post-hoc significance for the northeast-quarter excess, and an idealized shock-shell interpretation that is appropriately hedged but should be more explicitly bounded.
major comments (4)
- [§6.1; Summary points 5 and 7] The headline conclusion that the jet drives gas motion inefficiently at large scales compares the northern kinetic energy Ekin = 1.3×10^60 erg (Eq. 2) with the enthalpy of cavity E. The manuscript quotes that enthalpy as ∼9.9×10^60 erg in §6.1 and Summary point 5, but Summary point 7 quotes '4pV∼4×10^60 erg' for cavity E, citing Wise et al. (2007). If 4×10^60 erg is the correct value, the ratio is ≈0.33, a factor of about three, not an order of magnitude, and the abstract's 'roughly an order of magnitude smaller' and the 'inefficiently' conclusion are overstated. Please reconcile the two values against the Wise et al. source and propagate the correct number consistently through the abstract, §6.1, and the Summary.
- [§5.4; §6.2] The claim that the high dispersion is concentrated in the northeast quarter rests on differences of 1.8σ (NE vs NW), 2.8σ (NE vs SE), and 2.3σ (NE vs SW) after the northeast region was selected a posteriori from a four-way split. No correction for multiple comparisons or a global test of azimuthal uniformity is reported. As it stands, the evidence for an azimuthal asymmetry is marginal; the 3.9σ north–south half difference is stronger but conflates the NE excess with the whole northern half. Please provide a simultaneous fit in which all four quarter dispersions are tied and report ΔC, or a bootstrap test, and adjust the wording accordingly if the excess does not survive.
- [§6.3; Eqs. (3)–(8)] The cocoon-shock interpretation assumes a single spherical thin shell expanding at v_e, giving a flat line-of-sight velocity distribution and σ = v_e/√3, with v_e derived from the plane-shock jump using Mach 1.2–1.4 and cs ≈ 965 km/s. This yields 153–286 km/s, consistent with the measured 140+30−20 km/s, but the model is not fitted to the data; strong asphericity, time dependence, or a biased Mach number could move the prediction outside the measured range. The text hedges with 'could be responsible,' which is appropriate, but it should also state explicitly that intrinsic turbulence persisting to the north is not excluded by this calculation, and that the energy-budget comparison in §6.1 is independent of the shock interpretation.
- [§6.1; Eq. (2)] Ekin scales linearly with the adopted gas mass. The full-FOV mass, 1.78×10^12 M⊙, is taken from Nulsen et al. (2005b) without an uncertainty, and the half- and quarter-region masses are obtained by dividing it by 2 or 4 'assuming spherical symmetry' (8.9×10^11 and 4.45×10^11 M⊙). Projection and the irregular cavity geometry mean the region masses could differ by factors of order unity, directly affecting the comparisons between 1.4×10^60 erg and the cavity enthalpies, and between 1.3×10^60 erg and the enthalpy of cavity E. Please quote a mass uncertainty or demonstrate that the efficiency conclusions are robust to conservative mass assignments.
minor comments (4)
- [§6.3, Eq. (7)] The sentence defining v1 and v2 as the velocities 'after and before' the shock appears reversed relative to standard upstream/downstream usage. Please clarify the definition before Eq. (7).
- [Table 6 and §5.5] The outer-pixel dispersion is quoted as 130±130 km/s in the free fit and 130+50−60 km/s in the frozen-parameter fit. The text notes the former is unconstrained, but the two numbers appearing in the same table may confuse readers; a footnote or explicit sentence would help.
- [Figure 5 caption] The caption states that 'the leftmost panel also shows the 5 GHz EVLA radio lobes,' but the panel layout of Figure 5 (full FOV, halves, quarters, central/outer) makes 'leftmost' ambiguous. Please specify which panel contains the radio overlay.
- [Data Availability] The paper states that intermediate data products and code 'will be made publicly available following acceptance.' If possible, please provide the analysis code as part of the revision or state more concretely when and where it will be released, since the SSM procedure would benefit from independent reproduction.
Circularity Check
Measured dispersions are independent spectral fits; shock and enthalpy comparisons use prior Chandra inputs; the cavity-E enthalpy inconsistency is a correctness issue, not circularity.
full rationale
The core measurements in this paper—σ_v values in Tables 2–6 and the bulk velocities derived from Equation 1—come from direct XRISM line-broadening and redshift fits in the SSM analysis. None of the fitted parameters is defined in terms of, or fitted to, a cavity enthalpy, a Mach number, or the paper's conclusions. The kinetic-energy comparison (Equation 2) uses σ_v from the spectra together with gas masses from Nulsen et al. (2005b) and cavity enthalpies from Wise et al. (2007); these are prior, externally measured inputs rather than quantities fitted here, so the efficiency claim is not a renaming of an input. The cocoon-shock interpretation in §6.3 uses the Mach-number range 1.2–1.4 from Nulsen et al. (2005b) and standard spherical-shell relations (Equations 3–8) to produce a predicted dispersion range 153–286 km/s, which is then compared with the measured 140 km/s; it does not adjust a free parameter to match the data, and it is explicitly hedged ('could be responsible'). The self-citations to Nulsen et al. (2005b) and Wise et al. (2007) are load-bearing for the quantitative energy comparison, but those are independent Chandra-based measurements (shock Mach number, cavity enthalpy, gas mass), not results derived from the present XRISM data, so this is not circular. One genuine weakness is an internal numerical inconsistency: §6.1 quotes cavity E enthalpy as '∼9.9×10^60 erg' while Summary point 7 gives '4pV∼4×10^60 erg (M. W. Wise et al. 2007).' This affects the 'roughly an order of magnitude smaller' claim and the 'inefficiently' conclusion, but it is a consistency/correctness issue rather than a circular derivation: neither number is fitted or predicted from the XRISM measurements. No step in the derivation reduces by construction to its own input, so the paper is not circular; score 1 reflects only the presence of minor self-citations in the interpretive chain.
Axiom & Free-Parameter Ledger
free parameters (3)
- Central-12-pixel dispersion (fixed value) =
160 km s−1
- Shock Mach number range =
M = 1.2–1.4 (adopted from Nulsen et al. 2005b)
- Assumed gas masses for kinetic-energy calculation =
1.78e12 M_sun (central FOV), 2.2e12 M_sun (northern), 8.9e11 and 4.45e11 M_sun (halves/quarters)
axioms (4)
- domain assumption Single-temperature CIE model describes the ICM emissivity in the 1.7–12 keV band for all sub-regions
- domain assumption The fitted Gaussian broadening σ_1D is interpreted as gas motion, without separately identifying unresolved bulk flows vs isotropic turbulence
- domain assumption Region gas masses for halves/quarters are obtained from the central radial profile assuming spherical symmetry
- domain assumption The cocoon shock front can be approximated as a thin spherical shell expanding at a single speed for the line-of-sight velocity distribution
read the original abstract
We report on two deep XRISM observations of the central and northern regions of Hydra-A's X-ray atmosphere covering the bubbles inflated by jets from the central galaxy's active galactic nucleus (AGN). We use spatial-spectral mixing that combines Chandra's high spatial resolution with XRISM's high spectral resolution to investigate atmospheric kinematics. The atmospheric velocity dispersion in the northern region, $\sigma_v = 140^{+30}_{-20}$ km s$^{-1}$, is comparable to that in the central region ($\sigma_v = 162 \pm 10$ km s$^{-1}$). We show that the motion of the large-scale cocoon shock front could be responsible for the large dispersion toward the north. The velocity dispersion in the northeast quarter of the central pointing, $\sigma_v = 260 \pm 50$ km s$^{-1}$, is among the highest dispersions measured. This region contains an X-ray-bright feature previously identified as metal-rich, possibly consisting of gas uplifted in the wake of previous-generation cavities. The dispersions in all other quarter regions are low ($\sigma_v \leq 120$ km s$^{-1}$) and consistent with previous XRISM results from other objects. The kinetic energy at the center is comparable to the enthalpies of the cavities, while in the north, it is roughly an order of magnitude smaller. The jet thus drives gas motion efficiently at smaller scales ($r < 95$ kpc) and inefficiently at larger scales ($95-317$ kpc toward the north along the jet). A bulk flow toward our line of sight of $-100 \pm 30$ km s$^{-1}$ in the southwest quarter of the central pointing is also observed, possibly due to sloshing.
Figures


Reference graph
Works this paper leans on
-
[1]
Astropy Collaboration, Robitaille, T. P., Tollerud, E. J., et al. 2013, A&A, 558, A33, doi: 10.1051/0004-6361/201322068 Astropy Collaboration, Price-Whelan, A. M., Sip˝ ocz, B. M., et al. 2018, AJ, 156, 123, doi: 10.3847/1538-3881/aabc4f Astropy Collaboration, Price-Whelan, A. M., Lim, P. L., et al. 2022, ApJ, 935, 167, doi: 10.3847/1538-4357/ac7c74
-
[2]
Bellomi, E., ZuHone, J. A., Truong, N., et al. 2025, arXiv e-prints, arXiv:2512.12754, doi: 10.48550/arXiv.2512.12754
-
[3]
Bourne, M. A., & Sijacki, D. 2017, Monthly Notices of the Royal Astronomical Society, 472, 4707, doi: 10.1093/mnras/stx2269 20 https://platform.claude.com/docs/en/about- claude/models/overview B ˆ ırzan, L., Rafferty, D. A., McNamara, B. R., Wise, M. W., & Nulsen, P. E. J. 2004, The Astrophysical Journal, 607, 800, doi: 10.1086/383519
-
[4]
1979, ApJ, 228, 939, doi: 10.1086/156922
Cash, W. 1979, ApJ, 228, 939, doi: 10.1086/156922
doi:10.1086/156922 1979
-
[5]
2008, A&A, 484, 51, doi: 10.1051/0004-6361:20078428 De Grandi, S., Eckert, D., Molendi, S., et al
Colafrancesco, S., & Marchegiani, P. 2008, A&A, 484, 51, doi: 10.1051/0004-6361:20078428 De Grandi, S., Eckert, D., Molendi, S., et al. 2016, A&A, 592, A154, doi: 10.1051/0004-6361/201526641
-
[6]
Dennis, T. J., & Chandran, B. D. G. 2005, ApJ, 622, 205, doi: 10.1086/427424
doi:10.1086/427424 2005
-
[7]
Fabian, A. C., Sanders, J. S., Allen, S. W., et al. 2003, Monthly Notices of the Royal Astronomical Society, 344, L43, doi: 10.1046/j.1365-8711.2003.06902.x
arXiv 2003
-
[8]
Fabian, A. C., Walker, S. A., Russell, H. R., et al. 2017, MNRAS, 464, L1, doi: 10.1093/mnrasl/slw170
-
[9]
Fanaroff, B. L., & Riley, J. M. 1974, MNRAS, 167, 31P, doi: 10.1093/mnras/167.1.31P 16A. Majumder et al
-
[10]
Fruscione, A., McDowell, J. C., Allen, G. E., et al. 2006, in Society of Photo-Optical Instrumentation Engineers (SPIE) Conference Series, Vol. 6270, Observatory Operations: Strategies, Processes, and Systems, ed. D. R. Silva & R. E. Doxsey, 62701V, doi: 10.1117/12.671760
-
[11]
Kondo, M. 2025, XRISM Observation of the Ophiuchus Galaxy Cluster: Quiescent Velocity Structure in the Dynamically Disturbed Core, arXiv, doi: 10.48550/arXiv.2507.00126
-
[12]
Gitti, M., Nulsen, P. E. J., David, L. P., McNamara, B. R., & Wise, M. W. 2011, The Astrophysical Journal, 732, 13, doi: 10.1088/0004-637X/732/1/13
-
[13]
Guo, F., & Oh, S. P. 2008, MNRAS, 384, 251, doi: 10.1111/j.1365-2966.2007.12692.x
arXiv 2008
-
[14]
Heckman, T. M., & Best, P. N. 2023, Galaxies, 11, 21, doi: 10.3390/galaxies11010021
-
[15]
Heckman, T. M., Roy, N., Best, P. N., & Kondapally, R. 2024, The Astrophysical Journal, 977, 125, doi: 10.3847/1538-4357/ad8f3e
-
[16]
2016, MNRAS, 455, 2139, doi: 10.1093/mnras/stv2483
Hillel, S., & Soker, N. 2016, MNRAS, 455, 2139, doi: 10.1093/mnras/stv2483
-
[17]
Hunter, J. D. 2007, Computing in Science & Engineering, 9, 90, doi: 10.1109/MCSE.2007.55
-
[18]
Ishisaki, Y., Kelley, R. L., Awaki, H., et al. 2022, in Society of Photo-Optical Instrumentation Engineers (SPIE) Conference Series, Vol. 12181, Space Telescopes and Instrumentation 2022: Ultraviolet to Gamma Ray, ed. J.-W. A. den Herder, S. Nikzad, & K. Nakazawa, 121811S, doi: 10.1117/12.2630654
-
[19]
Kaastra, J. S. 2017, A&A, 605, A51, doi: 10.1051/0004-6361/201629319
-
[20]
Kaastra, J. S., & Bleeker, J. A. M. 2016, Astron. Astrophys., 587, A151, doi: 10.1051/0004-6361/201527395
-
[21]
S., Mewe, R., & Nieuwenhuijzen, H
Kaastra, J. S., Mewe, R., & Nieuwenhuijzen, H. 1996, in UV and X-ray Spectroscopy of Astrophysical and Laboratory Plasmas, ed. K. Yamashita & T. Watanabe, 411–414
1996
-
[22]
Kaastra, J. S., Raassen, A. J. J., de Plaa, J., & Gu, L. 2018, SPEX X-ray spectral fitting package, 3.05.00 Zenodo, doi: 10.5281/zenodo.2419563
-
[23]
Kaastra, J. S., Raassen, A. J. J., de Plaa, J., & Gu, L. 2020, SPEX X-ray spectral fitting package, 3.06.01 Zenodo, doi: 10.5281/zenodo.4384188
-
[24]
Kirkpatrick, C. C., Gitti, M., Cavagnolo, K. W., et al. 2009, ApJL, 707, L69, doi: 10.1088/0004-637X/707/1/L69
-
[25]
Kondapally, R., Best, P. N., Raouf, M., et al. 2023, Monthly Notices of the Royal Astronomical Society, 523, 5292, doi: 10.1093/mnras/stad1813
-
[26]
Kassim, N. E. 2004, AJ, 127, 48, doi: 10.1086/379858
doi:10.1086/379858 2004
-
[27]
Li, J.-L., & Yang, H.-Y. K. 2025, Simulating AGN feedback in galaxy clusters with pre-existing turbulence, arXiv, doi: 10.48550/arXiv.2511.23267
-
[28]
Lodders, K., Palme, H., & Gail, H. P. 2009, Landolt B¨ ornstein, 4B, 712, doi: 10.1007/978-3-540-88055-434
-
[29]
2026, ApJ, 998, 160, doi: 10.3847/1538-4357/ae2fe3
Majumder, A., Heckman, T., Meunier, J., et al. 2026, ApJ, 998, 160, doi: 10.3847/1538-4357/ae2fe3
-
[30]
McNamara, B. R., Fabian, A. C., Russell, H. R., et al. 2026, arXiv e-prints, arXiv:2604.19607, doi: 10.48550/arXiv.2604.19607
-
[31]
Nulsen, P. E. J., Hambrick, D. C., McNamara, B. R., et al. 2005a, The Astrophysical Journal, 625, L9, doi: 10.1086/430945
-
[32]
Nulsen, P. E. J., McNamara, B. R., Wise, M. W., & David, L. P. 2005b, The Astrophysical Journal, 628, 629, doi: 10.1086/430845
-
[33]
2014, Monthly Notices of the Royal Astronomical Society, 444, 1236, doi: 10.1093/mnras/stu1499
Hlavacek-Larrondo, J. 2014, Monthly Notices of the Royal Astronomical Society, 444, 1236, doi: 10.1093/mnras/stu1499
-
[34]
Wise, M. W. 2006, The Astrophysical Journal, 652, 216, doi: 10.1086/507672
doi:10.1086/507672 2006
-
[35]
Randall, S. W., Nulsen, P. E. J., Jones, C., et al. 2015, The Astrophysical Journal, 805, 112, doi: 10.1088/0004-637X/805/2/112
-
[36]
2012, APLpy: Astronomical Plotting Library in Python,, Astrophysics Source Code Library, record ascl:1208.017
Robitaille, T., & Bressert, E. 2012, APLpy: Astronomical Plotting Library in Python,, Astrophysics Source Code Library, record ascl:1208.017
2012
-
[37]
Rose, T., Edge, A. C., Combes, F., et al. 2019, MNRAS, 485, 229, doi: 10.1093/mnras/stz406
-
[38]
Rose, T., McNamara, B. R., Meunier, J., et al. 2025, The Astrophysical Journal, 990, 42, doi: 10.3847/1538-4357/adf32d
-
[39]
Russell, H. R., Nulsen, P. E. J., Fabian, A. C., et al. 2026, MNRAS, 548, stag775, doi: 10.1093/mnras/stag775
-
[40]
2023, The Astronomy and Astrophysics Review, 31, 4, doi: 10.1007/s00159-023-00149-2
Ruszkowski, M., & Pfrommer, C. 2023, The Astronomy and Astrophysics Review, 31, 4, doi: 10.1007/s00159-023-00149-2
-
[41]
Sheardown, A., Fish, T. M., Roediger, E., et al. 2019, ApJ, 874, 112, doi: 10.3847/1538-4357/ab0c06
-
[42]
Simionescu, A., Roediger, E., Nulsen, P. E. J., et al. 2009a, Astronomy & Astrophysics, 495, 721, doi: 10.1051/0004-6361:200811071
-
[43]
Simionescu, A., Werner, N., B¨ ohringer, H., et al. 2009b, Astronomy & Astrophysics, 493, 409, doi: 10.1051/0004-6361:200810225 AGN-Driven Gas Motions in Hydra-A17
-
[44]
Simionescu, A., Kilbourne, C., Russell, H. R., et al. 2026, A&A, 707, A124, doi: 10.1051/0004-6361/202558423
-
[45]
Smith, R. J., Hudson, M. J., Nelan, J. E., et al. 2004, AJ, 128, 1558, doi: 10.1086/423915
doi:10.1086/423915 2004
-
[46]
2025, PASJ, 77, S1, doi: 10.1093/pasj/psaf023 van der Walt, S., Colbert, S
Tashiro, M., Kelley, R., Watanabe, S., et al. 2025, PASJ, 77, S1, doi: 10.1093/pasj/psaf023 van der Walt, S., Colbert, S. C., & Varoquaux, G. 2011, Computing in Science & Engineering, 13, 22, doi: 10.1109/MCSE.2011.37
-
[47]
2012, A&A, 544, A103, doi: 10.1051/0004-6361/201118688
Vazza, F., Roediger, E., & Br¨ uggen, M. 2012, A&A, 544, A103, doi: 10.1051/0004-6361/201118688
-
[48]
Willingale, R., Starling, R. L. C., Beardmore, A. P., Tanvir, N. R., & O’Brien, P. T. 2013, MNRAS, 431, 394, doi: 10.1093/mnras/stt175
-
[49]
Wise, M. W., McNamara, B. R., Nulsen, P. E. J., Houck, J. C., & David, L. P. 2007, The Astrophysical Journal, 659, 1153, doi: 10.1086/512767
doi:10.1086/512767 2007
-
[50]
Wright, J. T., & Eastman, J. D. 2014, PASP, 126, 838, doi: 10.1086/678541 XRISM Collaboration, Audard, M., Awaki, H., et al. 2025a, Disentangling Multiple Gas Kinematic Drivers in the Perseus Galaxy Cluster, arXiv, doi: 10.48550/ARXIV.2509.04421 XRISM Collaboration, Audard, M., Awaki, H., et al. 2025b, Nature, 638, 365, doi: 10.1038/s41586-024-08561-z XRI...
-
[51]
Zhuravleva, I., Churazov, E., Schekochihin, A. A., et al. 2014, Nature, 515, 85, doi: 10.1038/nature13830
-
[52]
A., Markevitch, M., Brunetti, G., & Giacintucci, S
ZuHone, J. A., Markevitch, M., Brunetti, G., & Giacintucci, S. 2013, ApJ, 762, 78, doi: 10.1088/0004-637X/762/2/78
discussion (0)
Sign in with ORCID, Apple, or X to comment. Anyone can read and Pith papers without signing in.