REVIEW 3 major objections 5 minor 79 references
This paper claims that showing readers which phrases are biased, or how much bias a statement contains in a categorized gauge, improves their unaided detection of biased words in new statements—while political congruence remains the stronge
Reviewed by Pith at T0; open to challenge. T0 means a machine referee read the full paper against a public rubric. the ladder, T0–T4 →
T0 review · deepseek-v4-flash
2026-08-01 10:58 UTC pith:C2HXZDUT
load-bearing objection A preregistered six-way comparison of bias indicators with a transfer detection task; worth engaging, but the headline effects rest on modest p-values and a shared annotation ground truth. the 3 major comments →
Visual Indicators to Increase the Detection of Linguistic Media Bias
The pith
A machine-rendered reading of the paper's core claim, the machinery that carries it, and where it could break.
Core claim
On its own terms, the paper claims that exposure to two indicator designs transfers to better unaided bias detection. Using two standard measures—F1 (balance of precision and recall) and d′ (sensitivity for distinguishing biased from unbiased words)—Bias Highlights and Bias Gauge produced adjusted F1 gains of about +0.067 over control; only Highlights also improved d′ by about 0.25 standard deviations. The gains came almost entirely from higher recall: participants found more biased words without more false alarms, and highlights also raised precision. The authors attribute the highlight effect to example-based learning through in-text localization and the gauge effect to an interpretable lo
What carries the argument
The central mechanism is the two-phase transfer test: participants first read statements with their assigned indicator, then, with the indicator removed, click on biased words in new statements; their selections are scored against three-expert word-level annotations using both F1 and d′. The load-bearing comparison is between the Bias Bar and the Bias Gauge, which encode the same underlying data (percentage of biased words) but differ only in the presence of a categorical low/medium/high reference frame—isolating whether interpretable context, not just magnitude, is what helps detection. The six indicators also embody different cognitive roles: in-text localization, summary magnitude, refere
Load-bearing premise
The three researchers who annotated the statements agreed only moderately on which words count as biased (inter-annotator agreement 0.47), yet their word labels are treated as the correct answer for scoring detection; if a different reasonable set of annotators would label different words, the measured gains partly reflect alignment with that particular standard rather than a general improvement in bias detection.
What would settle it
Run the same transfer comparison with an independent gold standard—for example, annotations from a separate expert panel or a large crowd sample—on the same or new statements. If the Bias Highlights and Bias Gauge advantages over the control shrink to null or reverse under that alternative ground truth, the claim that these indicators improve bias detection fails. A second check: replace the gauge with a plain-text statement of the bias percentage; if that produces the same transfer, the visual reference frame is not doing the causal work.
If this is right
- Bias-mitigation tools should favor indicators that show the actual biased phrases or place bias amounts in an interpretable reference frame over abstract summary scores, trust icons, political scales, or sentiment labels.
- Evaluation of such tools should include a behavioral detection task, because self-reported bias perception and word-level detection diverge (the Bias Bar lowered perceived bias without affecting detection).
- Political congruence is a strong moderator: readers systematically miss bias in statements aligned with their own politics, and designers cannot assume any indicator will override this.
- Perceived emotionality and perceived bias are strongly correlated (ρ=.71), but a sentiment indicator did not improve detection; emotional tone should not be treated as a proxy for bias in tool design.
- Abstract credibility cues may backfire: the Trust group reported the lowest trust and lowest sharing intention, suggesting shield-style indicators can provoke generalized skepticism rather than scrutiny.
Where Pith is reading between the lines
- If the highlight effect is genuine example-based pattern learning, repeated or longitudinal exposure in a training context might produce larger or more durable gains than the single-session transfer measured here; a delayed post-test would test this.
- Combining the two effective mechanisms—word-level highlights for localization plus a categorized gauge for calibration—may outperform either alone, since the paper's results suggest they improve detection through different routes.
- The gauge's F1 gain without a d′ gain suggests it works mainly by calibrating how much bias readers mark, so it may be better suited as normative feedback in annotation or education settings than as a standalone reader tool.
- Because the effects were measured against one expert annotation standard, a natural extension is to test whether the same indicator advantages hold when ground truth is built from independent expert panels or crowd judgments.
Editorial analysis
A structured set of objections, weighed in public.
Referee Report
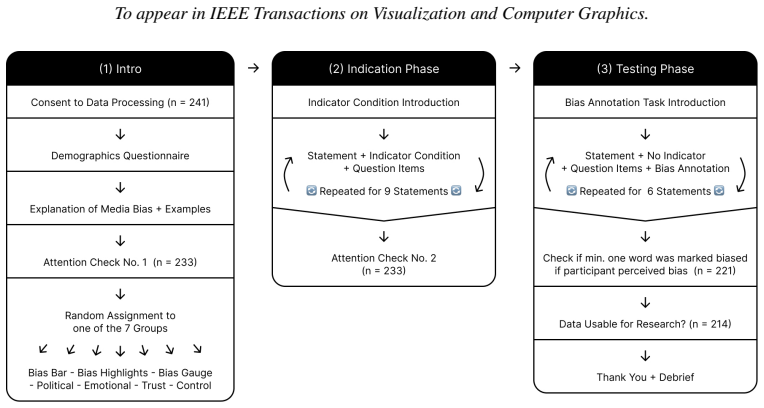
Summary. The paper reports a two-phase online experiment (n=214) comparing six visual indicators for linguistic media bias — Bias Bar, Bias Gauge, Bias Highlights, Political, Emotionality, and Trust — against a no-indicator control. In the indication phase, participants read Twitter/X-topic statements with their assigned indicator and answered perception questions; in the testing phase, the indicator was removed and participants marked biased words in new abortion-topic statements. The main dependent variables are F1 and d′ for word-level detection, plus perceived bias. The authors report that Bias Highlights (significant in both F1 and d′ models) and Bias Gauge (significant in the F1 model only) improve bias detection, while political congruency is the strongest negative predictor. The paper also analyzes perception, trust, sharing intention, and emotionality, concluding with design implications favoring in-text localization and reference-frame encodings.
Significance. If the reported effects are robust, the study would be a valuable contribution to the visualization and human-computer interaction literature on media bias mitigation: it compares more indicator types than most prior work, uses a behavioral detection task rather than only self-report, includes political congruence as a moderator, and is preregistered with open code and data. The distinction between F1 and d′ effects for Bias Gauge is analytically thoughtful, and the sensitivity analysis for the trust-score weights (Footnote 4) is a good practice. However, the headline claims rest on a small number of marginally significant contrasts, and the shared annotation source for both the indicator content and the outcome measure raises external-validity concerns that the paper does not fully address.
major comments (3)
- [§4.2, Tables 6–7] The central claim that Bias Highlights and Bias Gauge improve detection is based on uncorrected individual contrasts (F1: Gauge β=0.34, p=.031; Highlights β=0.33, p=.040; d′: Highlights β=0.35, p=.019). Six indicator contrasts are tested per model, yet no multiple-comparison correction is applied. The F1 omnibus test for indicator group is itself marginal (χ²(6)=12.75, p=.047), and no omnibus test is reported for the d′ model. Under Bonferroni or FDR correction, the individual contrasts would not reach significance. Please report corrected p-values or a pre-specified adjustment, and temper the wording accordingly. This is load-bearing because the abstract's 'significantly improve' statement relies on these fragile contrasts.
- [§3.4, §3.2, §3.3] The treatment content (Bias Highlights, Bias Gauge thresholds, Trust score) and the outcome scoring standard (F1 and d′) are derived from the same three-researcher word-level annotations. The inter-annotator agreement of α=0.47 indicates substantial subjectivity, and 97 of the 216 biased-word labels were resolved by discussion rather than unanimous agreement. Because participants in the Bias Highlights condition were directly shown these annotators' labels, the measured transfer gains may reflect alignment with these three individuals' labeling scheme rather than a generalizable bias-detection skill. The paper acknowledges in §5.5 that ground truth is approximate, but does not address the specific risk that treatment and outcome share a label source. Please add a robustness analysis using only the 119 unanimous labels for both scoring and indicator generation, or otherwise demonstrate th
- [§3.5, §5.5] The transfer claim is confounded with a topic change: the indication phase uses Twitter/X statements and the testing phase uses abortion statements. While crossed-topic transfer is a stronger test, simultaneous topic change means the observed effects could be specific to the pairing or to the testing topic's properties (e.g., its political divisiveness). The paper correctly notes in §5.5 that this estimates transfer under changed material conditions, but the abstract and conclusions phrase the result as improved 'bias detection skills' without this caveat. Please either add a fully crossed or counterbalanced design in future work, or explicitly frame the finding as transfer under simultaneous topic change in the abstract and conclusion.
minor comments (5)
- [§3.3/Appendix] The computation of d′ is not fully specified. Please clarify how hits and false alarms are defined at the word level, whether d′ is calculated per participant or per statement, and how trials with no selections are handled.
- [§3.7] The exclusion of 12 participants who did not mark any biased word yet later reported statements as biased is based on the outcome variable. Please report whether the main results are robust to including these participants, or justify the exclusion with an independent attention criterion.
- [§4.2, Table 6] Perceived Bias is included as a predictor in the F1 and d′ detection models. This is plausible as a covariate, but it may be endogenous to the treatment. Please discuss or omit in a sensitivity analysis.
- [§3.2, Table 1] The naming 'Emotionality' is used for the indicator, but table headings and model outputs refer to 'Sentiment.' Align terminology to avoid confusion.
- [Figure 1 caption] The caption contains a typo: 'T rust' instead of 'Trust'.
Circularity Check
No significant circularity: the study uses a supervised transfer design with held-out test statements, so the shared expert-annotation source does not force the reported detection gains.
full rationale
The paper's central claim is empirical, not derivational: after exposure to one indicator, participants completed a word-level bias detection task without the indicator on new statements. The only apparent overlap is that the Bias Highlights indicator and the detection ground truth both come from the same three-researcher expert annotations (Sections 3.2, 3.4, 3.5). This is a standard supervised training/evaluation split, not a circular reduction: the indication phase used nine Twitter/X statements, while the testing phase used six abortion-related statements with all indicators removed, so performance required transferring the annotation scheme to unseen content. A positive effect was not guaranteed by construction—participants could have failed to generalize. The acknowledged Krippendorff's α=0.47 subjectivity (Section 5.5) is a validity limitation, not circularity, and the paper itself distinguishes the Gauge's F1 improvement (calibration) from a d′ sensitivity gain. The Bias Gauge thresholds were derived from material-bias categories but were not fitted to the outcome, and sensitivity checks are reported. Self-citations to the authors' annotation guidelines and prior indicator studies are methodological references, not load-bearing uniqueness arguments. No equation, fitted parameter, or definition reduces the reported result to its own inputs.
Axiom & Free-Parameter Ledger
free parameters (2)
- Bias Gauge category thresholds =
10% / 30% biased-word share
- Trust score composition weights =
50/50 split
axioms (4)
- domain assumption Word-level expert annotations (three researchers, α=0.47) constitute a usable ground truth for linguistic bias detection and for generating the indicator content.
- domain assumption AllSides five-category political slant ratings are valid for the statements and sources used.
- domain assumption Sentiment polarity from Google's Natural Language API is an acceptable operationalization of emotionality.
- domain assumption Transfer from short statements in one topic (Twitter/X) to short statements in another topic (abortion) measures learning rather than topic-specific exposure.
read the original abstract
The influence of linguistic bias in online news articles is a growing concern, particularly in the context of shaping public opinion and rising political polarization. While there is a growing body of literature on indicators for misinformation, none have been sufficiently tested to counteract the influence of media bias. Hence, we design six indicators (Bias Bar, Bias Gauge, Bias Highlights, Political Scale, Sentiment Scale, and Trust Score) and test their impact on linguistic bias detection and perception in a two-phased experiment (n = 214). First, we expose participants to short, social-media-like statements along with one indicator and query bias perception. Second, we evaluate bias detection by removing the indicator and asking participants to mark biased words. In addition, we examine how trust, sharing discernment, and sentiment relate to bias perception and detection. Our results show that highlighting biased phrases and showing total bias with contextual information in a gauge significantly improve bias detection skills. However, the strongest predictor for reduced bias detection was political congruency between the statement and the participant. We conclude with design recommendations for linguistic media bias indicators in online news environments.
Figures



Reference graph
Works this paper leans on
-
[1]
census bureau.https://www.census.gov/, 2023
U.s. census bureau.https://www.census.gov/, 2023. 5
2023
-
[2]
J. An, M. Cha, K. Gummadi, J. Crowcroft, and D. Quercia. Visualizing media bias through twitter.Proceedings of the International AAAI Confer- ence on Web and Social Media, 6(2):2–5, 2021. doi: 10.1609/icwsm.v6i2. 14343 2, 4
-
[3]
A. Appelman and S. S. Sundar. Measuring Message Credibility: Construc- tion and Validation of an Exclusive Scale.Journalism & Mass Communi- cation Quarterly, 93(1):59–79, 2016. doi: 10.1177/1077699015606057 4, 12
-
[4]
A. Ardèvol-Abreu and H. G. de Zúñiga. Effects of editorial media bias perception and media trust on the use of traditional, citizen, and social media news.Journalism & Mass Communication Quarterly, 94(3):703– 724, 2017. doi: 10.1177/1077699016654684 1
-
[5]
Aslett, A
K. Aslett, A. M. Guess, R. Bonneau, J. Nagler, and Joshua A. Tucker. News credibility labels have limited average effects on news diet quality and fail to reduce misperceptions.Science Advances, 8(18):eabl3844,
-
[6]
Batailler, S
C. Batailler, S. M. Brannon, P. E. Teas, and B. Gawronski. A Signal Detection Approach to Understanding the Identification of Fake News. Perspectives on Psychological Science, 17(1):78–98, 2022. doi: 10.1177/ 1745691620986135 4
2022
-
[7]
E. P. S. Baumer, F. Polletta, N. Pierski, and G. K. Gay. A simple interven- tion to reduce framing effects in perceptions of global climate change.Envi- ronmental Communication, 11(3):289–310, 2015. doi: 10.1080/17524032. 2015.1084015 1, 2, 4, 9
arXiv 2015
-
[8]
M. M. Bhuiyan, M. Horning, S. W. Lee, and T. Mitra. NudgeCred: Sup- porting News Credibility Assessment on Social Media Through Nudges. Proceedings of the ACM on Human-Computer Interaction, 5(CSCW2):1– 30, 2021. doi: 10.1145/3479571 2
-
[9]
A. Bodaghi, K. A. Schmitt, P. Watine, and B. C. M. Fung. A literature review on detecting, verifying, and mitigating online misinformation. IEEE Transactions on Computational Social Systems, 11(4):5119–5145, Aug. 2024. doi: 10.1109/tcss.2023.3289031 1, 2
arXiv 2024
-
[10]
C. Budak, S. Goel, and J. M. Rao. Fair and balanced? Quantifying media bias through crowdsourced content analysis.Public Opinion Quarterly, 80(S1):250–271, Apr. 2016. doi: 10.1093/poq/nfw007 1
-
[11]
M. Chan, C. Vaccari, and M. Yamamoto. Cognitive drivers of misinfor- mation belief and sharing on social media: A cross-national comparison. Mass Communication and Society, 29(1):142–160, 2026. doi: 10.1080/ 15205436.2025.2577294 7
arXiv 2026
-
[12]
K. Clayton, S. Blair, J. A. Busam, S. Forstner, J. Glance, G. Green et al. Real solutions for fake news? Measuring the effectiveness of general warnings and fact-check tags in reducing belief in false stories on social media.Political Behavior, 42(4):1073–1095, 2020. doi: 10.1007/s11109 -019-09533-0 4
-
[13]
W. S. Cleveland and R. McGill. Graphical perception: Theory, experimen- tation, and application to the development of graphical methods.J. Am. Stat. Assoc., 79(387):531–554, Sept. 1984. 2, 3
1984
-
[14]
Diana and J
N. Diana and J. Stamper. Reducing bias in a misinformation classification task with value-adaptive instruction. InArtificial intelligence in education: 23rd international conference, AIED 2022, durham, UK, july 27–31, 2022, proceedings, part I, pp. 567–572. Springer-Verlag, 2022. doi: 10.1007/ 978-3-031-11644-5_50 10, 13
2022
-
[15]
Z. Epstein, N. Sirlin, A. Arechar, G. Pennycook, and D. Rand. The social media context interferes with truth discernment.Science advances, 9(9):eabo6169, 2023. doi: 10.1126/sciadv.abo6169 4, 12
-
[16]
S. L. Franconeri, L. M. Padilla, P. Shah, J. M. Zacks, and J. Hullman. The Science of Visual Data Communication: What Works.Psychological Science in the Public Interest, 22(3):110–161, Dec. 2021. doi: 10.1177/ 15291006211051956 2, 3, 7, 8, 9
2021
-
[17]
N. Fuhr, A. Giachanou, G. Grefenstette, I. Gurevych, A. Hanselowski, K. Jarvelin et al. An Information Nutritional Label for Online Documents. ACM SIGIR Forum, 51(3):46–66, 2018. doi: 10.1145/3190580.3190588 4, 10, 13
arXiv 2018
-
[18]
M. Färber, V . Burkard, A. Jatowt, and S. Lim. A Multidimensional Dataset Based on Crowdsourcing for Analyzing and Detecting News Bias. In Proceedings of the 29th ACM International Conference on Information & Knowledge Management, pp. 3007–3014. ACM, 2020. doi: 10.1145/ 3340531.3412876 5
arXiv 2020
-
[19]
Party affiliation
Gallup. Party affiliation. https://news.gallup.com/poll/15370/ party-affiliation.aspx, 2024. 5
2024
-
[20]
M. Gao, H. J. Do, and W.-T. Fu. An intelligent interface for organiz- ing online opinions on controversial topics. InProceedings of the 22nd international conference on intelligent user interfaces, IUI ’17, pp. 119–
-
[21]
Garrett and S
R. Garrett and S. Poulsen. Flagging facebook falsehoods: Self-identified humor warnings outperform fact checker and peer warnings.Journal of Computer-Mediated Communication, 24:240–258, 2019. doi: 10.1093/ jcmc/zmz012 10, 13
2019
-
[22]
R. K. Garrett and Robert M. Bond. Conservatives’ susceptibility to po- litical misperceptions.Science Advances, 7(23):eabf1234, 2021. doi: 10. 1126/sciadv.abf1234 8
2021
-
[23]
Natural language basics
Google Cloud. Natural language basics. https://cloud.google.com/ natural-language/docs/basics?hl=en, 2022. 4
2022
-
[24]
A. Guess, J. Nagler, and Joshua Tucker. Less than you think: Prevalence and predictors of fake news dissemination on Facebook.Science Advances, 5(1):eaau4586, 2019. doi: 10.1126/sciadv.aau4586 6
-
[25]
A. M. Guess, M. Lerner, B. Lyons, J. M. Montgomery, B. Nyhan, J. Reifler et al. A digital media literacy intervention increases discernment between mainstream and false news in the United States and India.Proceedings of the National Academy of Sciences of the United States of America, 117(27):15536–15545, 2020. doi: 10.1073/pnas.1920498117 2, 12
-
[26]
C. Harris. Searching for Diverse Perspectives in News Articles: Using an LSTM Network to Classify Sentiment. InESIDA ’18, 2018. 4
2018
-
[27]
C. G. Healey and J. T. Enns. Attention and visual memory in visualization and computer graphics.IEEE transactions on visualization and computer graphics, 18(7):1170–1188, 2012. doi: 10.1109/TVCG.2011.127 2, 7, 8
-
[28]
J. Heer and M. Bostock. Crowdsourcing graphical perception: using mechanical turk to assess visualization design. InProceedings of the SIGCHI Conference on Human Factors in Computing Systems, CHI ’10, pp. 203–212. Association for Computing Machinery, 2010. doi: 10.1145/ 1753326.1753357 2, 3
arXiv 2010
-
[29]
Hinterreiter, T
S. Hinterreiter, T. Spinde, S. Oberdörfer, I. Echizen, and M. E. Latoschik. News Ninja: Gamified Annotation of Linguistic Bias in Online News. Proc. ACM Hum.-Comput. Interact., 8(CHI PLAY), 2024. doi: 10.1145/ 3677092 4
2024
-
[30]
Hinterreiter, M
S. Hinterreiter, M. Wessel, F. Schliski, I. Echizen, M. E. Latoschik, and T. Spinde. NewsUnfold: Creating a News-Reading Application That Indicates Linguistic Media Bias and Collects Feedback. InProceedings of the international AAAI conference on web and social media (ICWSM’25), vol. 19. AAAI, June 2025. 2
2025
-
[31]
E. Hoes, B. Aitken, J. Zhang, T. Gackowski, and M. Wojcieszak. Promi- 10 To appear in IEEE Transactions on Visualization and Computer Graphics. nent misinformation interventions reduce misperceptions but increase scepticism.Nature Human Behaviour, 8(8):1545–1553, June 2024. doi: 10.1038/s41562-024-01884-x 8, 9
-
[32]
C. Hube and B. Fetahu. Neural based statement classification for biased language. InProceedings of the twelfth ACM international conference on web search and data mining, pp. 195–203. ACM, 2019. doi: 10.1145/ 3289600.3291018 1
arXiv 2019
-
[33]
A. Kause, T. Townsend, and W. Gaissmaier. Framing climate uncertainty: Frame choices reveal and influence climate change beliefs.Weather, Climate, and Society, 11(1):199–215, 2019. doi: 10.1175/WCAS-D-18 -0002.1 1
-
[34]
M. P. Kenning, R. Kelly, and S. L. Jones. Supporting Credibility Assess- ment of News in Social Media using Star Ratings and Alternate Sources. InExtended Abstracts of the 2018 CHI Conference on Human Factors in Computing Systems, pp. 1–6, 2018. doi: 10.1145/3170427.3188489 4
arXiv 2018
- [35]
-
[36]
A. Kim and A. R. Dennis. Says who? the effects of presentation format and source rating on fake news in social media.MIS Quarterly, 43(3):1025– 1040, 2019. doi: 10.25300/MISQ/2019/15188 2, 4, 9
-
[37]
A. Kim, P. L. Moravec, and A. R. Dennis. Combating Fake News on Social Media with Source Ratings: The Effects of User and Expert Reputation Ratings.Journal of Management Information Systems, 36(3):931–968,
-
[38]
J. Kirchner and C. Reuter. Countering fake news: A comparison of possible solutions regarding user acceptance and effectiveness.Proc. ACM Hum.-Comput. Interact., 4(CSCW2), 2020. doi: 10.1145/3415211 2
doi:10.1145/3415211 2020
-
[39]
N. Lee, Y . Bang, T. Yu, A. Madotto, and P. Fung. NeuS: Neutral Multi- News Summarization for Mitigating Framing Bias, 2022. doi: 10.48550/ arXiv.2204.04902 1
work page internal anchor Pith review Pith/arXiv arXiv doi:10.48550/arxiv.2204.04902 2022
-
[40]
Liedke and J
J. Liedke and J. Gottfried. U.S. adults under 30 now trust information from social media almost as much as from national news outlets, 2022. 2
2022
-
[41]
A. P. C. Lixun Su and M. F. Walsh. Trustworthy blue or untrustworthy red: The influence of colors on trust.Journal of Marketing Theory and Practice, 27(3):269–281, 2019. doi: 10.1080/10696679.2019.1616560 2, 4
arXiv 2019
-
[42]
M. Luo, J. T. Hancock, and D. M. Markowitz. Credibility Perceptions and Detection Accuracy of Fake News Headlines on Social Media: Effects of Truth-Bias and Endorsement Cues.Communication Research, 49(2):171– 195, 2022. doi: 10.1177/0093650220921321 2
- [43]
-
[44]
P. Majerczak and A. Strzelecki. Trust, media credibility, social ties, and the intention to share towards information verification in an age of fake news.Behavioral Sciences, 12(2):51, 2022. doi: 10.3390/bs12020051 8
-
[45]
C. Martel, G. Pennycook, and D. G. Rand. Reliance on emotion promotes belief in fake news.Cognitive Research: Principles and Implications, 5(1):47, 2020. doi: 10.1186/s41235-020-00252-3 4, 12
-
[46]
Martínez Alonso, A
H. Martínez Alonso, A. Delamaire, and B. Sagot. Annotating omission in statement pairs. InProceedings of the 11th linguistic annotation workshop, pp. 41–45. Association for Computational Linguistics, Apr. 2017. doi: 10. 18653/v1/W17-0805 1
2017
-
[47]
P. Moravec, R. Minas, and A. R. Dennis. Fake News on Social Media: People Believe What They Want to Believe When it Makes No Sense at All, 2018. doi: 10.2139/ssrn.3269541 8
-
[48]
P. L. Moravec, A. Kim, and A. R. Dennis. Appealing to sense and sensi- bility: System 1 and system 2 interventions for fake news on social media. Information Systems Research, 31(3):987–1006, 2020. doi: 10.1287/isre. 2020.0927 2, 4, 7
arXiv 2020
-
[49]
S. Mullainathan and A. Shleifer. Media bias. Working paper 9295, National Bureau of Economic Research, Oct. 2002. Series: Working paper series. doi: 10.3386/w9295 1
-
[50]
T. Munzner. A Nested Model for Visualization Design and Validation. IEEE Transactions on Visualization and Computer Graphics, 15(6):921– 928, Nov. 2009. doi: 10.1109/TVCG.2009.111 3
-
[51]
Munzner.Visualization Analysis and Design
T. Munzner.Visualization Analysis and Design. A K Peters/CRC Press, Dec. 2014. doi: 10.1201/b17511 2, 8
doi:10.1201/b17511 2014
-
[52]
S. Park, S. Kang, S. Chung, and J. Song. NewsCube: delivering multiple aspects of news to mitigate media bias.Proceedings of the SIGCHI Conference on Human Factors in Computing Systems, pp. 443–452, 2009. doi: 10.1145/1518701.1518772 2, 8
arXiv 2009
-
[53]
D. M. W. Powers. Evaluation: From precision, recall and F-factor to ROC, informedness, markedness & correlation.arXiv, 2, 2008. 4
2008
-
[54]
pui Sally Chan, C
M. pui Sally Chan, C. R. Jones, K. H. Jamieson, and D. Albarracín. Debunking: A meta-analysis of the psychological efficacy of messages countering misinformation.Psychological Science, 28(11):1531–1546,
-
[55]
Recasens, C
M. Recasens, C. Danescu-Niculescu-Mizil, and D. Jurafsky. Linguistic models for analyzing and detecting biased language. InProceedings of the 51st annual meeting of the association for computational linguistics (volume 1: Long papers), pp. 1650–1659. Association for Computational Linguistics, Aug. 2013. 1
2013
-
[56]
P. Shah and J. Hoeffner. Review of Graph Comprehension Research: Implications for Instruction.Educational Psychology Review, 14(1):47– 69, Mar. 2002. doi: 10.1023/A:1013180410169 2, 8
-
[57]
D. Simkin and R. Hastie. An Information-Processing Analysis of Graph Perception.Journal of the American Statistical Association, 82(398):454– 465, June 1987. doi: 10.1080/01621459.1987.10478448 2
arXiv 1987
-
[58]
C. Speier. The influence of information presentation formats on complex task decision-making performance.International Journal of Human- Computer Studies, 64(11):1115–1131, Nov. 2006. doi: 10.1016/j.ijhcs. 2006.06.007 8
doi:10.1016/j.ijhcs 2006
-
[59]
T. Spinde, F. Hamborg, K. Donnay, A. Becerra, and B. Gipp. Enabling News Consumers to View and Understand Biased News Coverage: A Study on the Perception and Visualization of Media Bias. InProceedings of the ACM/IEEE Joint Conference on Digital Libraries in 2020, JCDL ’20, pp. 389–392. Association for Computing Machinery, 2020. doi: 10. 1145/3383583.33986...
arXiv 2020
-
[60]
Spinde, S
T. Spinde, S. Hinterreiter, F. Haak, T. Ruas, H. Giese, N. Meuschke et al. The media bias taxonomy: A systematic literature review on the forms and automated detection of media bias.arXiv, 2023. 1, 4
2023
-
[61]
T. Spinde, C. Jeggle, M. Haupt, W. Gaissmaier, and H. Giese. How do we raise media bias awareness effectively? Effects of visualizations to communicate bias.PLOS ONE, 17(4):1–14, 2022. doi: 10.1371/journal. pone.0266204 1, 2, 4, 8, 9, 10, 13
doi:10.1371/journal 2022
- [62]
-
[63]
T. Spinde, M. Plank, J.-D. Krieger, T. Ruas, B. Gipp, and A. Aizawa. Neural Media Bias Detection Using Distant Supervision With BABE - Bias Annotations By Experts. InFindings of the Association for Computational Linguistics: EMNLP 2021, 2021. doi: 10.18653/v1/2021.findings-emnlp. 101 1, 4, 5, 9
-
[64]
H. Strobelt, D. Oelke, B. C. Kwon, T. Schreck, and H. Pfister. Guidelines for Effective Usage of Text Highlighting Techniques.IEEE transactions on visualization and computer graphics, 22(1):489–498, Jan. 2016. doi: 10.1109/TVCG.2015.2467759 2, 3, 4, 8, 9
arXiv 2016
-
[65]
Sultan, A
M. Sultan, A. N. Tump, N. Ehmann, P. Lorenz-Spreen, R. Hertwig, A. Goll- witzer et al. Susceptibility to online misinformation: A systematic meta- analysis of demographic and psychological factors, 2024. doi: 10.31234/ osf.io/7u4fg 1, 2
2024
-
[66]
S. S. Sundar. The MAIN Model: A Heuristic Approach to Understanding Technology Effects on Credibility.Digital Media, Youth, and Credibility, (Foundation Series on Digital Media and Learning):73–100, 2008. 2, 8, 9
2008
-
[67]
J. Sweller. Cognitive load during problem solving: Effects on learning.Cognitive Science, 12(2):257–285, 1988. doi: 10.1207/ s15516709cog1202_4 2, 3, 7, 8, 9
1988
-
[68]
Thornhill, Q
C. Thornhill, Q. Meeus, J. Peperkamp, and B. Berendt. A Digital Nudge to Counter Confirmation Bias.Frontiers in Big Data, 2, 2019. 2
2019
- [69]
-
[70]
T. G. van der Meer and M. Hameleers. Fighting biased news diets: Using news media literacy interventions to stimulate online cross-cutting media exposure patterns.New Media & Society, 23(11):3156–3178, 2021. doi: 10.1177/1461444820946455 8, 9
-
[71]
Ware.Information visualization: perception for design
C. Ware.Information visualization: perception for design. Morgan Kaufmann Publishers Inc., 2004. doi: 10/d3gg9c 1, 2, 3
2004
-
[72]
Wessel, T
M. Wessel, T. Horych, T. Ruas, A. Aizawa, B. Gipp, and T. Spinde. Introducing MBIB - the first media bias identification benchmark task and dataset collection. InProceedings of 46th international ACM SIGIR conference on research and development in information retrieval. ACM, 11
-
[73]
S. K. Yeo, L. Y .-F. Su, D. Brossard, M. A. Xenos, D. A. Scheufele, and E. A. Corley. The effect of comment moderation on perceived bias in science news.Information, Communication & Society, 22(1):129–146,
-
[79]
doi: 10.1080/1369118X.2017.1356861 12 A APPENDIX Table 5: Constructs and question items in the order that participants answer them after each statement. Construct Question(s) Scale Bias Please tell us what you think about the following sentence: In my opinion, this article is biased. [62, 73] ’Strongly disagree’ (1) to ’Strongly agree’ (6) Perceived Emo. ...
arXiv 2017
-
[123]
Association for Computing Machinery, 2017. doi: 10.1145/3025171. 3025230 4
doi:10.1145/3025171 2017
-
[2017]
doi: 10.1177/0956797617714579 2
-
[2019]
doi: 10.1080/07421222.2019.1628921 2, 4, 12
arXiv 2019
-
[2022]
doi: 10.1126/sciadv.abl3844 2, 4, 8
-
[2023]
doi: 10.1145/3539618.3591882 1
discussion (0)
Sign in with ORCID, Apple, or X to comment. Anyone can read and Pith papers without signing in.