REVIEW 3 major objections 5 minor 119 references
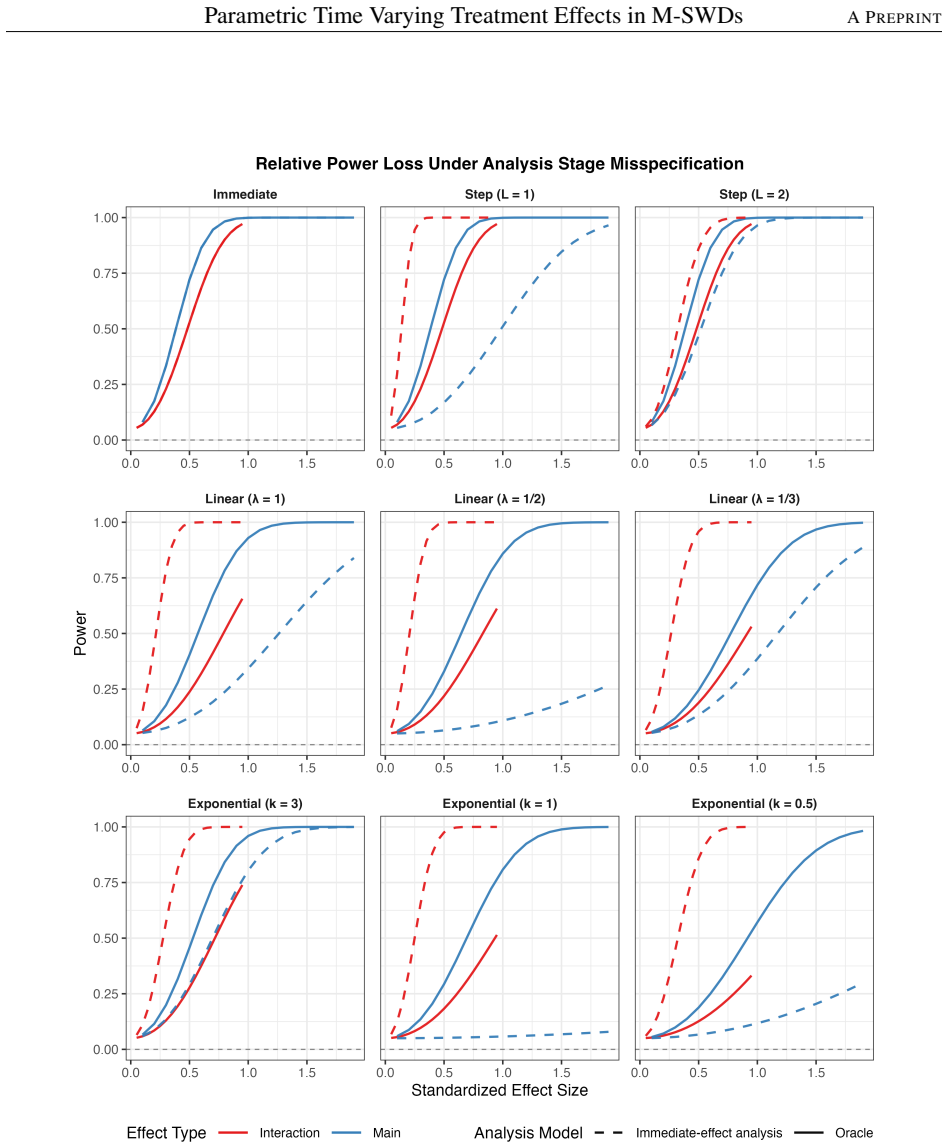
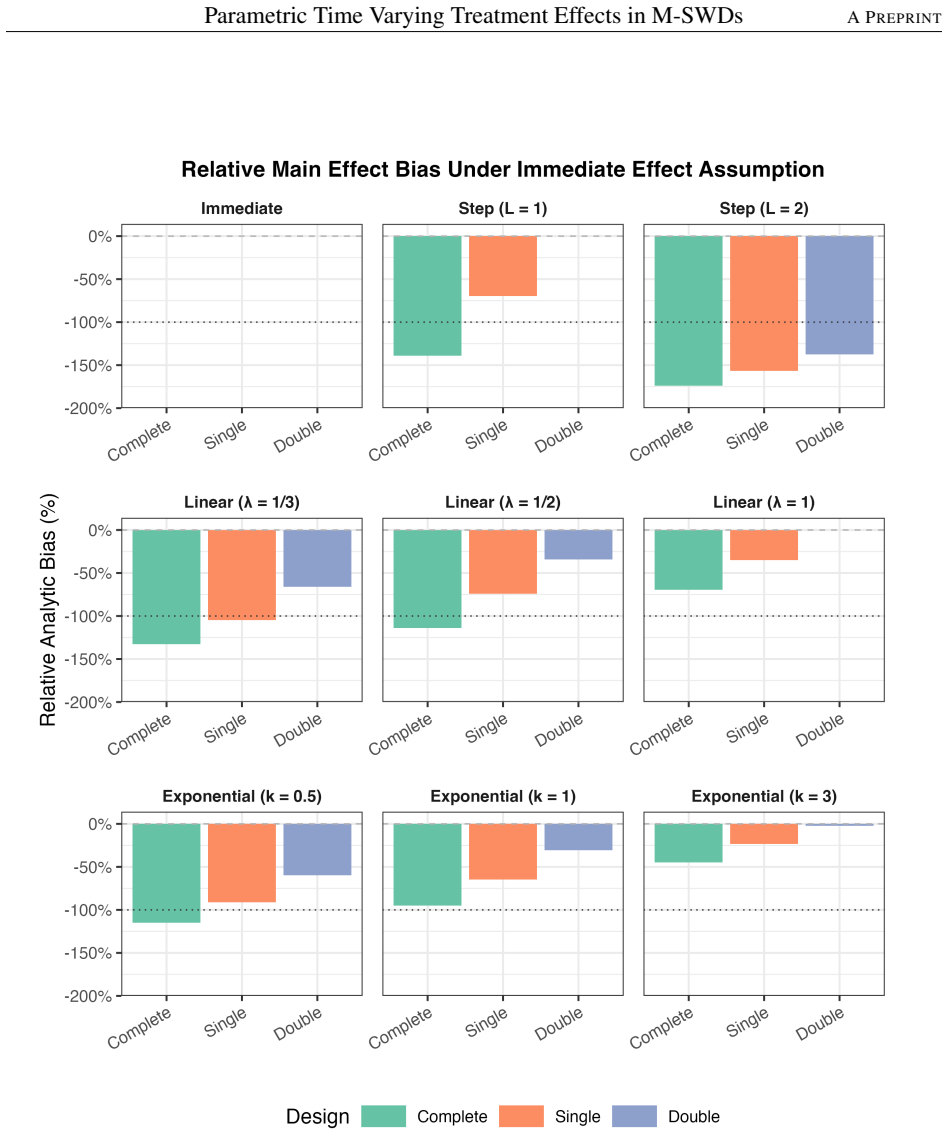
Gradual intervention effects in multiple-intervention stepped wedge trials can require two to five times more clusters for nominal power, and immediate-effect analysis biases main and interaction effects in opposite directions.
Reviewed by Pith at T0; open to challenge. T0 means a machine referee read the full paper against a public rubric. the ladder, T0–T4 →
T0 review · deepseek-v4-flash
2026-08-01 04:05 UTC pith:ZUWOVEFB
load-bearing objection A genuinely useful framework with two fixable but load-bearing technical errors; send to review, but don't rely on the numbers yet. the 3 major comments →
A Framework for Parametric Time-Varying Treatment Effects in Multiple Intervention Stepped Wedge Design Clinical Trials in the Presence of Non-Uniform Cluster-Period Correlation Structures
The pith
A machine-rendered reading of the paper's core claim, the machinery that carries it, and where it could break.
Core claim
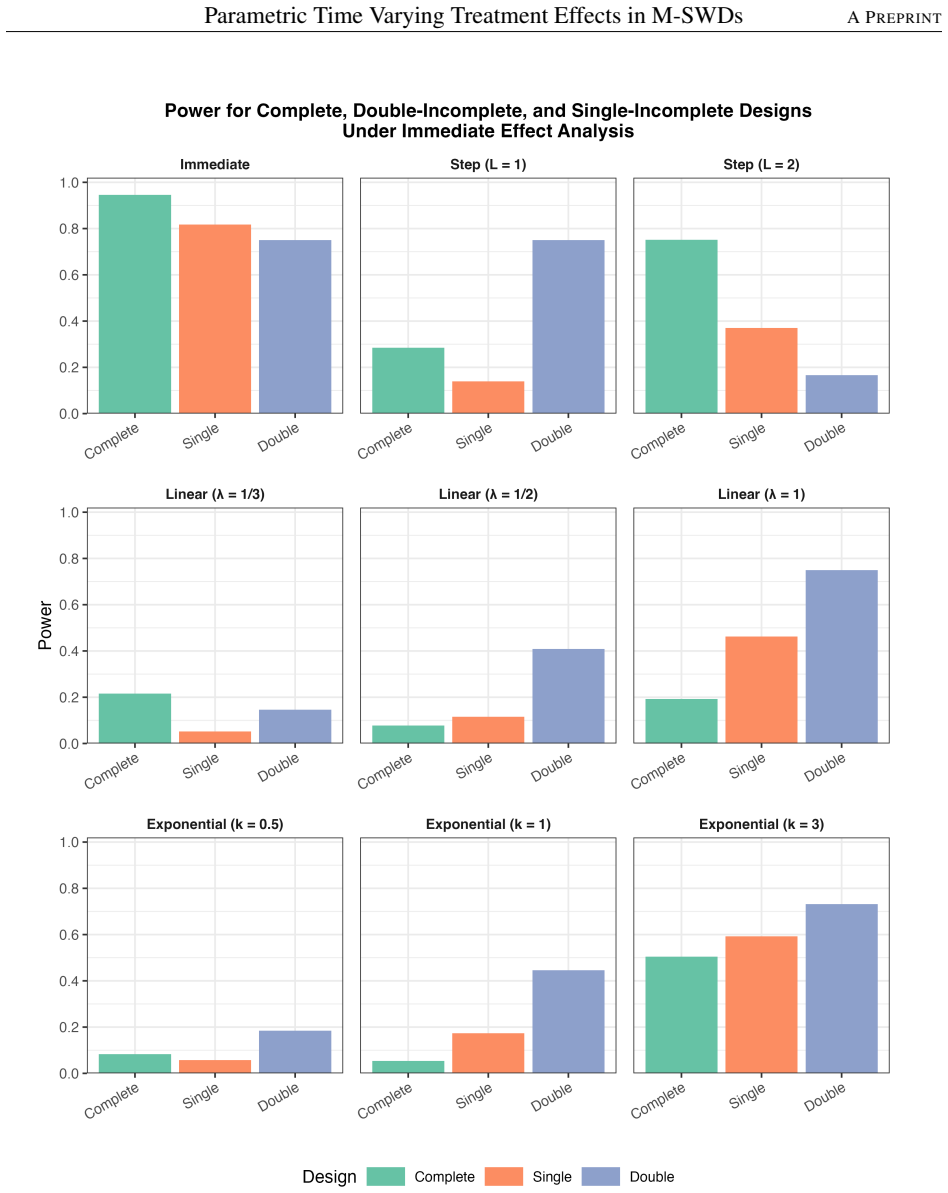
At the core of the paper is a construction called the modified fixed-effects design matrix Z*, which replaces each 0/1 treatment indicator in a multiple-intervention stepped wedge design with the cluster-period average of a prespecified parametric exposure-response function f_q(s). Plugging Z* into the generalized least squares estimator gives closed-form expressions for the treatment-effect estimand, its variance, power, and the bias incurred when one instead fits the standard immediate-effect model. The paper's central demonstration is that non-instantaneous uptake—step delay, linear ramp, or exponential approach—redistributes information toward later exposure periods, so that achieving no
What carries the argument
The load-bearing object is Z*, the modified fixed-effects design matrix. In it, the treatment column for intervention q and cluster-period i,j is the integral over [j,j+1] of the parametric exposure-response function min{1, f_q(s)}. This matrix enters the GLS formulas Cov(θ̂*) = (Z*ᵀV⁻¹Z*)⁻¹ and E[θ̂] = (ZᵀV⁻¹Z)⁻¹ ZᵀV⁻¹ Z* θ for misspecified analysis, so the entire power, variance, and bias analysis flows from how well Z* captures the true exposure-time dynamics.
Load-bearing premise
The load-bearing premise is that the period-average exposure in Z* is computed correctly; for a linear ramp that reaches its ceiling inside a period, the paper's formula min{1, λ(s+1/2)} can overstate the true period-average exposure, and that error propagates into all linear-curve power and bias numbers.
What would settle it
Recompute Z* for a fast linear ramp, e.g. λ=2 at exposure s=0, using the exact period average of min{2u,1} over [0,1] (which is 0.75) instead of the paper's min{1, λ(s+1/2)}=1; rerun the Section 5 power and bias calculations for linear curves under this corrected column. If the reported 2-5x cluster inflation or the bias magnitudes for linear uptake change materially, the linear-curve numerical results are artifacts of the integral approximation.
If this is right
- Design-stage power calculations for multiple-intervention stepped wedge trials should be run under plausible exposure-response curves, not only under the immediate-effect default.
- Interaction effects are substantially more sensitive to uptake dynamics than main effects, so trials powered adequately for main effects can be severely underpowered for interactions.
- Reported power from an immediate-effect analysis of time-varying data is not true power: the estimator targets a biased weighted average of exposure-time-specific effects, and rejection probabilities reflect that bias.
- Incomplete designs that drop early post-transition periods can reduce bias under a misspecified immediate-effect analysis, but they generally reduce power when the analysis model is correct, making them a robustness tool rather than an efficiency tool.
- For slow linear or exponential uptake curves, achieving nominal power may require two to five times as many clusters as an immediate-effect design, so sample size should be tied to the assumed uptake rate.
Where Pith is reading between the lines
- The formulation implies that a design-stage sensitivity analysis should report power and required clusters as functions of the uptake parameters (ramp rate, latency, exponential rate), not as a single number, because the design's adequacy hinges on the assumed exposure-response curve.
- An immediate-effect analysis could be reinterpreted as targeting a precision-weighted average of exposure-time-specific effects; reporting that implied estimand alongside the maximum effect would make the bias transparent and aid interpretability.
- The strong interaction sensitivity suggests that trials aiming to detect interactions should consider multi-arm parallel or crossover designs, or at least enrich the design with additional clusters that cross over to both interventions simultaneously, to compensate for the information loss under gradual uptake.
- The incomplete-design results suggest a testable practical extension: choose the dropped post-transition periods adaptively once the exposure-response curve is estimated, rather than fixing them at the design stage, potentially improving both robustness and efficiency.
Editorial analysis
A structured set of objections, weighed in public.
Referee Report
Summary. This manuscript develops a design-stage framework for multiple-intervention stepped wedge (M-SWD) trials with parametric time-varying treatment effects and flexible cluster-period correlation structures. The authors construct a modified design matrix Z* whose entries are period averages of parametric exposure-response functions, then derive GLS estimands, variances, power, and bias expressions for correctly specified and misspecified analyses. The central claims are that time-varying effects can require a multiple-fold increase in the number of clusters and that analysis-stage misspecification (fitting an immediate-effect model to data generated under gradual uptake) induces substantial bias and power miscalibration, with main and interaction effects affected differently. Analytic results are complemented by simulation validation for correctly specified oracle power, and by extensive sensitivity analyses over effect-curve parameters, correlation structures, and incomplete designs.
Significance. If corrected, this would be a useful contribution. The paper addresses a genuine gap—design-stage power and sample-size calculations for M-SWD trials under exposure-time dynamics—and extends existing single-intervention exposure-time methodology to multiple interventions and interaction surfaces. The analytic bias decomposition in §3.7 is clean, and the simulation validation in Supplement E supports the correctly specified power formulas. The distinction between the estimand targeted under correct specification and the biased weighted-average estimand under misspecification is conceptually important. However, the current manuscript contains load-bearing technical errors in the misspecified-power formula and in the construction of Z* for linear ramp effects and bilinear interaction surfaces; these undermine the numerical claims as presented and require substantive revision.
major comments (3)
- [§3.6.4, Eq. (19)] The Wald statistic under analysis-stage misspecification is not the statistic of any defined test. The numerator uses E[Θ*_A] = (Z^T V^{-1}Z)^{-1}Z^T V^{-1}Z*Θ_A, which is the mean of an estimator using design Z, but the denominator uses Var(Θ*) = (Z*^T V^{-1}Z*)^{-1}, which is the variance of the oracle estimator using Z*. For the misspecified estimator, Var(Θ*_A) = (Z^T V^{-1}Z)^{-1} under the stated covariance model. Therefore the rejection probabilities in Fig. 12, the statements about deflated standard errors in §5.3.1, and the incomplete-design rejection results in Fig. 18 are not interpretable as power of the misspecified immediate-effect analysis. Please recompute these quantities with the correct variance (or explicitly define and justify a different testing procedure) and update all affected text and figures.
- [§3.6.3, Linear Effect Curve] The period-average formula for the linear effect curve is incorrect when the interval [s, s+1] contains the cap point of min(λs, 1). Equation (16) defines f_linear(s)=min(λs,1), but the derivation integrates λs without the cap and then (implicitly) applies min{1,·} to the result. For intervals straddling s=1/λ, the true integral of min(λs,1) is piecewise and can be substantially smaller. Example: λ=2, s=0 gives 1 in the paper, while the true period average is ∫_0^{0.5}2u du + ∫_{0.5}^1 1 du = 0.75. This error propagates into all linear-ramp analytic power, bias, and cluster-requirement results (Figs. 7–9, 11–18) and into the worked example of Supplement C. Please provide the correct piecewise integral and update the affected numerical results.
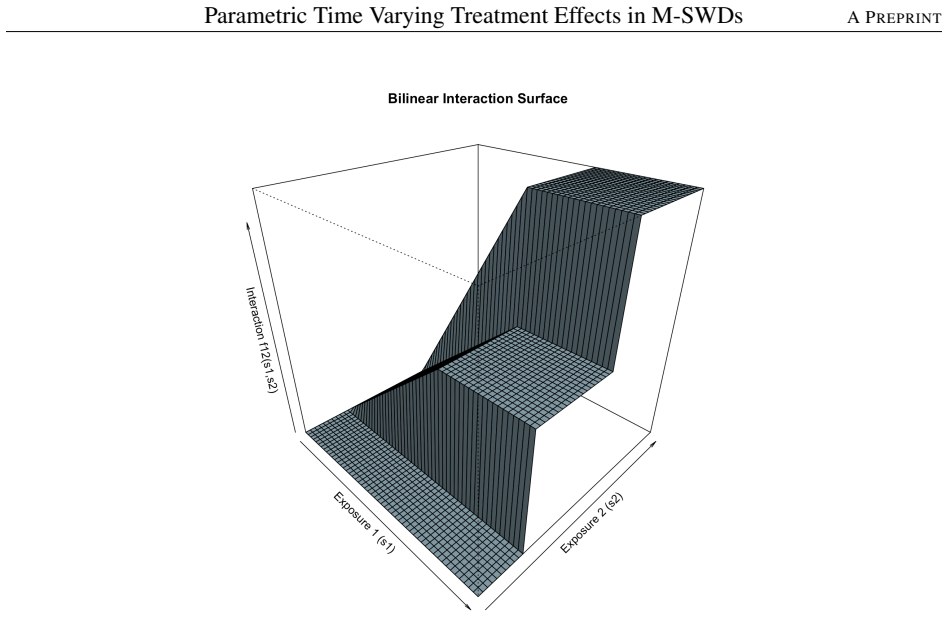
- [§3.5 and Supplement C, bilinear interaction surface] For the bilinear interaction surface f_{1,2}(s1,s2)=κ f1(s1) f2(s2), the period-average column in Z* is computed as κ (∫_{s1}^{s1+1} f1)(∫_{s2}^{s2+1} f2)—a product of marginal integrals. Within a cluster-period, however, both exposure times advance simultaneously with time; the correct period average is the line integral κ ∫_0^1 f1(s1+t) f2(s2+t) dt. These generally differ. For example, with f1(u)=u, f2(v)=v, the product gives κ(s1+1/2)(s2+1/2), whereas the line integral gives κ[(s1+1/2)(s2+1/2)+1/12]. This affects the bilinear-surface power and bias results in §5.5 and Figures 20–21, as well as the interaction columns of the worked Z* matrix in Supplement C. Please correct the construction or state explicitly that the product-of-marginals is an approximation and justify it.
minor comments (5)
- [Supplement C] In the worked example, h_q is defined using 'max{1, ∫...}' but the definition in §3.6.2 uses 'min{1, ∫...}', and the numerical values use the min. Please correct the typo.
- [§3.8, Eq. (20)] The notation V = σ²_ν R + σ²_c I_T + ... + Σ_q τ²_q Z^{(q)} is dimensionally inconsistent: Z^{(q)} is a column of the design matrix, not a square matrix. The intended term is τ²_q Z^{(q)}Z^{(q)T} (as used in Supplement D). Please fix the notation.
- [Figure 8 caption] The caption lists '0.2 BPICC, 0.05 WPICC', which is reversed relative to the text (WPICC=0.2, BPICC=0.05). Please check all figure captions for consistency.
- [§5.1 and Supplement E] The simulation validation covers only the correctly specified oracle analysis. Given that the misspecified power formula in Eq. (19) is central to several claims, please add a validation of the corrected misspecified-power procedure or clearly separate the oracle validation from the misspecified analytic results.
- [General] No code or data are provided. Given the complexity of the design matrices and the numerical errors identified, making reproducible code and a table of the key parameter values (or a small reproducible example) would substantially strengthen the manuscript.
Circularity Check
No significant circularity: the analytic derivation is closed-form from explicit assumptions and independently validated by simulation.
full rationale
The paper's derivation is self-contained. The modified design matrix Z* in §3.6.2 is constructed by explicit period-averaging of prespecified parametric response functions (Eq. 16, etc.), and the GLS estimand, variance, power, and bias expressions (Eqs. 8–10, 18–19, §3.7) are standard closed-form projections from those stated inputs. No parameter is fitted to the paper's own power or bias results and then reported as a prediction. The only self-citation (Levy and Yamal 2026) supplies the flexible cluster-period correlation matrix R, but the assumption is restated directly in §3.3.2 and the examples (compound symmetry, AR(1)) are standard; no uniqueness theorem is imported, and the citation is not load-bearing. The analytic results are externally checked against GLS-oracle simulations (Supplemental E: mean absolute difference 0.003), so the power claims are not merely restatements of their inputs. The reviewer's Eq. (19) concern—that the misspecified mean is paired with the oracle variance—is an internal consistency/correctness question about the defined test statistic, not a circular reduction: θ*_A is not fit to the rejection probabilities, and the bias results use a separate, well-defined projection. The §3.6.3 linear-ramp integral omission of the min{1,·} cap is a numerical-accuracy issue, not circularity. Therefore no circular step is present.
Axiom & Free-Parameter Ledger
free parameters (5)
- Effect-curve shape parameters φ_q (λ, L, k, γ, m, etc.) =
n/a — user-specified; e.g., λ=1/3, L=2, k varied
- Interaction surface parameters (κ, τ, ξ, δ, L1, L2) =
n/a — user-specified; e.g., κ=0.9
- Cluster-period correlation parameters (γ for CS, φ for AR(1)) =
γ=0.5 or 0.7; φ=0.7
- Variance components and design constants =
σ²_y=2.0, WPICC=0.2, BPICC=0.05, n=50; 8 clusters, 7 periods
- Standardized maximum effects θ_max =
main d=1.0 or 0.7; interaction d=0.5 or 0.35
axioms (6)
- domain assumption The generative model is a linear mixed model with cluster, cluster-period, and individual random effects plus fixed period effects (Eq. 1 and Eq. 12).
- domain assumption Exposure time s_{qij} is measured in whole periods since transition, observation density is uniform within each cluster-period, and the period-average of the effect curve is an unbiased weight.
- ad hoc to paper At the design stage, the parametric exposure-response function and its parameters are correctly specified.
- domain assumption The cluster-period covariance V is known exactly for the power and bias formulas.
- domain assumption No interference between clusters, no missing data beyond planned incomplete designs, equal cluster sizes, and one cluster per sequence.
- standard math Power is defined by a two-sided Wald test with a normal approximation and known variance.
read the original abstract
Stepped wedge design (SWD) trials typically assume that treatment effects are immediate following implementation, but this assumption is often unrealistic in pragmatic settings where effects evolve over exposure time. This impact is further complicated in multiple-intervention stepped wedge designs (M-SWDs), due to their complex crossover patterns. Existing work has addressed time-varying treatment effects for main effects at the analysis stage using nonparametric approaches; however, the implications for design-stage power and estimand interpretation in M-SWDs remain largely unaddressed. We develop a unified framework that incorporates parametric exposure-response functions into a modified fixed-effects design matrix, Z*, and derive corresponding generalized least squares (GLS) expressions for treatment effect estimands, variance, power, and bias under model misspecification. Analytic and simulation results demonstrate that time-varying effects can require multiple-fold increase in the number of clusters required to achieve the nominal target power. Misspecification can also induce large bias in treatment effect estimates, with particularly pronounced and non-uniform impacts on interaction effects. These findings demonstrate that treatment effect estimands in M-SWDs depend critically on assumptions about exposure-time dynamics and that failure to account for time-varying effects can lead to substantial miscalibration of power and biased inference, affecting main and interaction effects differently.
Figures









Reference graph
Works this paper leans on
-
[1]
Statistics in Medicine , author =
Power analysis for stepped wedge trials with multiple interventions , volume =. Statistics in Medicine , author =. 2022 , pages =. doi:10.1002/sim.9301 , abstract =
doi:10.1002/sim.9301 2022
-
[2]
Journal of Clinical Epidemiology , author =
Proposed variations of the stepped-wedge design can be used to accommodate multiple interventions , volume =. Journal of Clinical Epidemiology , author =. 2017 , pmid =. doi:10.1016/j.jclinepi.2017.04.004 , abstract =
-
[3]
Cancer Research , author =
The. Cancer Research , author =. 1987 , pages =
1987
-
[4]
American journal of epidemiology , author =
Intraclass. American journal of epidemiology , author =. 1995 , pages =. doi:10.1093/oxfordjournals.aje.a117194 , abstract =
-
[5]
American Journal of Public Health , author =
Design and. American Journal of Public Health , author =. 2004 , pmid =
2004
-
[6]
Statistics in Medicine , author =
Analysis of cluster randomized cross-over trial data: a comparison of methods , volume =. Statistics in Medicine , author =. 2007 , note =. doi:10.1002/sim.2537 , abstract =
doi:10.1002/sim.2537 2007
-
[7]
Contemporary Clinical Trials , author =
Design and analysis of stepped wedge cluster randomized trials , volume =. Contemporary Clinical Trials , author =. 2007 , pmid =. doi:10.1016/j.cct.2006.05.007 , abstract =
-
[8]
Longitudinal data analysis using generalized linear models , volume =. Biometrika , author =. 1986 , pages =. doi:10.1093/biomet/73.1.13 , abstract =
-
[9]
Biometrical Journal , author =
Relative efficiency of unequal versus equal cluster sizes in cluster randomized trials using generalized estimating equation models , volume =. Biometrical Journal , author =. 2018 , note =. doi:10.1002/bimj.201600262 , abstract =
-
[10]
Journal of Consulting and Clinical Psychology , author =
Random-effects regression models for clustered data with an example from smoking prevention research , volume =. Journal of Consulting and Clinical Psychology , author =. 1994 , note =. doi:10.1037/0022-006X.62.4.757 , abstract =
-
[11]
Biometrics , author =
Random-effects models for longitudinal data , volume =. Biometrics , author =. 1982 , pmid =
1982
-
[12]
Implementation Science , author =
Evaluating the impact of multilevel evidence-based implementation strategies to enhance provider recommendation on human papillomavirus vaccination rates among an empaneled primary care patient population: a study protocol for a stepped-wedge cluster randomized trial , volume =. Implementation Science , author =. 2018 , keywords =. doi:10.1186/s13012-018-...
-
[13]
BMC Health Services Research , author =
Effectiveness of sensor monitoring in an occupational therapy rehabilitation program for older individuals after hip fracture, the. BMC Health Services Research , author =. 2017 , keywords =. doi:10.1186/s12913-016-1934-0 , abstract =
-
[14]
Enhancing doctor-patient relationships in community health care institutions: the. BMC Psychiatry , author =. 2023 , pmid =. doi:10.1186/s12888-023-04948-w , abstract =
-
[15]
Journal of Clinical Epidemiology , author =
Systematic review of stepped wedge cluster randomized trials shows that design is particularly used to evaluate interventions during routine implementation , volume =. Journal of Clinical Epidemiology , author =. 2011 , keywords =. doi:10.1016/j.jclinepi.2010.12.003 , abstract =
-
[16]
Effectiveness of sensor monitoring in a rehabilitation programme for older patients after hip fracture: a three-arm stepped wedge randomised trial , volume =. Age and Ageing , author =. 2019 , pages =. doi:10.1093/ageing/afz074 , abstract =
-
[17]
Assessment, management, and incidence of neonatal jaundice in healthy neonates cared for in primary care: a prospective cohort study , volume =. Scientific Reports , author =. 2022 , note =. doi:10.1038/s41598-022-17933-2 , abstract =
-
[18]
Screening and treatment to reduce severe hyperbilirubinaemia in infants in primary care (. BMJ Open , author =. 2019 , pmid =. doi:10.1136/bmjopen-2018-028270 , abstract =
-
[19]
Understanding the cluster randomised crossover design: a graphical illustration of the components of variation and a sample size tutorial , volume =. Trials , author =. 2017 , keywords =. doi:10.1186/s13063-017-2113-2 , abstract =
-
[20]
The Lancet Infectious Diseases , author =
Stepped-wedge trial design to evaluate. The Lancet Infectious Diseases , author =. 2015 , pmid =. doi:10.1016/S1473-3099(15)00078-X , language =
-
[21]
Reporting of stepped wedge cluster randomised trials: extension of the. The BMJ , author =. 2018 , pmid =. doi:10.1136/bmj.k1614 , abstract =
-
[22]
Clinical trials (London, England) , author =
Statistical. Clinical trials (London, England) , author =. 2016 , pmid =. doi:10.1177/1740774516646578 , abstract =
-
[23]
Statistical Methods in Medical Research , author =
Mixed-effects models for the design and analysis of stepped wedge cluster randomized trials:. Statistical Methods in Medical Research , author =. 2021 , pmid =. doi:10.1177/0962280220932962 , abstract =
-
[24]
The stepped wedge cluster randomised trial: rationale, design, analysis, and reporting , volume =. BMJ , author =. 2015 , pmid =. doi:10.1136/bmj.h391 , abstract =
doi:10.1136/bmj.h391 2015
-
[25]
Statistics in Medicine , author =
Statistical efficiency and optimal design for stepped cluster studies under linear mixed effects models , volume =. Statistics in Medicine , author =. 2016 , note =. doi:10.1002/sim.6850 , abstract =
doi:10.1002/sim.6850 2016
-
[26]
International Journal of Epidemiology , author =
Methods for sample size determination in cluster randomized trials , volume =. International Journal of Epidemiology , author =. 2015 , pmid =. doi:10.1093/ije/dyv113 , abstract =
-
[27]
Simple sample size calculation for cluster-randomized trials. , volume =. International Journal of Epidemiology , author =. 1999 , pages =. doi:10.1093/ije/28.2.319 , abstract =
-
[28]
Contemporary clinical trials , author =
Ethical and epistemic issues in the design and conduct of pragmatic stepped-wedge cluster randomized clinical trials , volume =. Contemporary clinical trials , author =. 2022 , pmid =. doi:10.1016/j.cct.2022.106703 , abstract =
arXiv 2022
-
[29]
Inadequacy of ethical conduct and reporting of stepped wedge cluster randomized trials:. Clinical Trials , author =. 2017 , note =. doi:10.1177/1740774517703057 , abstract =
-
[30]
Stepped wedge cluster randomized controlled trial designs: a review of reporting quality and design features , volume =. Trials , author =. 2017 , pmid =. doi:10.1186/s13063-017-1783-0 , abstract =
-
[31]
International Journal of Epidemiology , author =
Reflection on modern methods: when is a stepped-wedge cluster randomized trial a good study design choice? , volume =. International Journal of Epidemiology , author =. 2020 , pmid =. doi:10.1093/ije/dyaa077 , abstract =
-
[32]
Annals of Family Medicine , author =
What. Annals of Family Medicine , author =. 2004 , pmid =. doi:10.1370/afm.141 , abstract =
doi:10.1370/afm.141 2004
-
[33]
American Journal of Epidemiology , author =. 1981 , pages =. doi:10.1093/oxfordjournals.aje.a113261 , abstract =
-
[34]
International Journal of Epidemiology , author =
Cluster randomized trials with a small number of clusters: which analyses should be used? , volume =. International Journal of Epidemiology , author =. 2018 , pages =. doi:10.1093/ije/dyx169 , abstract =
-
[35]
BMC Medical Research Methodology , author =
The stepped wedge trial design: a systematic review , volume =. BMC Medical Research Methodology , author =. 2006 , pmid =. doi:10.1186/1471-2288-6-54 , abstract =
-
[36]
Design and
DONNER, ALLAN and Klar, Neil , year =. Design and
-
[37]
Stepped wedge randomised controlled trials: systematic review of studies published between 2010 and 2014 , volume =. Trials , author =. 2015 , keywords =. doi:10.1186/s13063-015-0839-2 , abstract =
-
[38]
Eldridge, Sandra and Kerry, Sally , year =. A
-
[39]
Statistics in Medicine , author =
Relative efficiency of unequal cluster sizes in stepped wedge and other trial designs under longitudinal or cross‐sectional sampling , volume =. Statistics in Medicine , author =. 2018 , pmid =. doi:10.1002/sim.7943 , abstract =
doi:10.1002/sim.7943 2018
-
[40]
Journal of Clinical Epidemiology , author =
Stepped wedge designs could reduce the required sample size in cluster randomized trials , volume =. Journal of Clinical Epidemiology , author =. 2013 , keywords =. doi:10.1016/j.jclinepi.2013.01.009 , abstract =
-
[41]
Journal of Clinical Epidemiology , author =
The stepped wedge cluster randomized trial always requires fewer clusters but not always fewer measurements, that is, participants than a parallel cluster randomized trial in a cross-sectional design , volume =. Journal of Clinical Epidemiology , author =. 2013 , pages =. doi:10.1016/j.jclinepi.2013.07.008 , number =
-
[42]
The efficiency of stepped wedge vs. cluster randomized trials:. Journal of Clinical Epidemiology , author =. 2013 , pages =. doi:10.1016/j.jclinepi.2013.07.007 , number =
-
[43]
Journal of Clinical Epidemiology , author =
Sample size calculations for stepped wedge and cluster randomised trials: a unified approach , volume =. Journal of Clinical Epidemiology , author =. 2016 , pmid =. doi:10.1016/j.jclinepi.2015.08.015 , abstract =
-
[44]
Statistics in Medicine , author =
Design and analysis of three-arm parallel cluster randomized trials with small numbers of clusters , volume =. Statistics in Medicine , author =. 2021 , note =. doi:10.1002/sim.8828 , abstract =
doi:10.1002/sim.8828 2021
-
[45]
Statistics in medicine , author =
Constrained randomization and statistical inference for multi-arm parallel cluster randomized controlled trials , volume =. Statistics in medicine , author =. 2022 , pmid =. doi:10.1002/sim.9333 , abstract =
doi:10.1002/sim.9333 2022
-
[46]
Reporting of. JAMA , author =. 2019 , pages =. doi:10.1001/jama.2019.3087 , abstract =
arXiv 2019
-
[47]
Clinical Cancer Research , author =
Multi-. Clinical Cancer Research , author =. 2008 , pages =. doi:10.1158/1078-0432.CCR-08-0325 , abstract =
-
[48]
More multiarm randomised trials of superiority are needed , volume =. The Lancet , author =. 2014 , pages =. doi:10.1016/S0140-6736(14)61122-3 , number =
-
[49]
International Journal of Epidemiology , author =
Sample size calculators for planning stepped-wedge cluster randomized trials: a review and comparison , volume =. International Journal of Epidemiology , author =. 2022 , pmid =. doi:10.1093/ije/dyac123 , abstract =
-
[50]
Statistical Methods in Medical Research , author =
Sample size determination for stepped wedge cluster randomized trials in pragmatic settings , volume =. Statistical Methods in Medical Research , author =. 2021 , note =. doi:10.1177/09622802211022392 , abstract =
-
[51]
Systematic review finds major deficiencies in sample size methodology and reporting for stepped-wedge cluster randomised trials , volume =. BMJ Open , author =. 2016 , pmid =. doi:10.1136/bmjopen-2015-010166 , abstract =
-
[52]
American Journal of Preventive Medicine , author =
Food. American Journal of Preventive Medicine , author =. 2023 , pages =. doi:10.1016/j.amepre.2023.03.022 , abstract =
-
[53]
Impact of. BMJ , author =. 2011 , pmid =. doi:10.1136/bmj.d5886 , abstract =
-
[54]
Designing a stepped wedge trial: three main designs, carry-over effects and randomisation approaches , volume =. Trials , author =. 2015 , keywords =. doi:10.1186/s13063-015-0842-7 , abstract =
-
[55]
Statistics in Medicine , author =
Sample size calculation for stepped wedge and other longitudinal cluster randomised trials , volume =. Statistics in Medicine , author =. 2016 , pmid =. doi:10.1002/sim.7028 , abstract =
doi:10.1002/sim.7028 2016
-
[56]
Statistical Methods in Medical Research , author =
Impact of non-uniform correlation structure on sample size and power in multiple-period cluster randomised trials , volume =. Statistical Methods in Medical Research , author =. 2019 , note =. doi:10.1177/0962280217734981 , abstract =
-
[57]
Statistics in Medicine , author =
Accounting for a decaying correlation structure in cluster randomized trials with continuous recruitment , volume =. Statistics in Medicine , author =. 2019 , note =. doi:10.1002/sim.8089 , abstract =
doi:10.1002/sim.8089 2019
-
[58]
Statistics in Medicine , author =
Bias and inference from misspecified mixed-effect models in stepped wedge trial analysis , volume =. Statistics in Medicine , author =. 2017 , note =. doi:10.1002/sim.7348 , abstract =
doi:10.1002/sim.7348 2017
-
[59]
Statistical Methods in Medical Research , author =
Inference for the treatment effect in multiple-period cluster randomised trials when random effect correlation structure is misspecified , volume =. Statistical Methods in Medical Research , author =. 2019 , note =. doi:10.1177/0962280218797151 , abstract =
-
[60]
Allocation techniques for balance at baseline in cluster randomized trials: a methodological review , volume =. Trials , author =. 2012 , keywords =. doi:10.1186/1745-6215-13-120 , abstract =
-
[61]
Statistics in Medicine , author =
An evaluation of constrained randomization for the design and analysis of group-randomized trials with binary outcomes , volume =. Statistics in Medicine , author =. 2017 , pmid =. doi:10.1002/sim.7410 , abstract =
doi:10.1002/sim.7410 2017
-
[62]
Statistical design of
-
[63]
Annals of Internal Medicine , author =. 2010 , note =. doi:10.7326/0003-4819-152-11-201006010-00232 , abstract =
-
[64]
Improving the reporting of pragmatic trials: an extension of the. The BMJ , author =. 2008 , pmid =. doi:10.1136/bmj.a2390 , abstract =
-
[65]
Consort 2010 statement: extension to cluster randomised trials , volume =. BMJ , author =. 2012 , pmid =. doi:10.1136/bmj.e5661 , abstract =
-
[66]
Statistics in Medicine , author =
Cohort versus cross-sectional design in large field trials:. Statistics in Medicine , author =. 1994 , note =. doi:10.1002/sim.4780130108 , abstract =
-
[67]
Statistics in Medicine , author =
A simple sample size formula for analysis of covariance in cluster randomized trials , volume =. Statistics in Medicine , author =. 2012 , note =. doi:10.1002/sim.5352 , abstract =
doi:10.1002/sim.5352 2012
-
[68]
BJOG : an international journal of obstetrics and gynaecology , author =
Randomised controlled trials—the gold standard for effectiveness research , volume =. BJOG : an international journal of obstetrics and gynaecology , author =. 2018 , pmid =. doi:10.1111/1471-0528.15199 , number =
arXiv 2018
-
[69]
Korean Journal of Anesthesiology , author =
Randomization in clinical studies , volume =. Korean Journal of Anesthesiology , author =. 2019 , pmid =. doi:10.4097/kja.19049 , abstract =
-
[70]
, volume =
Randomisation. , volume =. BMJ : British Medical Journal , author =. 1991 , pmid =
1991
-
[71]
Neuropsychiatric Disease and Treatment , author =
Randomized controlled trials – a matter of design , volume =. Neuropsychiatric Disease and Treatment , author =. 2016 , pmid =. doi:10.2147/NDT.S101938 , urldate =
-
[72]
Treatment allocation in controlled trials: why randomise? , volume =. BMJ , author =. 1999 , pmid =. doi:10.1136/bmj.318.7192.1209 , abstract =
arXiv 1999
-
[73]
Statistics in Medicine , author =
Stepped-wedge cluster randomised controlled trials: a generic framework including parallel and multiple-level designs , volume =. Statistics in Medicine , author =. 2015 , note =. doi:10.1002/sim.6325 , abstract =
doi:10.1002/sim.6325 2015
-
[74]
Intensive Care Medicine , author =
Introducing. Intensive Care Medicine , author =. 2004 , keywords =. doi:10.1007/s00134-004-2268-7 , abstract =
-
[75]
Annals of Epidemiology , author =
Regression. Annals of Epidemiology , author =. 2005 , keywords =. doi:10.1016/j.annepidem.2004.08.007 , abstract =
-
[76]
The. Epidemiology , author =. 2007 , pages =. doi:10.1097/EDE.0b013e3181200199 , abstract =
-
[77]
Journal of Clinical Epidemiology , author =
Explanatory and. Journal of Clinical Epidemiology , author =. 2009 , pages =. doi:10.1016/j.jclinepi.2009.01.012 , abstract =
-
[78]
New England Journal of Medicine , author =
Pragmatic. New England Journal of Medicine , author =. 2016 , note =. doi:10.1056/NEJMra1510059 , abstract =
-
[79]
Clinical trials (London, England) , author =
Exploring the ethical and regulatory issues in pragmatic clinical trials , volume =. Clinical trials (London, England) , author =. 2015 , pmid =. doi:10.1177/1740774515598334 , abstract =
-
[80]
Practical. JAMA , author =. 2003 , pages =. doi:10.1001/jama.290.12.1624 , abstract =
discussion (0)
Sign in with ORCID, Apple, or X to comment. Anyone can read and Pith papers without signing in.