REVIEW 3 major objections 5 minor 83 references
Weak sodium absorption does not mean little dust: Type Ib SN 2024vjc is heavily reddened anyway.
Reviewed by Pith at T0; open to challenge. T0 means a machine referee read the full paper against a public rubric. the ladder, T0–T4 →
SN 2024vjc is substantially dust-attenuated (E(B-V)~0.45–0.8 mag) despite weak Na I D absorption that would imply only ~0.18 mag, a clear counterexample to that common diagnostic.
T0 review reviewed 2026-07-30 challenge →
load-bearing objection Solid multi-method case study of a Type Ib with high host reddening and weak Na I D; the counterexample is real enough to publish, but the “independent diagnostics” are more correlated than the abstract claims. the 3 major comments →
Dust Without Na I D Trace: The Case of Highly Attenuated Type Ib SN 2024vjc
The pith
A machine-rendered reading of the paper's core claim, the machinery that carries it, and where it could break.
The reading
Core claim
SN 2024vjc is a normal-looking Type Ib supernova that suffers substantial host attenuation (E(B−V) ~ 0.45–0.8 mag from color templates, color-curve evolution, spectral dereddening, and the Balmer decrement) even though Na I D is weak or absent and the standard sodium calibration returns only ~0.18 mag. It is therefore a clear counterexample to the assumption that weak sodium means negligible host dust.
What carries the argument
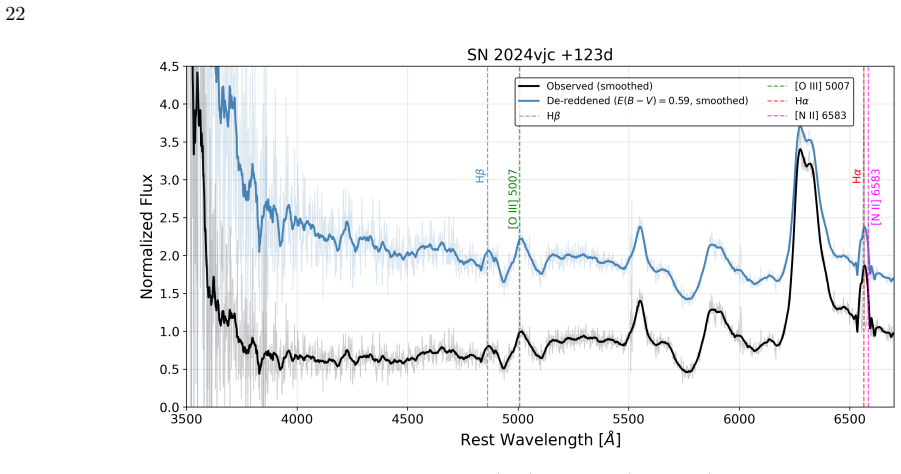
Cross-check of independent attenuation estimators against Na I D equivalent width: SN color templates and 0–20 day color-curve excess, continuum matching by dereddening an early spectrum to a low-reddening Type Ib comparison, SuperBol blackbody temperature/radius consistency with helium line-forming radii, and the Hα/Hβ Balmer decrement from the underlying H II region, with late-time narrow lines and blue continuum excess supporting local photoionization of sodium.
Load-bearing premise
That SN 2024vjc is intrinsically an ordinary Type Ib, so its red colors and continuum are almost entirely dust rather than an unusually cool or peculiar explosion.
What would settle it
Show that after careful multi-method analysis SN 2024vjc remains intrinsically much cooler and fainter than normal Type Ib events even when dust is minimized, or obtain high-resolution spectra and environment maps proving there is little dust along the line of sight while sodium stays weak.
If this is right
- Absence of Na I D in SESN spectra can no longer be read as automatic proof of low host reddening.
- Intrinsic luminosities, nickel masses, and temperatures for stripped-envelope supernovae need multi-diagnostic dust corrections, not sodium alone.
- Young H II regions near explosion sites can suppress neutral sodium while dust still attenuates the light.
- A hidden tail of highly reddened SESNe may be under-counted if samples are filtered or corrected only with Na I D.
- Balmer decrements and SN color/spectral methods can disagree with Na I D in a scale-dependent way that maps dust near the progenitor versus larger ISM scales.
Where Pith is reading between the lines
- Routine classification pipelines that flag ‘low extinction’ from non-detections of Na I D may systematically misplace the faint, red end of the SESN luminosity function.
- Photoionization of sodium in star-forming sites may be common enough that Na I D–E(B−V) relations calibrated on SNe Ia should be treated as upper limits on reliability for core-collapse events.
- Spatially resolved IFU maps of sodium, calcium, and dust continuum at SESN sites would cleanly separate ionization from true dust-poor gas.
- If the high-attenuation tail is real and missed, volumetric rates and binary-channel demographics for stripped-envelope supernovae need upward revision at the dusty end.
Editorial analysis
A structured set of objections, weighed in public.
Referee Report
Summary. The manuscript presents multi-band optical/NIR photometry (ATLAS, REM, SPECULOOS, VST, EFOSC2) and 11 epochs of optical spectroscopy of the Type Ib SN 2024vjc, followed to ~130 days post-explosion. The central claim is that SN 2024vjc is heavily attenuated by host dust (E(B−V) ≈ 0.45–0.8 mag from SN color templates, color-curve evolution, spectral dereddening against SN 2012au, and the H II-region Balmer decrement), while showing only a marginal Na I D detection whose Poznanski et al. (2012) calibration yields E(B−V) ≈ 0.18 mag. The object thus constitutes a counterexample to the assumption that weak/absent Na I D implies negligible host attenuation. The authors propose that photoionization of neutral sodium by the radiation field of a young H II region at the explosion site — supported by narrow Hα, [N II], Hβ emission and a late-time blue continuum excess — explains the discrepancy. Consistency checks (photospheric vs. excitation temperature; blackbody radius vs. He line-forming radius) favor the high-attenuation interpretation over an intrinsically cool, faint SN.
Significance. If the result holds, this is a methodologically important cautionary case: it demonstrates in a single well-observed object that the Na I D EW diagnostic can fail badly for SESNe embedded in young H II regions, complementing the SNe Ia result of Phillips et al. (2013) and the population-level trend in Barbarino et al. (2021) and Gutiérrez et al. (2026). Strengths include a genuinely multi-facility, 130-day photometric/spectroscopic dataset; a set of physics-based cross-checks (excitation vs. blackbody temperature; photospheric vs. He line-forming radius) that do not depend on color templates; direct environmental evidence (narrow Hα/[N II]/Hβ, blue continuum excess) supporting the proposed photoionization mechanism; and a falsifiable population-level prediction (a hidden subpopulation of obscured SESNe) framed honestly as an open question. Data availability via WISeREP and machine-readable photometry is commendable. The work is unlikely to settle the frequency of such objects, but a documented counterexample is, as the authors argue, sufficient to retire the diagnostic's universal use.
major comments (3)
- [§5.1, Table 4] §5.1, Table 4: The three SN-based estimates (0.667±0.501, 0.57±0.09, 0.767+0.033/−0.032) share a single premise — that SN 2024vjc's intrinsic SED follows canonical SESN templates — so they are correlated measurements of one systematic, not three independent confirmations. This matters because the manuscript itself supplies reasons to doubt the premise: the unusually flat r−i evolution at 0–20 d (§5.1) and the high He I λ5876 velocities (§4.1). The headline range 0.45–0.8 mag and the abstract's claim of 'multiple, independent attenuation diagnostics' should be revised accordingly. A concrete fix: propagate the full scatter (not just the median) of the A_V^host=0 T18 subsample as a systematic floor on E(B−V) from the color methods, so the reader can see how much of the 0.5–0.8 range survives intrinsic-color diversity. The genuinely SN-independent anchors (Balmer decrement, T_exc vs T_BB, R
- [§5.1, Eq. (1), Fig. 13] §5.1, Eq. (1), Fig. 13: The spectral-dereddening estimate E(B−V)=0.767±0.033 carries a purely statistical uncertainty and relies on SN 2012au as the unreddened reference — an object the paper itself describes as more energetic, engine-powered, with larger blueshifts and line widths (§4, Milisavljevic et al. 2013). Since this is the highest estimate and sets the upper end of the quoted 0.45–0.8 mag range, robustness should be demonstrated by repeating the SSR analysis with at least one alternative reference (SN 2016bau is the obvious choice given the flattened-spectrum match in Fig. 8), or by assigning a systematic uncertainty estimated from the spread across references. The peak-normalization step (which removes the A_V constraint and leaves only the degeneracy ridge) should also be discussed as a limitation on the absolute scale.
- [§5.2, §6.1] §5.2 and §6.1: The 'counterexample' framing rests on adopting the Poznanski et al. (2012) calibration (E(B−V)=0.18), but the Turatto et al. (2003) branch applied to the same measured EW gives 0.444±0.044 — in agreement with the Balmer decrement and only ~1.5σ below the color-evolution value. The manuscript reports this but does not draw the consequence: the discrepancy is not simply 'Na I D underestimates the dust'; it is that no single EW–E(B−V) relation is consistent with all diagnostics simultaneously, and the anomalous D2/D1≈1 ratio (saturation or He I λ5876 contamination) means the EW itself is unreliable here. The strongest defensible version of the claim should be stated explicitly in §6.1 and the abstract, since a reader could otherwise conclude the counterexample evaporates under a defensible calibration choice.
minor comments (5)
- [§5.3] §5.3/Table 6: The Balmer decrement rests on a single faint Hβ line ((7.42±1.04)×10⁻¹⁹ erg s⁻¹ cm⁻²) plus assumed Case B. Please state the detection significance and the sensitivity of E(B−V)_Balmer to departures from Case B (e.g., collisional excitation in a low-density region), and reiterate that this sightline need not coincide with the SN's (the chance-projection caveat in §6.3 is welcome).
- [§5.4] §5.4/Table 5: The T_BB and R_BB<R_He checks assume a pure blackbody (unity dilution factor), which is approximate for SESN photospheres. A sentence quantifying how a realistic dilution factor (e.g., 0.7–0.9) would shift the no-extinction T_BB≈4100 K and the radius constraint would strengthen this argument.
- [§5.2] §5.2: Please clarify whether the marginal Na I D detection at 6.25 Å resolution could include a Galactic component blended with the redshifted host doublet (MW A_V=0.037 mag suggests it is negligible, but this should be stated).
- [§4] §4, first paragraph: the rescaling of the −13 d GMOS-S spectrum to match the EFOSC2 continuum slope is ad hoc; please state the size of the correction and confirm it does not affect the Na I D continuum fit in Fig. 14.
- [Various] Abstract: 'the commonly assumption' → 'the common assumption'. §2.5: 'Environmentn' typo. §3, final paragraph: the sentence 'we do not attempt a quantitative assessment of how common or statistically significant this feature is therefore lies beyond the scope' is ungrammatical. Ion notation is inconsistent (Siii/Hei vs Si II/He I). Table 6 reports 12+log(O/H)=8.5539±0.0181 — four decimal places is excessive given the calibration scatter of the N2 diagnostic.
Circularity Check
Mild circularity: color/SED-template E(B-V) and the subsequent 'normal T/L once dereddened' checks are largely the same assumption restated, not independent confirmations; Balmer and morphology anchors keep the central claim from collapsing.
specific steps
-
fitted input called prediction
[§5.1 color methods → §5.4 SuperBol / Table 5 / Fig. 15]
"In summary, the comparison with the intrinsic color templates of M. D. Stritzinger et al. (2018) gives E(B−V) = 0.667±0.501 mag, while the color curve fitting method based on M. R. Drout et al. (2011) yields E(B−V) = 0.57±0.09 mag. ... As the assumed host attenuation increases, the inferred peak luminosity rises by a factor of ∼4.5, the blackbody temperature at g-band peak shifts to higher values (reaching ∼6400 K for E(B−V)host = 0.59 mag ...). The extinction-corrected luminosity and temperature are consistent with those of typical stripped-envelope supernovae"
E(B-V) is fitted so that observed colors/continuum match assumed intrinsic SESN templates. Applying that same E(B-V) in SuperBol then 'predicts' normal T_BB and peak L versus the T18 Ib sample. For a Planck-like SED, color excess and temperature excess are linked through the extinction law; restoring template colors largely forces T and M back into the normal locus. The T/L agreement is therefore statistically forced by the color-derived input, not an independent prediction.
-
self definitional
[§5.1 spectral SSR dereddening; §7 conclusions item 1]
"We de-redden the earliest spectrum of SN 2024vjc using a CCM89 attenuation curve... We compare SN 2024vjc with SN 2012au, which is previously shown to exhibit a similar spectral morphology at early epochs and is known to suffer little to no host-galaxy attenuation. ... This yields E(B−V) = 0.767+0.033−0.032 mag. ... A normal SN Ib with the high attenuation provides a consistent picture for essentially all the observed features except only for the Na ID absorption, providing the most straightforward interpretation."
Intrinsic normality of the continuum shape is assumed by matching to SN 2012au (chosen for line-morphology similarity); E(B-V) is defined as the CCM89 scaling that minimizes continuum SSR against that reference. Declaring that high attenuation then yields a 'normal SN Ib' continuum is true by construction of the fit. The ±0.033 error is only the SSR contour; the paper notes the comparison-object systematic is 'difficult to quantify,' so the precise high E(B-V) and the 'normal after correction' claim are two faces of the same template assumption—correlated with the photometric color methods, not a third independent derivation.
full rationale
This is an empirical observational paper, not a first-principles derivation, so classical definitional circularity is limited. The load-bearing move is: assume SN 2024vjc has a canonical SESN/Ib intrinsic SED (Stritzinger templates, T18 A_V=0 color curve, continuum match to SN 2012au), attribute the entire red excess to host dust, then treat the restored normal luminosity and blackbody temperature under that same E(B-V) as further support. For a near-blackbody optical SED those steps are highly correlated by construction—fitting E(B-V) to match template colors/continuum forces T_BB and M_peak toward the template locus once an extinction law is adopted. The paper still presents color templates, color evolution, spectral SSR dereddening, and SuperBol T/L as a battery of agreeing diagnostics (Table 4, §5.4, §7). That overstates independence within the SN-based cluster and is mild fitted-input / self-definitional circularity. It is not fatal: flattened-spectrum morphology vs SN 2016bau, He I velocities, the R_BB < R_He inequality direction, T_exc ≫ continuum T without dust, the Balmer decrement, and the late-time H II lines are not pure restatements of the color fit, and the headline counterexample (weak Na I D vs high attenuation) does not reduce to Na I D by construction. Score 3 reflects correlated SN-based legs presented as multiple proofs, with real external anchors still present.
Axiom & Free-Parameter Ledger
free parameters (5)
- Host E(B-V) summary value used in figures (0.59 mag) =
0.59±0.09 mag (color evolution 0–20 d)
- Host R_V in photometric conversions =
3.1
- SSR spectral dereddening grid best-fit A*_V, R*_V =
A*_V=2.6, R*_V=3.4 → E(B-V)≈0.767
- SYN++ photospheric and excitation temperatures =
T_phot≳4300 K (no host); T_exc~10000 K
- Explosion epoch from early ATLAS o-band fireball fit =
60559.5±1.5 MJD
axioms (6)
- domain assumption Intrinsic SESN color templates / low-A_V CSP-I subsample represent the true unreddened color evolution of a normal SN Ib.
- domain assumption CCM89 extinction curve (and MW-like R_V for photometry) applies to the host dust along this line of sight.
- domain assumption Case B recombination Hα/Hβ=2.86 yields host E(B-V) from the +123 d H II region lines.
- domain assumption Poznanski et al. (2012) EW(Na I D)–E(B-V) relation is the standard benchmark being tested (with Turatto et al. 2003 as alternate).
- domain assumption Blackbody SED and R_BB≈R_phot must lie below the He I line-forming radius under homologous expansion.
- ad hoc to paper Polynomial continuum and double-Gaussian modeling give a usable Na I D EW despite possible He I contamination and D2/D1≈1.
Cite this review
Pith. "Pith review of Dust Without Na I D Trace: The Case of Highly Attenuated Type Ib SN 2024vjc." pith.science (2026). https://pith.science/paper/RAJ6MKCB
@misc{pith2026260723690,
  author       = {Pith},
  title        = {Pith review of: Dust Without Na I D Trace: The Case of Highly Attenuated Type Ib SN 2024vjc},
  year         = {2026},
  howpublished = {\url{https://pith.science/paper/RAJ6MKCB}},
  note         = {Machine review of arXiv:2607.23690}
}
abstract
Understanding dust attenuation toward extragalactic transients is critical for recovering their intrinsic properties and probing the local environments of distant galaxies. A popular diagnostic is the Na I D absorption equivalent width widely applied to extragalactic transients. In this paper, we present early-time optical and near-infrared observations of the Type Ib supernova (SN) SN 2024vjc, followed for $\sim$130 days post-explosion. SN~2024vjc exhibits only weak Na~I~D absorption, indicating only a modest host attenuation with $E (B-V)_{\rm host} \sim 0.18$ mag; if this argument were applied, SN~2024vjc would be a peculiar, faint, and red SN Ib while showing the light-curve shape and spectral evolution broadly consistent with those of canonical SNe Ib. We show that this is not the case; SN-based diagnostics (intrinsic color templates, color-curve evolution, and spectral dereddening) together with the Balmer decrement indicate substantial attenuation, $E(B-V) \sim 0.45$ $-$ $0.8$\,mag. The weak Na I D absorption may result from photoionization of neutral sodium by the intense radiation field of a young H$_{2}$ region at the explosion site; this scenario is directly supported by the detection of narrow H$_{\alpha}$, [N$_{2}$], and H$_{\beta}$ emission lines and a blue continuum excess in late-time spectroscopy. SN~2024vjc represents a clear counterexample to the commonly assumption that weak or absent Na I D absorption implies negligible host-galaxy attenuation, and highlights the importance of employing multiple, independent attenuation diagnostics.
Figures




Reference graph
Works this paper leans on
-
[1]
Abbott, T. M. C., Abdalla, F. B., Allam, S., et al. 2018, ApJS, 239, 18, doi: 10.3847/1538-4365/aae9f0
-
[3]
2024, Transient Name Server Classification Report, 2024-3507, 1
Asquini, L., Landoni, M., Campana, S., et al. 2024, Transient Name Server Classification Report, 2024-3507, 1
2024
-
[4]
2021, A&A, 651, A81, doi: 10.1051/0004-6361/202038890
Barbarino, C., Sollerman, J., Taddia, F., et al. 2021, A&A, 651, A81, doi: 10.1051/0004-6361/202038890
-
[5]
1990, A&A, 237, 79
Turatto, M. 1990, A&A, 237, 79
1990
-
[6]
Baron, E., Branch, D., Hauschildt, P. H., et al. 2000, ApJ, 545, 444, doi: 10.1086/317795
doi:10.1086/317795 2000
-
[7]
Begelman, M. C., & Sarazin, C. L. 1986, ApJL, 302, L59, doi: 10.1086/184637
doi:10.1086/184637 1986
-
[8]
B., Modjaz, M., Hicken, M., et al
Bianco, F. B., Modjaz, M., Hicken, M., et al. 2014, ApJS, 213, 19, doi: 10.1088/0067-0049/213/2/19
-
[9]
Blondin, S., & Tonry, J. L. 2007, ApJ, 666, 1024, doi: 10.1086/520494
doi:10.1086/520494 2007
-
[10]
Blondin, S., & Tonry, J. L. 2011, SNID: Supernova Identification,, Astrophysics Source Code Library, record ascl:1107.001 http://ascl.net/1107.001
2011
-
[11]
1984, The Messenger, 38, 9
Buzzoni, B., Delabre, B., Dekker, H., et al. 1984, The Messenger, 38, 9
1984
-
[12]
2023, MNRAS, 524, 2978, doi: 10.1093/mnras/stad2049
Valerin, G. 2023, MNRAS, 524, 2978, doi: 10.1093/mnras/stad2049
-
[13]
2014,ecsnoopy: A package for supernova photometry,, http://sngroup.oapd.inaf.it/ecsnoopy.html
Cappellaro, E. 2014,ecsnoopy: A package for supernova photometry,, http://sngroup.oapd.inaf.it/ecsnoopy.html
2014
-
[14]
Cardelli, J. A., Clayton, G. C., & Mathis, J. S. 1989, ApJ, 345, 245, doi: 10.1086/167900
doi:10.1086/167900 1989
-
[15]
Chen, T.-W. 2019, in The Extragalactic Explosive Universe: the New Era of Transient Surveys and Data-Driven Discovery, 15, doi: 10.5281/zenodo.3478022
-
[16]
2003, The Messenger, 113, 40
Chincarini, G., Zerbi, F., Antonelli, A., et al. 2003, The Messenger, 113, 40
2003
-
[17]
Clocchiatti, A., & Wheeler, J. C. 1997, ApJ, 491, 375, doi: 10.1086/304961
doi:10.1086/304961 1997
-
[18]
M., Skrutskie, M
Cutri, R. M., Skrutskie, M. F., van Dyk, S., et al. 2003, VizieR Online Data Catalog: 2MASS All-Sky Catalog of Point Sources (Cutri+ 2003),, VizieR On-line Data Catalog: II/246. Originally published in: University of Massachusetts and Infrared Processing and Analysis Center, (IPAC/California Institute of Technology) (2003)
2003
-
[19]
2018, in Society of Photo-Optical Instrumentation Engineers (SPIE) Conference Series, Vol
Delrez, L., Gillon, M., Queloz, D., et al. 2018, in Society of Photo-Optical Instrumentation Engineers (SPIE) Conference Series, Vol. 10700, Ground-based and Airborne Telescopes VII, ed. H. K. Marshall & J. Spyromilio, 107001I, doi: 10.1117/12.2312475 Dom ´ ınguez, A., Siana, B., Henry, A. L., et al. 2013, ApJ, 763, 145, doi: 10.1088/0004-637X/763/2/145
-
[20]
Drout, M. R., Soderberg, A. M., Gal-Yam, A., et al. 2011, ApJ, 741, 97, doi: 10.1088/0004-637X/741/2/97
-
[21]
2019, Nature Astronomy, 3, 434, doi: 10.1038/s41550-019-0710-6
Gal-Yam, A. 2019, Nature Astronomy, 3, 434, doi: 10.1038/s41550-019-0710-6
-
[22]
2024, MNRAS, 529, L33, doi: 10.1093/mnrasl/slad195
Ferrari, L., Folatelli, G., Kuncarayakti, H., et al. 2024, MNRAS, 529, L33, doi: 10.1093/mnrasl/slad195
-
[23]
Filippenko, A. V., Barth, A. J., Matheson, T., et al. 1995, ApJL, 450, L11, doi: 10.1086/309659
doi:10.1086/309659 1995
-
[24]
Fitzpatrick, E. L. 1999, PASP, 111, 63, doi: 10.1086/316293
doi:10.1086/316293 1999
-
[25]
2017, in Handbook of Supernovae, ed
Gal-Yam, A. 2017, in Handbook of Supernovae, ed. A. W. Alsabti & P. Murdin, 195, doi: 10.1007/978-3-319-21846-5 35
-
[26]
2022, Nature, 601, 201, doi: 10.1038/s41586-021-04155-1 Gonz´ alez-Gait´ an, S., Guti´ errez, C
Gal-Yam, A., Bruch, R., Schulze, S., et al. 2022, Nature, 601, 201, doi: 10.1038/s41586-021-04155-1 Gonz´ alez-Gait´ an, S., Guti´ errez, C. P., Anderson, J. P., et al. 2024, A&A, 687, A108, doi: 10.1051/0004-6361/202348818 Guti´ errez, C. P., Gonz´ alez-Gait´ an, S., Anderson, J. P., &
-
[27]
2026, A&A, 707, A272, doi: 10.1051/0004-6361/202557644 Guti´ errez, C
Galbany, L. 2026, A&A, 707, A272, doi: 10.1051/0004-6361/202557644 Guti´ errez, C. P., Anderson, J. P., Hamuy, M., et al. 2017, ApJ, 850, 89, doi: 10.3847/1538-4357/aa8f52
-
[28]
2014, in Contributions of the Astronomical Observatory Skalnate Pleso, Vol
Henden, A., & Munari, U. 2014, in Contributions of the Astronomical Observatory Skalnate Pleso, Vol. 43, 518–522
2014
-
[29]
Holmbo, S., Stritzinger, M. D., Karamehmetoglu, E., et al. 2023, A&A, 675, A83, doi: 10.1051/0004-6361/202245334
-
[30]
S., Akitaya, H., Yamanaka, M., et al
Kawabata, K. S., Akitaya, H., Yamanaka, M., et al. 2014, ApJL, 795, L4, doi: 10.1088/2041-8205/795/1/L4
-
[31]
2011, The Messenger, 146, 8 28
Kuijken, K. 2011, The Messenger, 146, 8 28
2011
-
[32]
Kuncarayakti, H., Anderson, J. P., Galbany, L., et al. 2018, A&A, 613, A35, doi: 10.1051/0004-6361/201731923
-
[33]
2022, ApJL, 941, L32, doi: 10.3847/2041-8213/aca672
Kuncarayakti, H., Maeda, K., Dessart, L., et al. 2022, ApJL, 941, L32, doi: 10.3847/2041-8213/aca672
-
[34]
2023, A&A, 678, A209, doi: 10.1051/0004-6361/202346526
Kuncarayakti, H., Sollerman, J., Izzo, L., et al. 2023, A&A, 678, A209, doi: 10.1051/0004-6361/202346526
-
[35]
Photometric and Spectroscopic Studies of Type Ic Supernovae SN 2020akf and SN 2021mxx
Kurre, M., Sahu, K. R., Tiwari, S., et al. 2026, arXiv e-prints, arXiv:2607.12525, doi: 10.48550/arXiv.2607.12525
work page internal anchor Pith review Pith/arXiv arXiv doi:10.48550/arxiv.2607.12525 2026
-
[36]
2023, Research Notes of the American Astronomical Society, 7, 214, doi: 10.3847/2515-5172/ad0044
Labrie, K., Simpson, C., Cardenes, R., et al. 2023, Research Notes of the American Astronomical Society, 7, 214, doi: 10.3847/2515-5172/ad0044
-
[37]
Leonard, D. C., & Filippenko, A. V. 2001, PASP, 113, 920, doi: 10.1086/322151
doi:10.1086/322151 2001
-
[38]
Lyman, J. D., Bersier, D., James, P. A., et al. 2016, MNRAS, 457, 328, doi: 10.1093/mnras/stv2983
-
[39]
2026, PASJ, 78, L1, doi: 10.1093/pasj/psaf140
Maeda, K., Kuncarayakti, H., Nagao, T., et al. 2026, PASJ, 78, L1, doi: 10.1093/pasj/psaf140
-
[40]
Maeda, K., & Moriya, T. J. 2022, ApJ, 927, 25, doi: 10.3847/1538-4357/ac4672
-
[41]
Marino, R. A., Rosales-Ortega, F. F., S´ anchez, S. F., et al. 2013, A&A, 559, A114, doi: 10.1051/0004-6361/201321956
-
[42]
Shields, J. C. 2001, AJ, 121, 1648, doi: 10.1086/319390
doi:10.1086/319390 2001
-
[43]
A., Taubenberger, S., & Hachinger, S
Maurer, I., Mazzali, P. A., Taubenberger, S., & Hachinger, S. 2010, MNRAS, 409, 1441, doi: 10.1111/j.1365-2966.2010.17186.x
arXiv 2010
-
[44]
Milisavljevic, D., Soderberg, A. M., Margutti, R., et al. 2013, ApJL, 770, L38, doi: 10.1088/2041-8205/770/2/L38
-
[45]
2015, ApJ, 815, 120, doi: 10.1088/0004-637X/815/2/120
Milisavljevic, D., Margutti, R., Kamble, A., et al. 2015, ApJ, 815, 120, doi: 10.1088/0004-637X/815/2/120
-
[46]
Modjaz, M., Guti´ errez, C. P., & Arcavi, I. 2019, Nature Astronomy, 3, 717, doi: 10.1038/s41550-019-0856-2
-
[47]
Morton, D. C. 2003, ApJS, 149, 205, doi: 10.1086/377639
doi:10.1086/377639 2003
-
[48]
1997, A&A, 318, 269
Munari, U., & Zwitter, T. 1997, A&A, 318, 269
1997
-
[49]
2022, ApJL, 941, L4, doi: 10.3847/2041-8213/aca47d
Nagao, T., Patat, F., Maeda, K., et al. 2022, ApJL, 941, L4, doi: 10.3847/2041-8213/aca47d
-
[50]
2018, Research Notes of the American Astronomical Society, 2, 230, doi: 10.3847/2515-5172/aaf799
Nicholl, M. 2018, Research Notes of the American Astronomical Society, 2, 230, doi: 10.3847/2515-5172/aaf799
-
[51]
Onken, C. A., Wolf, C., Bessell, M. S., et al. 2024, PASA, 41, e061, doi: 10.1017/pasa.2024.53
-
[52]
2006, MNRAS, 370, 1752, doi: 10.1111/j.1365-2966.2006.10587.x
Pastorello, A., Sauer, D., Taubenberger, S., et al. 2006, MNRAS, 370, 1752, doi: 10.1111/j.1365-2966.2006.10587.x
arXiv 2006
-
[53]
Pastorello, A., Smartt, S. J., Mattila, S., et al. 2007, Nature, 447, 829, doi: 10.1038/nature05825
-
[54]
Patat, F., Taubenberger, S., Cox, N. L. J., et al. 2015, A&A, 577, A53, doi: 10.1051/0004-6361/201424507
-
[55]
Pessi, T., Prieto, J. L., Anderson, J. P., et al. 2023, A&A, 677, A28, doi: 10.1051/0004-6361/202346512
-
[56]
Phillips, M. M., Lira, P., Suntzeff, N. B., et al. 1999, AJ, 118, 1766, doi: 10.1086/301032
doi:10.1086/301032 1999
-
[57]
Phillips, M. M., Simon, J. D., Morrell, N., et al. 2013, ApJ, 779, 38, doi: 10.1088/0004-637X/779/1/38
-
[58]
Podsiadlowski, P., Joss, P. C., & Hsu, J. J. L. 1992, ApJ, 391, 246, doi: 10.1086/171341
doi:10.1086/171341 1992
-
[59]
Filippenko, A. V. 2011, MNRAS, 415, L81, doi: 10.1111/j.1745-3933.2011.01084.x
arXiv 2011
-
[60]
Poznanski, D., Prochaska, J. X., & Bloom, J. S. 2012, MNRAS, 426, 1465, doi: 10.1111/j.1365-2966.2012.21796.x
arXiv 2012
-
[61]
Prentice, S. J., Ashall, C., James, P. A., et al. 2019, MNRAS, 485, 1559, doi: 10.1093/mnras/sty3399
-
[62]
Rho, J., Evans, A., Geballe, T. R., et al. 2021, ApJ, 908, 232, doi: 10.3847/1538-4357/abd850
-
[63]
Richmond, M. W., Treffers, R. R., Filippenko, A. V., et al. 1994, AJ, 107, 1022, doi: 10.1086/116915 Rodr ´ ıguez,´O., Maoz, D., & Nakar, E. 2023, ApJ, 955, 71, doi: 10.3847/1538-4357/ace2bd
doi:10.1086/116915 1994
-
[64]
Schlafly, E. F., & Finkbeiner, D. P. 2011, ApJ, 737, 103, doi: 10.1088/0004-637X/737/2/103
-
[65]
Schlegel, D. J., Finkbeiner, D. P., & Davis, M. 1998, ApJ, 500, 525, doi: 10.1086/305772
doi:10.1086/305772 1998
-
[66]
2025, Nature, 644, 634, doi: 10.1038/s41586-025-09375-3
Schulze, S., Gal-Yam, A., Dessart, L., et al. 2025, Nature, 644, 634, doi: 10.1038/s41586-025-09375-3
-
[67]
J., Valenti, S., Fraser, M., et al
Smartt, S. J., Valenti, S., Fraser, M., et al. 2015, A&A, 579, A40, doi: 10.1051/0004-6361/201425237
-
[68]
Smith, K. W., Smartt, S. J., Young, D. R., et al. 2020, PASP, 132, 085002, doi: 10.1088/1538-3873/ab936e
-
[69]
2008, The Messenger, 132, 18
Snodgrass, C., Saviane, I., Monaco, L., & Sinclaire, P. 2008, The Messenger, 132, 18
2008
-
[70]
2000, ApJ, 537, 861, doi: 10.1086/309062
Sollerman, J., Lundqvist, P., Lindler, D., et al. 2000, ApJ, 537, 861, doi: 10.1086/309062
-
[71]
Stritzinger, M., Mazzali, P., Phillips, M. M., et al. 2009, ApJ, 696, 713, doi: 10.1088/0004-637X/696/1/713
-
[72]
Stritzinger, M. D., Taddia, F., Burns, C. R., et al. 2018, A&A, 609, A135, doi: 10.1051/0004-6361/201730843
-
[73]
2015, A&A, 574, A60, doi: 10.1051/0004-6361/201423915
Taddia, F., Sollerman, J., Leloudas, G., et al. 2015, A&A, 574, A60, doi: 10.1051/0004-6361/201423915
-
[74]
Taddia, F., Stritzinger, M. D., Bersten, M., et al. 2018, A&A, 609, A136, doi: 10.1051/0004-6361/201730844
-
[75]
Thomas, R. C., Nugent, P. E., & Meza, J. C. 2011, PASP, 123, 237, doi: 10.1086/658673
doi:10.1086/658673 2011
-
[76]
2024, Transient Name Server Discovery Report, 2024-3476, 1
Tonry, J., Denneau, L., Weiland, H., et al. 2024, Transient Name Server Discovery Report, 2024-3476, 1
2024
-
[77]
Tonry, J. L., Denneau, L., Heinze, A. N., et al. 2018, PASP, 130, 064505, doi: 10.1088/1538-3873/aabadf 29
-
[78]
2003, in From Twilight to Highlight: The Physics of Supernovae, ed
Turatto, M., Benetti, S., & Cappellaro, E. 2003, in From Twilight to Highlight: The Physics of Supernovae, ed. W. Hillebrandt & B. Leibundgut, 200, doi: 10.1007/10828549 26 van Dokkum, P. G. 2001, PASP, 113, 1420, doi: 10.1086/323894
doi:10.1007/10828549 2003
-
[79]
Y., Lallement, R., Vergely, J.-L., & Raimond, S
Welsh, B. Y., Lallement, R., Vergely, J.-L., & Raimond, S. 2010, A&A, 510, A54, doi: 10.1051/0004-6361/200913202
-
[80]
Woosley, S. E., Langer, N., & Weaver, T. A. 1995, ApJ, 448, 315, doi: 10.1086/175963
doi:10.1086/175963 1995
-
[81]
2012, PASP, 124, 668, doi: 10.1086/666656
Yaron, O., & Gal-Yam, A. 2012, PASP, 124, 668, doi: 10.1086/666656
doi:10.1086/666656 2012
This paper was first reviewed by grok-4.5 on July 30, 2026.
discussion (0)
Sign in with ORCID, Apple, or X to comment. Anyone can read and Pith papers without signing in.