Pith. sign in

REVIEW 3 major objections 5 minor 15 references

WR 25 is a bound WN6ha + O5 system whose mass ratio implies a Wolf–Rayet primary of at least 55 solar masses.

Reviewed by Pith at T0; open to challenge. T0 means a machine referee read the full paper against a public rubric. the ladder, T0–T4 →

WR 25 is a bound WN6ha+O5(f+) binary with mass ratio 2.02±0.36, implying a very massive WN primary (≥55 M☉), and its Hβ P-Cygni absorption is mainly from the O star.

T0 review reviewed 2026-07-31 challenge →

load-bearing objection Solid first SB2 and clean Hβ reclassification for WR 25; the ≥55 M☉ floor is softer than the abstract implies because K_O is poorly constrained and a third light source is unmodeled. the 3 major comments →

arxiv 2607.24390 v1 pith:TJDOW3WZ submitted 2026-07-27 astro-ph.SR

A Detailed Spectroscopic Study of the WN6ha + O5 Colliding-wind Binary WR 25

classification astro-ph.SR
keywords Wolf–Rayet starsspectroscopic binariescolliding windsmassive starsspectral disentanglingWNLh starsWR 25
verification ladder T0 review T1 audit T2 compute T3 formal T4 reserved

The pith

A machine-rendered reading of the paper's core claim, the machinery that carries it, and where it could break.

The reading

The paper sets out to pin down the orbit and components of WR 25, a bright Wolf–Rayet binary long suspected to be one of the Galaxy’s rare, still hydrogen-rich, very massive WNLh stars. New high-resolution spectra improve the WN radial-velocity orbit, prove that the faint absorption lines come from a gravitationally bound O companion, and yield the first double-lined (SB2) mass ratio of about 2. With the companion typed O5(f+) on the main sequence or as a giant, that ratio forces the WN primary above roughly 55 solar masses and likely near 75–84. The same spectra show that the strong Hβ absorption once used to call the system O2.5If*/WN6 is mostly the O star’s contribution, so the WN component is reclassified WN6ha. Approximate temperatures and wind parameters follow from atmosphere fits to the disentangled spectra, despite lingering uncertainties in extinction and light ratio.

Core claim

WR 25 is a gravitationally bound WN6ha + O5(f+) colliding-wind binary with mass ratio M_WN/M_O = 2.02 ± 0.36. That ratio, together with the O5 spectral type, requires a primary mass of at least ~55 M☉ (and ~75–84 M☉ if the O star follows standard O5V/III calibrations), confirming membership in the sparse Galactic class of very massive, hydrogen-rich WNLh objects. The prominent Hβ absorption that had motivated an Of/WN classification is shown to be dominated by the O companion.

What carries the argument

Spectral disentangling of the high-resolution time series (Fourier and shift-and-add) that isolates the individual WN and O spectra, supplies the O-star semi-amplitude K_O ≈ 107 km s⁻¹, and thereby the mass ratio from K_O/K_WN.

Load-bearing premise

Absolute masses rest on treating the O companion as a normal O5 star whose mass is taken from standard calibrations, while the O-star velocity amplitude itself remains large and asymmetric and the brightness ratio is fixed from line dilution.

What would settle it

A direct measurement of the orbital inclination (for example by long-baseline interferometry resolving the ~1 mas separation) or a secure absolute mass for the O5 star from an independent eclipsing or astrometric orbit would immediately test whether the WN primary really exceeds 55 solar masses.

Watch this falsifier. Get emailed when new claim-graph text bears on it.

If this is right

  • WR 25 joins the short list of Galactic WNLh binaries (WR 22, WR 20a, WR 21a, WR 29) that still burn hydrogen while already showing Wolf–Rayet spectra.
  • The WN component should be typed WN6ha, not O2.5If*/WN6, because the defining Hβ absorption is extrinsic.
  • Minimum dynamical masses of ~55 M☉ (likely 75–84 M☉) supply a concrete anchor for evolutionary tracks of very massive stars near solar metallicity.
  • A third, cooler late-O contributor is required to explain residual He I absorption in the WN disentangled spectrum.
  • Interferometric resolution of the ~1 mas pair could deliver the inclination and therefore true masses.

Where Pith is reading between the lines

These are editorial extensions of the paper, not claims the author makes directly.

  • If the third light source is bound, WR 25 is a hierarchical triple and the published two-body mass ratio is only an upper limit on the true WN/O mass ratio.
  • The same dilution and extinction problems that limit the CMFGEN luminosities will affect any future attempt to measure the WN mass-loss rate from X-ray or radio free–free emission.
  • A single clean O-star line such as O III λ5592, if observed at still higher S/N, could shrink the dominant uncertainty on K_O without full re-disentangling.
Share X Bluesky LinkedIn Reddit HN

Editorial analysis

A structured set of objections, weighed in public.

Desk editor's note, referee report, simulated authors' rebuttal, and a circularity audit.

Referee Report

3 major / 5 minor

Summary. The authors present new high-resolution spectroscopy of the WN6ha+O colliding-wind binary WR 25, combining four datasets (2001–2009, chiefly FEROS). They select seven N/Si lines as a 'gold sample' of orbital tracers, refine the period to P = 207.638 d, and derive an improved SB1 solution (K_WN = 53.18 ± 0.82 km/s, e = 0.595), validated by the phasing of the soft X-ray eclipse. Via direct line measurements and Fourier/shift-and-add spectral disentangling they obtain a first SB2 solution, K_O = 107.36 ± 19.24 km/s, hence q = M_WN/M_O = 2.02 ± 0.36. Disentangled spectra classify the companion as O5(f+) (V or III), imply M_WN ≳ 55 M☉ under a canonical O5 mass floor, show the strong Hβ absorption (basis of the O2.5If*/WN6 class) is mainly from the O star, and suggest a stationary third light contributor. CMFGEN analyses give approximate stellar parameters, limited by uncertain brightness ratio and extinction.

Significance. If the SB2 result holds, WR 25 joins the very sparsely populated class of Galactic very massive WNLh binaries with a measured mass ratio, providing a rare dynamical anchor for evolutionary models of the most massive stars. The manuscript has several explicit strengths worth crediting: a seven-line 'gold sample' with internal-consistency checks; a disentangling result for K_WN (53.82 ± 0.99 km/s) that independently confirms the SB1 fit (53.18 ± 0.82); cross-validation between Fourier and shift-and-add disentangling; an external ephemeris check via the soft X-ray eclipse; and a clean, falsifiable resolution of the long-standing O2.5If*/WN6 classification puzzle by showing the strong Hβ absorption is the O companion's. The proposed ~1.1–1.5 mas separation gives a concrete interferometric follow-up path to true masses.

major comments (3)
  1. [Sect. 7.1 / Sect. 8.2] Sect. 7.1 and Sect. 8.2 (Eq. 1): the headline mass floor is not robust at the quoted confidence level. The χ² minimum in K_O is strongly asymmetric (σ+ = 11.5, σ− = 27.4 km/s). At the −1σ edge (K_O ≈ 80 km/s), q ≈ 1.49 and the floor from M_O ≥ 27 M☉ falls to ~40 M☉, well below the 'at least 55 M☉' stated in the abstract and Sect. 10. The mass ratio and its asymmetric uncertainty should be propagated explicitly to q and to the mass floor, and the abstract should state that 55 M☉ is the face-value (not 1σ) lower limit.
  2. [Sect. 6.5 vs. Sect. 7.1] Sect. 6.5 vs. Sect. 7.1: the K_O estimates from independent line diagnostics disagree beyond the quoted errors. The N IV λ5200 triplet shift gives K_O ≈ 125–130 km/s, the alternative He I λ4471 component assignment gives 118 km/s, and the subtraction experiment gives 102.6 ± 3.8 km/s, while the disentangling yields 107.36 (+11.5/−27.4) km/s. The N IV value exceeds even the +1σ bound of the adopted result. This suggests line-dependent systematics (blending, wind formation in N IV) not captured by the formal error. The authors should either reconcile the discrepancy or carry an enlarged systematic uncertainty on K_O.
  3. [Sects. 6.4 / 7 / 9.2.2] Sects. 6.4, 7 and 9.2.2: the paper argues for a stationary third (intruder) contributor whose He I λ4471 EW (0.054 Å) exceeds that of the O5 star itself (0.023 Å), yet the disentangling that produces K_O is strictly two-component and does not model this stationary light. A stationary third component can bias the extracted amplitudes and the reconstructed O-star spectrum. At minimum, the authors should estimate the direction and plausible magnitude of the bias on K_O (e.g., a test disentangling excluding the He I λ4471 region, or an explicit three-component sensitivity estimate), rather than leaving the effect unquantified while the mass ratio rests on this same procedure.
minor comments (5)
  1. [Sects. 7.2–7.3] Sects. 7.2–7.3: the brightness ratio 0.26/0.74 is derived from the He II λ4542 EW calibration of Mathys (1988), yet the authors themselves note that several reference stars (e.g., HD 168112) are now known binaries, which biases the reference EW. Since this ratio feeds the CMFGEN 'modified disentangled spectra' and all luminosity estimates (log L ranging from 5.87 to 6.43 depending on A_V and band), its provenance and fragility deserve a clearer caveat.
  2. [Sect. 7.1] Sect. 7.1: the implied γ_O ≈ 17.4 km/s versus the ≈ −11 km/s expected from Galactic rotation is dismissed as having 'huge' uncertainty, but a numerical uncertainty estimate would be more convincing than the qualitative statement.
  3. [Table 2] Table 2: the dual uncertainties on T0 in the third column (5.06/0.59) are explained only in Sect. 5.1 text; add a note to the table. Also state explicitly that the gold-sample γ = 0 is a construction artifact to avoid confusion for casual readers.
  4. [General] Typos/formatting: affiliation 2 reads 'Astrophycics'; the NIST URL in Sect. 3.1.7 is 'list.gov' (should be nist.gov); Fig. 43 axis labels would benefit from larger fonts; a stray comma ends a sentence in Sect. 10 ('...high-S/N spectra,').
  5. [Sect. 6.2 / Fig. 35] Sect. 6.2: the Hβ index (Fig. 35) is defined only verbally; giving the wavelength window and whether nebular Hβ subtraction residuals were masked would aid reproducibility of this diagnostic, which is central to the reclassification argument.

Circularity Check

0 steps flagged

No significant circularity: SB2 mass ratio and WN mass floor are empirical RV/disentangling results plus an external O-star mass calibration, not quantities forced by their own definitions or self-citation chains.

full rationale

The load-bearing chain is: multi-line WN RVs → SB1 (K_WN, e, P, f(M)); Fourier/shift-and-add disentangling of four features → K_O; q ≡ K_O/K_WN; then M_O sin³i = f(M)(1+q)² and an external Martins et al. (2005) O5V/III mass (or a 27 M☉ floor from other systems) → M_WN. None of these steps is self-definitional: q is the standard Keplerian ratio of measured semi-amplitudes, not a fit renamed as a prediction. Disentangling optimizes K_WN and K_O against the spectra with P, e, ω, T0 fixed from the SB1; that is a measurement technique, not a circular construction. Self-citations (Gamen et al. 2006, 2008) supply the discovery baseline and some archival RVs that are remeasured or extended; the new SB2 numbers and the Hβ-as-O-companion argument come from the present data and disentangled spectra. Importing an external O-star mass scale and fixing a brightness ratio from EW dilution are standard domain assumptions and uncertainty sources, not circularity. Skeptic concerns about asymmetric K_O errors, line-to-line K_O scatter, and unmodeled third light affect correctness and error bars, not whether the derivation reduces to its inputs by construction. Honest finding: derivation is self-contained empirical spectroscopy.

Axiom & Free-Parameter Ledger

6 free parameters · 6 axioms · 1 invented entities

The paper is observational. Load-bearing inputs are Keplerian two-body motion, standard rest wavelengths and line-formation assumptions for WN RVs, Fourier disentangling with fixed P,e,ω,T0, an adopted continuum brightness ratio, external O-star mass–spectral-type calibrations, and a poorly constrained extinction law. A possible third star is introduced to explain residual He I.

free parameters (6)
  • K_O (O-star RV semi-amplitude) = 107.36 ± 19.24 km/s (asymmetric)
    Fitted via spectral disentangling grid; dominates mass-ratio uncertainty.
  • K_WN = 53.18 ± 0.82 km/s (SB1); 53.82 ± 0.99 km/s (disentangling)
    Fitted from gold-sample RVs and refined by disentangling.
  • Orbital period P, eccentricity e, ω, T0 = P=207.638±0.093 d; e=0.595±0.013
    Refitted from extended N IV λ4058 and gold-sample time series.
  • Continuum brightness ratio O/WN = 0.26/0.74 (adopted)
    Not measured by eclipses; set from He II λ4542 and Hγ EW dilution then applied to modified disentangled spectra.
  • A_V extinction toward WR 25 = range ~1.9–3.4 mag; preferred scenario A_V=3.4
    Blue/UV vs red/NIR inconsistency; absolute magnitudes and luminosities span a wide range.
  • CMFGEN wind/photosphere parameters (Mdot, v∞, β, f_cl, log L) = T*~45000 K, log Mdot~-5.1, v∞~2500 km/s (WN); Teff~41400 K, log g~3.85 (O)
    Preliminary by-eye/grid fits with several quantities fixed (e.g. f_cl=0.1, β=1, log L~6.0 for WN).
axioms (6)
  • domain assumption Keplerian two-body SB1/SB2 motion adequately describes the measured RVs of selected WN and O lines.
    Standard binary analysis; wind-line distortions are mitigated by line selection but not eliminated.
  • domain assumption Selected high-ionization emission lines (N IV, N V, Si IV) trace the WN orbital motion up to a constant zero-point offset.
    Sect. 3; absolute γ is abandoned; relative motion is used.
  • domain assumption Fourier spectral disentangling with fixed P,e,ω,T0 recovers individual spectra and K amplitudes despite incomplete deblending when the O star is blueshifted.
    Sect. 7; authors note artificial blue-wing asymmetries.
  • domain assumption O5V/III masses from Martins et al. (2005), with a floor M_O ≥ 27 M☉ from other systems, convert q and the mass function into M_WN and inclination.
    Sect. 8.2; dominant step from q to absolute mass.
  • domain assumption CMFGEN non-LTE wind models with adopted clumping, β-law, and solar metals (except fitted N ionization) represent the modified disentangled spectra.
    Sect. 9; fits called approximate/preliminary.
  • ad hoc to paper Gaussian multi-component fitting and local/global continuum normalization do not bias relative RVs beyond the quoted scatter.
    Extensive Sect. 2–3 methodology specific to this reduction.
invented entities (1)
  • Possible third (intruder) OB component cooler than the O5 star no independent evidence
    purpose: Explain He I λ4471 (and related) absorption that does not follow the WN orbit and is incompatible with the WN CMFGEN temperature.
    Inferred from residual He I and EW ratios (Sects. 6.4, 9.2.2); not directly resolved; may be bound or a line-of-sight object.

reviewed 2026-07-31 · how reviews work

0 comments
Cite this review

Pith. "Pith review of A Detailed Spectroscopic Study of the WN6ha + O5 Colliding-wind Binary WR 25." pith.science (2026). https://pith.science/paper/TJDOW3WZ

@misc{pith2026260724390,
  author       = {Pith},
  title        = {Pith review of: A Detailed Spectroscopic Study of the WN6ha + O5 Colliding-wind Binary WR 25},
  year         = {2026},
  howpublished = {\url{https://pith.science/paper/TJDOW3WZ}},
  note         = {Machine review of arXiv:2607.24390}
}
Share X Bluesky LinkedIn Reddit HN
read the original abstract

Massive stars have a major impact on their environment in their host galaxy. Observational determinations of their physical parameters are required to better constrain evolutionary models. In this context, the binary system WR 25 whose dominant spectral type is that of a nitrogen sequence Wolf-Rayet star, is of particular interest. It exhibits the highest known hydrogen content among the Milky Way Wolf-Rayet stars, as well as additional absorption lines. It is most probably an object still on the main-sequence or close to leaving it. We acquired new high-resolution spectra of this extremely interesting object. We present an improved version of the SB1 orbital solution for the motion of the WN component. We confirm the detection of the previously reported probable O companion and definitively prove that it is indeed gravitationally bound to the WN star. A first SB2 solution is presented, and a mass-ratio WN/O of 2.02 +/- 0.36 is derived. Following a spectral disentangling procedure, we identify the companion as an O5(f^+) star belonging to either the main-sequence (V) or giant (III) luminosity classes. The spectral type of the companion, together with the above-mentioned mass ratio, points to a very massive primary WN star of at least 55 solar masses. This confirms that WR 25 belongs to the family of very massive WNLh objects, a very poorly populated class in the Milky Way. We demonstrate that the absorption component in the P-Cygni profile of the He II lambda 4859 line of WR 25 is mainly due to the O-type companion, and we propose to adopt a WN6ha spectral type for the WN component of the system. On the basis of the extracted disentangled spectra, we derive approximate physical parameters through a detailed CMFGEN analysis, given the difficulty in constraining both the extinction towards WR 25 and the definitive brightness ratio between the components.

Figures

Figures reproduced from arXiv: 2607.24390 by Eric Gosset, Hugues Sana, Laurent Mahy, Nidia Morrell, Roberto Gamen, Rodolfo Barb\'a.

Figure 1
Figure 1. Figure 1: Illustration of the spectrum of WR 25 and of the dissimilarities between the normalisations to the continuum in the local (black) and in the global (red) reduction mode. (Left) Region of the N iv 𝜆4058 and the He ii 𝜆4100+H𝛿 lines. (Right) Region between the N v 𝜆4619 transition and the He ii 𝜆4686 line. included in Iglo. Indeed, only 21 of the 27 spectra from Iloc had a suitable reference O-type star avai… view at source ↗
Figure 2
Figure 2. Figure 2: The 21 spectra of the Iglo data set overplotted to illustrate the stability of the global reduction procedure in this spectral region. 2.4. Data set IV The fourth data set consists of spectra acquired in 2006 and 2007 with the 2.5-m Irénée du Pont Telescope at Las Campanas Observatory, Chile. One of these spectra was used to illustrate the detection of the companion reported in Gamen et al. (2008). The tel… view at source ↗
Figure 3
Figure 3. Figure 3: Single-Gaussian fit to the N iv 𝜆4058 line in WR 25 illus￾trated for a spectrum acquired at HJD 2,453,868.628. The black curve represents the observed spectrum, whereas the red curve corresponds to the fitted profile. (Left) Spectrum reduced using the local normalisation procedure. (Right) Same spectrum reduced using the global normalisa￾tion procedure. be hampered by the presence of the companion (e.g., B… view at source ↗
Figure 4
Figure 4. Figure 4: Two-Gaussian fits to the N iv 𝜆4058 line in WR 25 illustrated for a spectrum acquired at HJD 2,453,901.587. The black curve rep￾resents the observed spectrum, whereas the red curve corresponds to the fitted profile. (Left) Spectrum reduced using the local normalisation procedure. (Right) Same spectrum reduced using the global normalisa￾tion procedure. This latter fit required the introduction of an additio… view at source ↗
Figure 5
Figure 5. Figure 5: Comparison between the RVs derived from the globally nor￾malised spectra and those measured from the locally normalised spectra. (Upper left) Results obtained from single-Gaussian fits. (Upper right) Results obtained from two-Gaussian fits, adopting Gaussian 1 for the RV measurements. The red line indicates the perfect one-to-one rela￾tion. The agreement is particularly good, especially when allowing for a… view at source ↗
Figure 6
Figure 6. Figure 6: (Left) Comparison between the RVs derived from the single￾Gaussian fits (1G) and those associated with Gaussian 1 from the two￾Gaussian fits (2G); both measurements correspond to the locally nor￾malised spectra. The red line indicates the one-to-one relation, whereas the green line is an arbitrary line drawn parallel to it. This illustrates that the two RV sets differ by a mere constant. (Right) RV differe… view at source ↗
Figure 7
Figure 7. Figure 7: Comparison between the RVs associated with Gaussian 1 and those associated with Gaussian 2, the latter representing the broader component of the profile. Despite the observed dispersion, both compo￾nents vary essentially together and differ primarily by a constant offset, confirming that the combination of two Gaussians provides an adequate representation of the line profile. 3.1.2. The N v 𝜆𝜆4604-4619 dou… view at source ↗
Figure 8
Figure 8. Figure 8: Determination of an RV associated with the N v 𝜆𝜆4604-4619 doublet for a spectrum acquired at HJD 2,454,912.516. Three Gaussian components were used to fit the spectral region: one for the absorption of the N v 𝜆4604 transition (Gaussian 1), one for the corresponding emission component (Gaussian 2), and one accounting for the absorption of the N v 𝜆4619 transition (Gaussian 3). The surrounding spectral reg… view at source ↗
Figure 9
Figure 9. Figure 9: (Left) Comparison between the RVs associated with Gaus￾sian 2 in [PITH_FULL_IMAGE:figures/full_fig_p016_9.png] view at source ↗
Figure 10
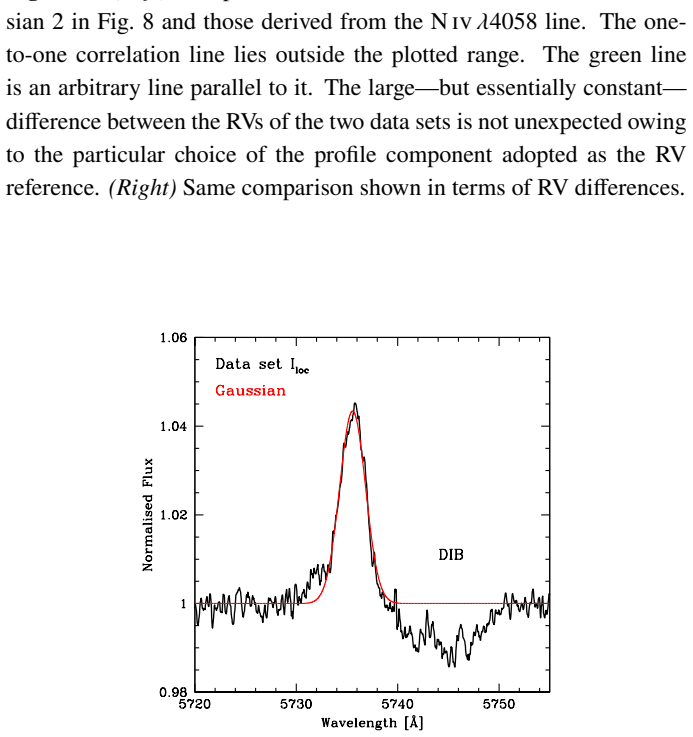
Figure 10. Figure 10: Example of the RV determination based on the fit of the N iv 𝜆5737 line. The spectrum shown here was acquired at HJD 2,453,864.483. 16 [PITH_FULL_IMAGE:figures/full_fig_p016_10.png] view at source ↗
Figure 11
Figure 11. Figure 11: Comparison between the RVs derived from the N iv 𝜆5737 and N iv 𝜆4058 lines. The red line represents the one-to-one correlation, whereas the green line is drawn parallel to it. line shape. A comparison between the RVs derived from this transition and those obtained from N iv 𝜆4058 is presented in [PITH_FULL_IMAGE:figures/full_fig_p017_11.png] view at source ↗
Figure 12
Figure 12. Figure 12: Same as [PITH_FULL_IMAGE:figures/full_fig_p018_12.png] view at source ↗
Figure 13
Figure 13. Figure 13: Same as [PITH_FULL_IMAGE:figures/full_fig_p018_13.png] view at source ↗
Figure 14
Figure 14. Figure 14: Illustration of the RV determination based on the N iv 𝜆𝜆6212-6215-6220 triplet. The three Gaussian components fit￾ted to the emission lines are shown in red and the two Gaussians that account for the neighbouring DIB feature are shown in blue. This spec￾trum was acquired at HJD 2,454,918.588. Gaussian 1 was adopted as the RV reference. the DIB could be adequately represented by two additional Gaussian co… view at source ↗
Figure 15
Figure 15. Figure 15: Same as [PITH_FULL_IMAGE:figures/full_fig_p020_15.png] view at source ↗
Figure 16
Figure 16. Figure 16: Illustration of the RV determination based on the N iv tran￾sitions in the 7100–7120 Å spectral region. Fitting this purely emission￾line blend requires five Gaussian components: four narrow Gaussians (shown in red) together with one broader (in blue). This spectrum was acquired at HJD 2,453,837.576. The Gaussian 2 was adopted as the RV reference. 20 [PITH_FULL_IMAGE:figures/full_fig_p020_16.png] view at source ↗
Figure 17
Figure 17. Figure 17: Same as [PITH_FULL_IMAGE:figures/full_fig_p021_17.png] view at source ↗
Figure 18
Figure 18. Figure 18: Same as [PITH_FULL_IMAGE:figures/full_fig_p022_18.png] view at source ↗
Figure 19
Figure 19. Figure 19: Comparison between the RVs determined from the N iii 𝜆4905 feature and those obtained from the N iv 𝜆4058 line. The two sets of RVs are clearly inconsistent. 22 [PITH_FULL_IMAGE:figures/full_fig_p022_19.png] view at source ↗
Figure 20
Figure 20. Figure 20: RV measurements based on the well-known N iii 𝜆𝜆4634- 4641 triplet. The spectrum was acquired at HJD 2,453,918.499. Repro￾ducing the full profile of the spectral region requires three Gaussians: two narrow and one broad. The measurement shown here yields es￾sentially the same results when using the globally normalised data set instead of the locally normalised one. behaviour may be linked to the continuum… view at source ↗
Figure 21
Figure 21. Figure 21: Comparison between the RVs derived from Gaussian 2 in [PITH_FULL_IMAGE:figures/full_fig_p024_21.png] view at source ↗
Figure 22
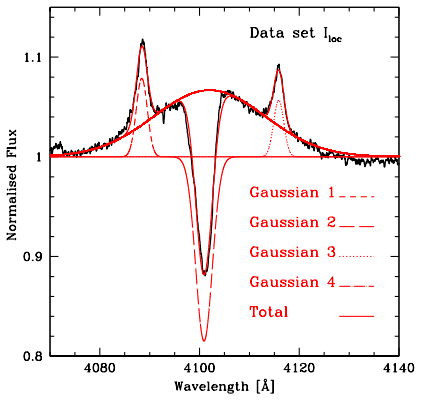
Figure 22. Figure 22: Illustration of the RV measurement of the Si iv 𝜆4089 line and of the surrounding blend consisting of the Si iv 𝜆4116 line and the He ii 𝜆4100+H𝛿 feature. Four Gaussians are required to reach a good total fit: Gaussians 1 and 3 (relatively narrow) reproduce the two silicon emission lines, Gaussian 2 represents a slightly broader absorption for the He ii 𝜆4100+H𝛿 transitions and Gaussian 4 accounts for its… view at source ↗
Figure 23
Figure 23. Figure 23: Comparison between the RVs derived from Gaussian 1 in [PITH_FULL_IMAGE:figures/full_fig_p025_23.png] view at source ↗
Figure 24
Figure 24. Figure 24: Comparison between the RVs derived from Gaussian 3 (Si iv 𝜆4116) in [PITH_FULL_IMAGE:figures/full_fig_p026_24.png] view at source ↗
Figure 25
Figure 25. Figure 25: Example of the fit applied to the unidentified line on the blue side of H𝛽 (near 4841 Å). A single Gaussian is sufficient to reproduce the line profile but a pedestal is necessary to account for the influence of the neighbouring He ii 𝜆4859+H𝛽 feature. The spectrum shown here was obtained at HJD 2,454,918.588. tentatively identify it with the N iii 𝜆4321 transition and label it accordingly. This identific… view at source ↗
Figure 26
Figure 26. Figure 26: Spectral region around the C iv 𝜆𝜆5801-5812 doublet for two spectra acquired at HJD 2,453,800.671 (red) and HJD 2,454,916.541 (black). At the epoch corresponding to the black spectrum, the WN star was shifted towards the blue, whereas at the epoch of the red spectrum, it was shifted to the red. The carbon lines thus follow the motion of the WN star. However, the large number of DIBs present in this spectr… view at source ↗
Figure 27
Figure 27. Figure 27: RV curve of WR 25. The blue points represent the 90 individual RVs associated with the position of Gaussian 1 fitted to the N iv 𝜆4058 line. The phase was computed on the basis of the orbital elements given in the third column of [PITH_FULL_IMAGE:figures/full_fig_p032_27.png] view at source ↗
Figure 28
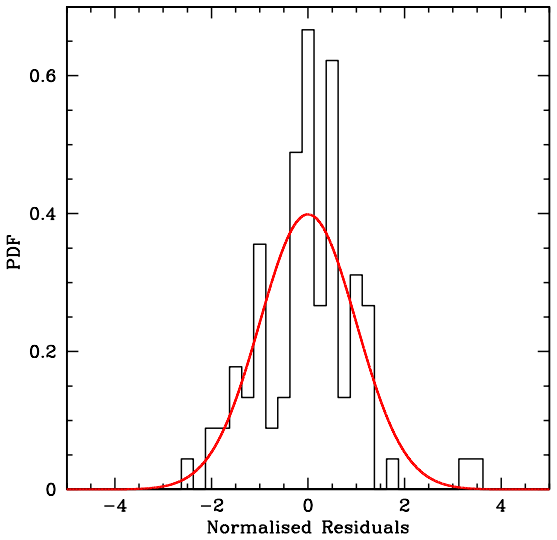
Figure 28. Figure 28: Histogram of the residuals of the fit shown in [PITH_FULL_IMAGE:figures/full_fig_p033_28.png] view at source ↗
Figure 29
Figure 29. Figure 29: Final RV curve of WR 25. The blue points represent the 43 individual RVs obtained from the combination of the seven lines that best trace the orbital motion (“gold sample”). The phase is computed using the final elements given in the fourth column of [PITH_FULL_IMAGE:figures/full_fig_p033_29.png] view at source ↗
Figure 30
Figure 30. Figure 30: Run of the soft X-ray flux of WR 25 as a function of phase (see [PITH_FULL_IMAGE:figures/full_fig_p035_30.png] view at source ↗
Figure 31
Figure 31. Figure 31: Comparison of the shape and position of selected spectroscopic lines at two orbital phases: 0.14 (red) and 0.98 (black). These phases correspond to the maximum RV separation (phase 0.98, WN star shifted towards the blue) and to the approximate opposite extreme separa￾tion (phase 0.14,WN star shifted towards the red). The panels show the He ii 𝜆5412, He ii 𝜆4542, He ii 𝜆4200, H𝛾, H𝛿, and He i-ii 𝜆4026 line… view at source ↗
Figure 32
Figure 32. Figure 32: Phase diagram showing the RVs associated to the main ab￾sorption component of the H𝛾 profile. The blue points represent the RVs for the phases where only one absorption component is visible, whereas the few magenta points correspond to phases where two absorption components are visible and can be separated (the RVs associated solely with the O star are not shown here). The continuous line represents the a… view at source ↗
Figure 33
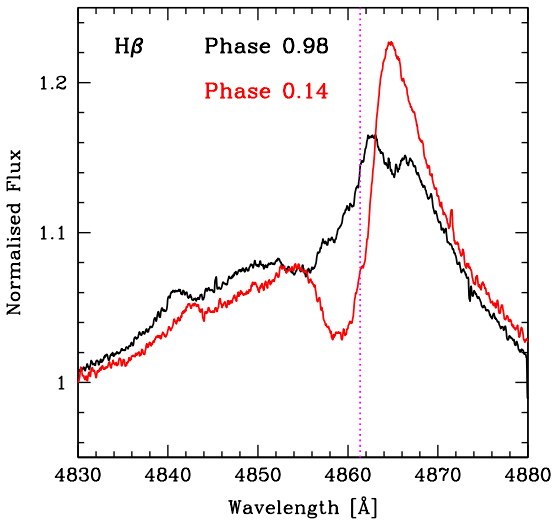
Figure 33. Figure 33: Illustration of the He ii 𝜆4859+H𝛽 profile in WR 25 at the two usual extreme phases, 0.98 (black) and 0.14 (red). The dotted ma￾genta line indicates the position of the laboratory wavelength of this spec￾tral feature. The small emission line to the blue side of He ii 𝜆4859+H𝛽 is attributed (see Sect. 3.1.13) to the transition N iii 𝜆4842. WR 25 contains absorption lines associated with both stars. The sam… view at source ↗
Figure 34
Figure 34. Figure 34: Selected WR 25 spectra (black) at phases close to 0.98. For illustrative purposes, the spectra have been vertically shifted relative to the continuum level at 1 by an amount equal to twice the difference between phase zero and the phase of the corresponding spectrum. From top to bottom, the phases are 0.018, 0.009, 0.000, 0.986, 0.976, 0.966, 0.956, 0.952 (dotted), 0.947, 0.929, and 0.912. The magenta ver… view at source ↗
Figure 35
Figure 35. Figure 35: Run of the H𝛽 index as a function of orbital phase. The black points correspond to the spectra from the Iloc data set, while magenta points represent data set III. The blue dotted vertical line indicates the phase of minimum radial velocity of the WN star. The horizontal red line marks the maximum flux level possible in the region around 4860 Å. type, defined by the presence of a strong absorption compone… view at source ↗
Figure 36
Figure 36. Figure 36: Spectrum of WR 25 in the region of the N iii 𝜆𝜆4634-4641 triplet at phase 0.98 (black) with the spectrum at phase 0.17 (green) superimposed after being shifted so that the two apparent emission lines of the triplet coincide. The positions of the two transitions are marked by red vertical lines. The two magenta dots indicate the position of the O-star contribution at phase 0.98. 43 [PITH_FULL_IMAGE:figure… view at source ↗
Figure 21
Figure 21. Figure 21: These results are particularly interesting because they raise the possibility that information on the orbit of the O component could be extracted through spectral-disentangling techniques (see Sect. 7). 6.4. The He i 𝝀4471 line In order to improve our knowledge of the orbital motion of the O component, we searched for additional spectral lines that could provide further constraints. In particular, we look… view at source ↗
Figure 37
Figure 37. Figure 37: Spectrum of WR 25 in the region of the He i 𝜆4471 line at phase 0.98 (upper panel) and phase 0.14 (lower panel). The blue curves show the single-Gaussian fit, while the magenta lines correspond to the two-Gaussian fit. The red vertical lines mark the position of the component attributed to the WN component, highlighting its limited radial-velocity variation. et al., 2016; Gaia Collaboration: Brown et al.,… view at source ↗
Figure 38
Figure 38. Figure 38: Radial velocities derived from the He i 𝜆4471 line as a func￾tion of orbital phase. The different symbols and colours correspond to the O component (black circles), the WN-star component (blue squares), and the blends (red circles). The cyan circle and cyan square indicate the RVs measured for the O- and WN-star components, respectively, depicted in the lower panel of [PITH_FULL_IMAGE:figures/full_fig_p0… view at source ↗
Figure 39
Figure 39. Figure 39: Preliminary RV curve of the O component as a function of orbital phase. The blue points represent the individual RV measure￾ments obtained after removing the He i 𝜆4471 component assumed to be constant in RV and not associated with the O star. An orbital fit was performed (see Sect. 6.4), with parameters 𝐾O and 𝛾O treated as free parameters while all other orbital elements were fixed to the values of the … view at source ↗
Figure 40
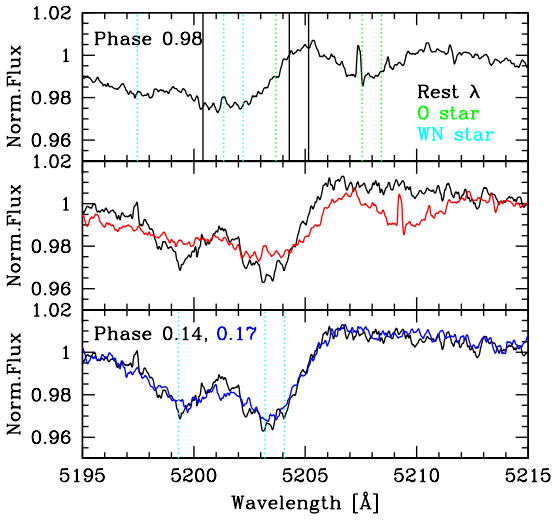
Figure 40. Figure 40: Spectrum of WR 25 in the region of the N iv triplet. The upper panel shows the spectrum at phase 0.98, while the lower panel presents spectra obtained at phases 0.14 (black) and 0.17 (blue). In the upper panel, the identified absorption features are labelled, and the rest wavelengths of the triplet are indicated by the solid vertical black lines. The green dotted lines mark the expected positions of the O… view at source ↗
Figure 41
Figure 41. Figure 41: Radial velocities associated with the O-star component as a function of orbital phase. Black dots correspond to measurements from the He i 𝜆4471 line, red dots to those from the He ii 𝜆4542 line, and green dots to the N iv 𝜆5204.55 blend. The data points highlight the RV motion of the O star in the vicinity of the phase interval corresponding to the maximum velocity separation between the two components. … view at source ↗
Figure 42
Figure 42. Figure 42: Fitted values of the semi-amplitude 𝐾O as a function of the assumed systemic velocity 𝛾O. The formal uncertainty on the fitted parameter is comparable to the thickness of the black curve. The fit is based on the RV measurements shown in [PITH_FULL_IMAGE:figures/full_fig_p051_42.png] view at source ↗
Figure 43
Figure 43. Figure 43: Two-dimensional reduced 𝜒 2 map obtained from the Fourier disentangling as a function of the parameters 𝐾WN and 𝐾O. The global minimum is marked by a black dot, and contour levels corresponding to 1𝜎, 2𝜎, and 3𝜎 are shown. The bottom panelshows the one-dimensional variation of 𝜒 2 around the minimum as a function of 𝐾O while the right￾hand panel shows the corresponding one-dimensional variation as a funct… view at source ↗
Figure 44
Figure 44. Figure 44: Combination (red) of the two disentangled spectra (green for the WN star and blue for the O star) shifted according to their respective radial velocities and summed, compared with the observed spectrum (black) obtained at HJD 2,454,084.750. 54 [PITH_FULL_IMAGE:figures/full_fig_p054_44.png] view at source ↗
Figure 45
Figure 45. Figure 45: Disentangled spectrum of the O component in several spec￾tral regions. These regions correspond to the He ii 𝜆4100+H𝛿 line and the Si iv 𝜆𝜆4089-4116 doublet (upper left; the first line is not visible), the He ii 𝜆4200 line (upper right), the He i 𝜆4471 line (lower left), and the triplet N iii 𝜆𝜆4634-4641 together with the He ii 𝜆4686 line (lower right). 55 [PITH_FULL_IMAGE:figures/full_fig_p055_45.png] view at source ↗
Figure 46
Figure 46. Figure 46: Disentangled spectrum of the WN component in the region of the He ii 𝜆4859+H𝛽 line. The absence of any strong absorption com￾ponent in the P-Cygni profile is conspicuous. It is interesting to note that the small emission lines N iii 𝜆4842 and N iii 𝜆𝜆4882-4884 are correctly attributed to the WN component by the disentangling procedure. object. Another caveat is that WR 24 is not necessarily the best compa… view at source ↗
Figure 48
Figure 48. Figure 48: Alternatively, we may estimate the consequences of adopting a higher luminosity of [PITH_FULL_IMAGE:figures/full_fig_p064_48.png] view at source ↗
Figure 47
Figure 47. Figure 47: Comparison between the modified disentangled spectrum of the O5 star (black) and the best-fit CMFGEN model (red) in several spectral regions. The C, N, and O surface abundances were kept fixed at their solar values. The light red region indicates the range spanned by the synthetic spectra corresponding to models lying within the 1𝜎 confidence interval of the best-fit solution. 65 [PITH_FULL_IMAGE:figures… view at source ↗
Figure 48
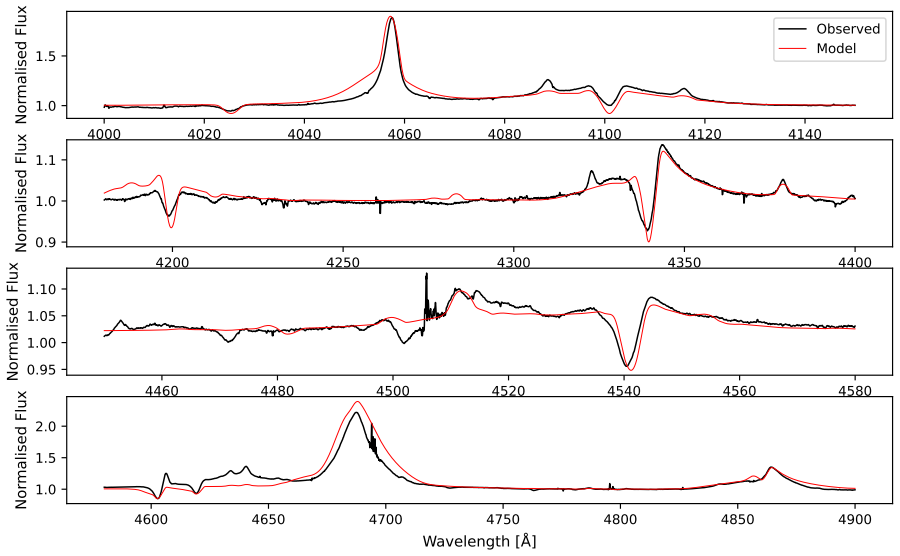
Figure 48. Figure 48: Comparison between the modified disentangled spectrum of the WN star (black) and the best-fit CMFGEN model (red) in selected spectral regions. of the temperature is required. The luminosity and mass-loss rate therefore have a correlated impact, at least in the relevant region of parameter space. This further underlines the need for accurate brightness ratios. The disentangled spectrum of the WN6ha star sh… view at source ↗
Figure 49
Figure 49. Figure 49: Constraint on the effective temperature of the third object based on the He i 𝜆4471 equivalent-width ratio. The orange region shows CMFGEN models whose predicted EW ratios between the O5 component and the intruder reproduce the observed ratio of 0.41 within uncertainties. dilution is not known, and depends on the nature of the third object. We tentatively estimated it by simulating the fluxes in the 𝑉 ban… view at source ↗

discussion (0)

Sign in with ORCID, Apple, or X to comment. Anyone can read and Pith papers without signing in.

Reference graph

Works this paper leans on

15 extracted references · 1 canonical work pages

  1. [1]

    P., Abbott, R., Abbott, T

    Abbott, B. P., Abbott, R., Abbott, T. D., Abernathy, M. R., Acernese, F., Ackley, K., Adams, C., Adams, T., Addesso, P., Adhikari, R. X., Adya, V. B., and1001 more(LIGO Scientific Collaboration and Virgo Collaboration) (2016) Observation of gravitational waves from a binaryblackholemerger.PhRvL,116(6), 061102. https://doi.org/10.1103/PhysRevLett.116. 0611...

  2. [2]

    gold sample

    TableA.1:Journaloftheobservations(datasetI)includingexposuretime. Date UT HJD(2400000+) Exp. Phase Global yyyy-mm-dd hh:mm:ss (mid-exposure) [s] (Y/N) 2006-03-02 02:33:41 53796.6176 1500 0.582 Y 2006-03-04 02:30:54 53798.6158 1500 0.592 Y 2006-03-06 03:49:50 53800.6706 1500 0.602 Y 2006-04-08 00:23:53 53833.5275 1380 0.760 Y 2006-04-10 02:23:22 53835.6105...

  3. [3]

    https://doi.org/10.1051/0004-6361/202039657

    Summary of the contents and survey properties.A&A,649, A1. https://doi.org/10.1051/0004-6361/202039657. Gaia Collaboration: Prusti, T., de Bruijne, J. H. J., Brown, A. G. A., Vallenari, A., Babusiaux, C., Bailer-Jones, C. A. L., Bastian, U., Biermann, M., Evans, D. W., Eyer, L., and615 more (2016) TheGaiamission.A&A,595, A1. https://doi.org/10.1051/0004-6...

  4. [4]

    https://doi.org/10.1051/0004-6361/202243940

    Summary of the content and survey properties.A&A,674, A1. https://doi.org/10.1051/0004-6361/202243940. Gamen, R., Gosset, E., Morrell, N., Niemela, V., Sana, H., Nazé, Y., Rauw, G., Barbá, R., and Solivella,G.(2006)Thefirstorbitalsolutionforthemassivecolliding-windbinaryHD93162 (≡WR 25).A&A,460(3), 777–782. https://doi.org/10.1051/0004-6361:20065618. 73 G...

  5. [6]

    Martins, F

    https://doi.org/10.3847/0067-0049/224/1/4. Martins, F. (2018) Quantitative spectral classification of Galactic O stars.A&A,616, A135. https://doi.org/10.1051/0004-6361/201833050. Martins,F.andPlez,B.(2006)UBVJHKsyntheticphotometryofGalacticOstars.A&A,457(2), 637–644. https://doi.org/10.1051/0004-6361:20065753. Martins, F., Schaerer, D., and Hillier, D. J....

  6. [10]

    Sota, A., Maíz Apellániz, J., Walborn, N

    https://doi.org/10.1088/0067-0049/211/1/10. Sota, A., Maíz Apellániz, J., Walborn, N. R., Alfaro, E. J., Barbá, R. H., Morrell, N. I., Gamen, R. C., and Arias, J. I. (2011) The Galactic O-Star spectroscopic survey. I. Classification system and bright northern stars in the blue-violet at𝑅∼2500.ApJS,193(2),

  7. [15]

    78 Sana, H., Shenar, T., Bodensteiner, J., Britavskiy, N., Langer, N., Lennon, D

    https://doi.org/10.1088/0067-0049/215/1/15. 78 Sana, H., Shenar, T., Bodensteiner, J., Britavskiy, N., Langer, N., Lennon, D. J., Mahy, L., Mandel, I., de Mink, S. E., Patrick, L. R., and66 more(2025) A high fraction of close massive binary stars at low metallicity.NatAs,9, 1337–1346. https://doi.org/10.1038/ s41550-025-02610-x. Schweickhardt, J., Schmutz...

  8. [24]

    Stevens, I

    https: //doi.org/10.1088/0067-0049/193/2/24. Stevens, I. R., Blondin, J. M., and Pollock, A. M. T. (1992) Colliding winds from early-type stars in binary systems.ApJ,386(1), 265–287. https://doi.org/10.1086/171013. Tramper, F., Sana, H., Fitzsimons, N. E., de Koter, A., Kaper, L., Mahy, L., and Moffat, A. (2016) The mass of the very massive binary WR21a.M...

  9. [25]

    Gosset, E

    Oral communication at the colloquium ’The Wolf–Rayet phenomenon in the Universe’ held in Morelia (Mexico), June 19–23, 2023 (available at https://hdl.handle.net/2268/334901). Gosset, E. and Nazé, Y. (2016) The X-ray light curve of the massive colliding wind Wolf– Rayet+ObinaryWR21a.A&A,590,A113. https://doi.org/10.1051/0004-6361/201527051. Gosset,E.,Rauw,...

  10. [44]

    https://doi.org/10.1088/0004-6256/145/2/44. 80 A. Journal of the Observations This appendix presents the journal of the observations directly associated with the present work. The four tables correspond to the four data sets (I, II, III, and IV). For each observation, weprovidethedate,theUniversalTime(UT)atthestartoftheexposure(exceptforTableA.3), the Hel...

  11. [63]

    Villaseñor, J

    https://doi.org/10.3390/galaxies6020063. Villaseñor, J. I., Sana, H., Mahy, L., Shenar, T., Bodensteiner, J., Britavskiy, N., Lennon, D. J., Moe, M., Patrick, L. R., Pawlak, M., and23 more(2025) Binarity at LOw Metallicity (BLOeM):EnhancedmultiplicityofearlyB-typedwarfsandgiantsat𝑍=0.2𝑍 ⊙.A&A,698, A41. https://doi.org/10.1051/0004-6361/202453166. Vink, J....

  12. [84]

    Pantaleoni González, M., Maíz Apellániz, J., Barbá, R

    https://doi.org/10.1088/0004-637X/788/1/84. Pantaleoni González, M., Maíz Apellániz, J., Barbá, R. H., Reed, B. C., Berlanas, S. R., Parras Rico, A., and Bodaghee, A. (2025) The Alma catalogue of OB stars – III. a cross- matchwithGaiaDR3andanextensionbasedonnewspectralclassifications.MNRAS,543(1), 63–82. https://doi.org/10.1093/mnras/staf1409. Parkin, E. ...

  13. [114]

    3847/1538-4357/ac02c4

    https://doi.org/10. 3847/1538-4357/ac02c4. Press,W.H.,Teukolsky,S.A.,Vetterling,W.T.,andFlannery,B.P.(2007)NumericalRecipes: The Art of Scientific Computing. Cambridge University Press, 3rd edition. Prilutskii, O. F. and Usov, V. V. (1976) X rays from Wolf–Rayet binaries.SvA,20(1), 2–4. https://ui.adsabs.harvard.edu/abs/1976SvA....20....2P. Pritchard, J. ...

  14. [147]

    Balona, L

    https://doi.org/10.3847/1538-3881/ abd806. Balona, L. and Crampton, D. (1974) The H𝛾-absolute magnitude calibration.MNRAS,166, 203–217. https://doi.org/10.1093/mnras/166.1.203. Banyard, G., Sana, H., Mahy, L., Bodensteiner, J., Villaseñor, J. I., and Evans, C. J. (2022) The observedmultiplicitypropertiesofB-typestarsintheGalacticyoungopenclusterNGC6231. A...

  15. [379]

    Werner, K

    https://doi.org/10.1086/132646. Werner, K. and Rauch, T. (2001) Identification of the 4486, 4504Å emission lines in O-type spectra. InEta Carinae and Other Mysterious Stars: The Hidden Opportunities of Emission Spectroscopy, edited by Gull, T. R., Johannson, S., and Davidson, K.,Astronomical Society of the Pacific Conference Series, volume 242, pages 229–...

This paper was first reviewed by grok-4.5 on July 31, 2026.