REVIEW 3 major objections 7 minor 77 references
A Two-Regime Statistical Framework for Wind-Power Distributions: From Wind-Speed Fluctuations to Turbine Control
T0 review · 3 major / 7 minor · reviewed 2026-08-01 · deepseek-v4-flash
Pith's one-line read A two-regime statistical framework, built on a Rician model of wind speed and the cubic power law, claims to reproduce both the bulk and the tail of wind-power distributions across four utility-scale wind farms.
desk verdict Correct derivation, clean empirical work, but the physical-interpretability claim rests on an unvalidated Rician assumption. read the letter →
The pith
A machine-rendered reading of the paper's core claim, the machinery that carries it, and where it could break.
The reading
What carries the argument
The central machinery is the Rician wind-speed model used as a prior density for the wind-speed magnitude, combined with a one-to-one change of variables p = v^3. Because the transformation is monotonic on the operating interval, the power density follows by substituting v = p^{1/3} into the Rician density, producing an explicit stretched-exponential-like tail exp(-p^{2/3}/(2 sigma^2)). The second piece is the bounded stretched-exponential CCDF for the near-rated power deficit, whose small-rate limit reduces to a bounded Pareto distribution; together these two components carry the full two-regime argument.
What would settle it
Measure the 10-minute wind-speed vectors at the same turbines, fit a Rician distribution to the empirical wind-speed magnitudes, and compare the fitted mu and sigma with the values estimated from power data; significant discrepancies would falsify the claim that the power-fit parameters are physically interpretable wind-flow parameters. Alternatively, if the high-power CCDF tail in the aerodynamic regime shows a decay exponent clearly different from 2/3 at fixed sigma, the cubic-plus-Rician prediction would be contradicted.
Extended reading notes
Core claim
The central claim is that if the 10-minute wind velocity decomposes into independent, equal-variance Gaussian components parallel and perpendicular to the turbine-facing direction, then the wind-speed magnitude is Rician; combining this with the monotone cubic relation p = v^3 and normalizing over the physical interval [p_c, p_s] yields an explicit power distribution (Eq. 10). The parameters mu and sigma are the coherent mean-flow component and fluctuation intensity, making the fit physically interpretable. The paper reports close agreement with empirical power histograms, CDFs, and CCDFs across four wind farms (Jensen-Shannon distance about 0.08-0.11, KS statistic about 0.008-0.015, Q-Q R^2
Load-bearing premise
The derivation assumes, without direct validation, that wind-speed components are independent Gaussians with equal variance, so that the wind-speed magnitude is Rician; the parameters are then inferred from power observations rather than from measured wind-speed statistics.
Editorial extensions
If this is right
- The derived distribution provides a direct, physically interpretable link from wind-speed statistics to power output, with mu and sigma representing the mean wind component and fluctuation intensity.
- The stretched-exponential tail in the aerodynamic regime offers a parametric estimate for the probability of high, sub-rated power events, which matters for grid reliability and transmission stress.
- The near-rated deficit statistics reduce to a single shape parameter beta in the bounded Pareto limit, simplifying the statistical description of turbine saturation behavior.
- The empirical finding that concatenated turbine deficits preserve the same stretched-exponential form suggests that turbine-level near-rated statistics are approximately identically distributed within a wind farm.
- The framework is presented as a basis for stochastic power forecasting, uncertainty quantification, and large-scale power-system modeling across the full operational range of utility-scale turbines.
Reading between the lines
- The paper fits mu and sigma from power observations rather than from wind-speed measurements; a direct test would be to estimate these parameters independently from wind data at the same turbines and compare, which would validate or refute the claimed physical interpretability.
- Because the derivation relies only on a monotone transformation, the same machinery could be applied to other elliptically symmetric or correlated wind-speed models; comparing the resulting tail exponents could discriminate among wind-speed models using power data alone.
- If the bounded Pareto limit holds universally, the near-rated regime is characterized by a single exponent beta per site; examining whether beta correlates with specific turbine control settings, curtailment strategies, or wake effects would be a natural extension not explored in the paper.
- The paper treats the near-rated deficit tail but excludes the sharp accumulation at epsilon near zero; a complete grid-relevant failure model would need to blend this discrete/regulated component with the continuous tail, which could be a follow-up.
Editorial analysis
A structured set of objections, weighed in public.
Referee Report
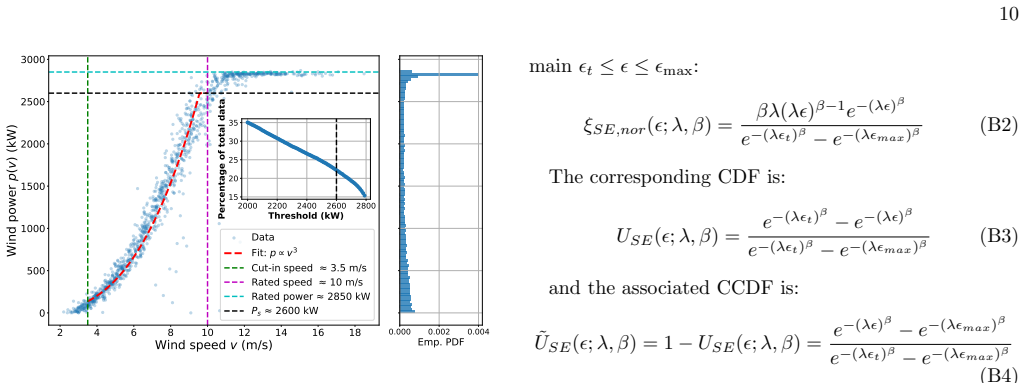
Summary. The paper develops a two-regime statistical description of utility-scale wind-power fluctuations. In the aerodynamic regime (cut-in to near-rated power), it assumes a Rician model for the 10-minute wind-speed magnitude, applies the cubic transformation p = v^3, and derives an analytical power PDF, Eq. (10), with parameters μ and σ estimated by maximum likelihood from power observations. In the control-dominated near-rated regime, it defines the power deficit ϵ = p0 − p and fits a bounded stretched-exponential CCDF, Eq. (23), reporting that λ is very small so the model approaches a bounded Pareto limit. The models are tested on multi-year operational data from four wind farms, with reported goodness-of-fit metrics (Jensen–Shannon distance, KS statistic, logarithmic L2 error, QQ R²) indicating good agreement. The paper concludes that the framework provides a physically interpretable description of wind-power variability across the full operational range.
Significance. If the physical-interpretability claim were fully supported, this would be a useful contribution: the derivation in Section II is mathematically correct, the power distribution is analytical, and the empirical near-rated stretched-exponential/Pareto tail is a genuinely interesting and potentially useful finding across four geographically distinct wind farms. The paper also makes a concrete falsifiable prediction through Eq. (10). However, the advertised physical interpretability rests entirely on the Rician wind-speed assumption, which is never validated against wind-speed data; the parameters are instead inferred from power data through a monotone transformation that would absorb a range of alternative wind-speed models. This is a load-bearing weakness, as is the loosely specified threshold ϵ_t in the near-rated model. The empirical fits themselves are plausible, but the paper currently overclaims the physical status of the model.
major comments (3)
- [Section V, Eq. (23)] The Rician wind-speed model is assumed but not tested against the measured wind-speed data. The parameters μ and σ are estimated by maximum likelihood from power observations, Eq. (12), not from wind-speed observations. Because p = v^3 is monotone, Eq. (6) is a flexible two-parameter family that will accommodate a range of empirical power shapes; indeed, the paper itself notes that Weibull or Gaussian wind-speed models would give qualitatively similar power distributions after the same change of variables. Therefore, the good fits in Table II cannot confirm the Rician assumption, and the claim in Section VI that μ and σ 'retain their direct physical meaning' is unsupported. Please either validate Eq. (4) directly on the 10-minute wind-speed records—e.g., fit the Rician model to v and compare with the power-inferred parameters—or substantially weaken the physical-interpretability claim an
- [Section V, Table III/Fig. 6] The transition value ϵ_t is never quantitatively defined. The text states only that 'beyond a transition value ϵ_t' the CCDF is smooth and that the model is applied over [ϵ_t, ϵ_max]; likewise, p_s is identified post hoc from the empirical speed–power curve ('typically lying 100–300 kW below rated power'). Because the fitted λ, β, and KS statistic depend on the trimming interval, a threshold chosen after inspecting the CCDF can inflate apparent agreement. Provide a reproducible, prespecified rule for selecting p_s and ϵ_t, and report the sensitivity of Table III to these choices.
- [Section V, Table III/Fig. 6] The 'confirmation' of the small-λ bounded Pareto limit is a consistency check, not an independent test. The transformed variable W(ϵ) in Eq. (26) is constructed from the same empirical CCDF and the same assumed limiting form, so the slope in Fig. 6 is not an independent estimate of β; it is expected to match the MLE β by construction if the model is a good fit. In addition, for Farms 2 and 3 the MLE of λ hits the imposed lower bound, and the representative-turbine β differs strongly from the ensemble β (0.34 vs 0.76; 0.27 vs 0.61), which suggests instability or heterogeneity that is not discussed. A proper model comparison (e.g., bounded stretched exponential vs bounded Pareto vs other tail models) and/or out-of-sample cross-validation would be needed to support the universal small-λ claim.
minor comments (7)
- [Figure 5 caption vs Eq. (22)] The caption defines the power deficit as ϵ = p − p0, while Eq. (22) defines ϵ = p0 − p. Since p ≤ p0, the caption is inconsistent with the text; please correct.
- [Section II and Figs. 1, 7–9] The text states v_cut-in ≈ 3.8 m/s for the representative turbine, but the figures mark the cut-in speed as 3.5 m/s. Please reconcile.
- [Eq. (7)] The notation for the normalization is garbled: it should be g(p; μ, σ) divided by the integral ∫_{pc}^{ps} g(p′; μ, σ) dp′. As printed, 'g(p)Z ps pc g(p)dp' is not readable.
- [Section II, 'see Table I'] The sentence about the fraction of observations in the near-rated regime cites Table I, but Table I contains only farm characteristics; the percentages appear in the figures/appendix. Please correct the cross-reference.
- [Fig. 4 caption] The caption reports 'D_KL = 0.009', but the metrics defined and reported in Table II are D_JS, D_KS, and L2; D_KL is not otherwise used. Please clarify whether this is a different metric or a typo.
- [Eq. (20)] The asymptotic stretched-exponential CCDF in Eq. (20) is written as an equality, but it is a proportionality/asymptotic approximation; the normalization constant is omitted. Please write it with ∼ or include the normalization.
- [Table II] The 95% confidence intervals are reported without stating whether they come from bootstrapping or asymptotic standard errors. A one-sentence description of the method would help reproducibility.
Circularity Check
Core derivation is self-contained, but the near-rated 'independent' β check is circular because W(ε) is defined using the MLE β; the claimed physical interpretability of μ,σ rests on an untested Rician assumption.
-
fitted input called prediction
[Section V, Eq. (26) and Fig. 6]
"To verify this limiting behavior, we define the transformed empirical CCDF W(ε) = ε_max^β/(ε_max^β − ε_t^β) − U_emp(ε) ... The measured slope is in excellent agreement with the exponent β obtained independently from the maximum-likelihood fit of the bounded stretched-exponential distribution (Table III), thereby confirming the small-λ bounded Pareto limit."
W(ε) is constructed using the same β that the MLE already estimated from the power-deficit data. In the bounded-Pareto limit the model gives W(ε) ∝ ε^β by definition, so the log-log slope of W is mathematically tied to the input β. Calling the slope 'obtained independently' is therefore a consistency check written in terms of its own fitted parameter, not an independent confirmation.
-
fitted input called prediction
[Section III (Eq. 12) and Section VI]
"we employ maximum likelihood estimation (MLE), which infers the parameters directly from the raw power observations ... The parameters μ and σ retain their direct physical meaning, representing the coherent mean-flow component and the intensity of wind-speed fluctuations, respectively."
μ and σ are estimated only from power observations (Eq. 12), and the same observations are then used to claim that the derived distribution 'accurately reproduces' the empirical power distribution (Table II). The Rician wind-speed assumption is never tested against measured wind-speed data, and the paper concedes that applying the same cubic transformation to Weibull or Gaussian wind-speed models yields qualitatively similar power distributions. The asserted 'direct physical meaning' is thus an interpretation of in-sample fitted constants, not a separately measured or predicted wind-speed quantity.
full rationale
The aerodynamic-regime derivation (Eqs. 2–10) is a standard change of variables: with p=v^3 monotone on [pc,ps], the Rician density transforms to Eq. 6 and the normalized PDF/CDF of Eqs. 7–10 follow by calculus; no hidden identity makes the derivation equivalent to its inputs. There is no load-bearing self-citation chain: the cubic power curve and wind-power fluctuation references are background context, not uniqueness arguments. The principal circularity is the near-rated 'independent' verification in Section V: Eq. 26 defines W(ε) using the same β that was fitted by maximum likelihood, so the observed slope in Fig. 6 agreeing with β is built into the construction, not an independent confirmation. Additionally, the physical-interpretability claim for μ and σ is not independently supported: the parameters are fit to power data, the Rician model is assumed rather than tested, and the paper itself allows that other wind-speed models give similar power distributions after the same monotone transformation. The in-sample goodness-of-fit metrics (Table II) show the model can fit the calibration data but do not constitute an out-of-sample prediction. These issues are partial and localized, so the score is 4 rather than higher.
Assumptions & free parameters
free parameters (6)
- μ (Rician mean-flow component) =
9.32 m/s (Farm 1); 9.61 (Farm 2); 10.36 (Farm 3); 9.21 (Farm 4), Table II
- σ (Rician fluctuation intensity) =
3.98 m/s (Farm 1); 4.81 (Farm 2); 4.24 (Farm 3); 4.41 (Farm 4), Table II
- p_s (onset of near-rated saturation) =
≈2500 kW (Farm 1); 2350 (Farms 2,3); 2600 (Farm 4), Figures 1,7-9
- ε_t (transition value for near-rated tail) =
not reported
- λ (stretched-exponential rate) =
1.93e-4 (Farm 1); ≤1e-5 (Farms 2,3); 7.44e-4 (Farm 4), Table III
- β (stretched-exponential shape) =
0.85 (Farm 1 turbine); 0.34 (Farm 2 turbine); 0.27 (Farm 3 turbine); 0.66 (Farm 4 turbine); ensemble values 0.81, 0.76,
assumptions (5)
- domain assumption Wind-speed magnitude follows the Rician distribution with independent Gaussian components: v_parallel ~ N(μ, σ²), v_perp ~ N(0, σ²).
- domain assumption Power is exactly cubic in wind speed over the aerodynamic operating interval: p = v³ (after absorbing constants).
- standard math Standard change-of-variables formula for probability densities.
- standard math Marcum Q-function is the CDF of the Rician distribution.
- ad hoc to paper Bounded stretched-exponential model for the near-rated power deficit tail.
Cite this review
Pith. "Pith review of A Two-Regime Statistical Framework for Wind-Power Distributions: From Wind-Speed Fluctuations to Turbine Control." pith.science (2026). https://pith.science/paper/DHDYKV63
@misc{pith2026260725863,
  author       = {Pith},
  title        = {Pith review of: A Two-Regime Statistical Framework for Wind-Power Distributions: From Wind-Speed Fluctuations to Turbine Control},
  year         = {2026},
  howpublished = {\url{https://pith.science/paper/DHDYKV63}},
  note         = {Machine review of arXiv:2607.25863}
}
read the original abstract
Wind-power variability is a major challenge for the reliable integration of utility-scale wind energy into modern power systems. Although wind-speed statistics are often described by simple parametric distributions, translating these statistics into turbine-level power fluctuations is nontrivial because the relationship between wind speed and power is highly nonlinear and changes across different turbine operating regimes. Here, we develop a two-regime statistical framework for wind-power distributions. In the aerodynamic operating regime, between the cut-in and rated speeds, the turbine power follows an approximate cubic dependence on wind speed. Starting from a physically motivated Rician model for the wind-speed magnitude, we derive an analytical expression for the corresponding wind-power distribution using a nonlinear change of variables. In the control-dominated near-rated regime, where active blade-pitch and generator control regulate the turbine output, the aerodynamic transformation is no longer applicable. Instead, we characterize the power deficit relative to the rated power and show empirically that its continuous tail is well described by a bounded stretched-exponential distribution for both individual turbines and wind-farm ensembles. These results provide a physically interpretable statistical description of wind-power fluctuations across the full operational range of utility-scale wind turbines.
Figures


Figures from the paper (6 more)


Reference graph
Works this paper leans on
-
[1]
Chidzonga and B
R. Chidzonga and B. Nleya, Perspectives on impact of high penetration of renewable sources on lv networks, in 2020 International Conference on Artificial Intelligence, Big Data, Computing and Data Communication Systems (icABCD)(2020) pp. 1–5
2020
-
[2]
Dalala, M
Z. Dalala, M. Al-Omari, M. Al-Addous, M. Bdour, Y. Al- Khasawneh, and M. Alkasrawi, Increased renewable en- ergy penetration in national electrical grids constraints and solutions, Energy246, 123361 (2022)
2022
-
[3]
H. Chum, A. Faaij, J. Moreira, G. Berndes, P. Dhamija, 11 H. Dong, B. Gabrielle, A. G. Eng, W. Lucht, M. Mapako, et al., Ipcc special report on renewable energy sources and climate change mitigation, Cambridge University Press, Cambridge. United Kingdom and New York, NY, USA (2011)
2011
-
[4]
Apt and P
J. Apt and P. Jaramillo,Variable renewable energy and the electricity grid(Routledge, 2014)
2014
-
[5]
Schmietendorf, J
K. Schmietendorf, J. Peinke, and O. Kamps, The impact of turbulent renewable energy production on power grid stability and quality, The European Physical Journal B 90, 1 (2017)
2017
-
[6]
Smith, O
O. Smith, O. Cattell, E. Farcot, R. D. O’Dea, and K. I. Hopcraft, The effect of renewable energy incorporation on power grid stability and resilience, Science advances 8, eabj6734 (2022)
2022
-
[7]
D. J. MacKay,Sustainable Energy-without the hot air (Bloomsbury Publishing, 2016)
2016
-
[8]
Apt, The spectrum of power from wind turbines, Jour- nal of power sources169, 369 (2007)
J. Apt, The spectrum of power from wind turbines, Jour- nal of power sources169, 369 (2007)
2007
Show all 77 references
-
[9]
G. Bel, C. Connaughton, M. Toots, and M. Bandi, Grid- scale fluctuations and forecast error in wind power, New Journal of Physics18, 023015 (2016)
2016
-
[10]
M. M. Bandi, Spectrum of wind power fluctuations, Phys- ical review letters118, 028301 (2017)
2017
-
[11]
Bel and M
G. Bel and M. M. Bandi, Geographic dependence of the solar irradiance spectrum at intermediate to high fre- quencies, Physical Review Applied12, 024032 (2019)
2019
-
[12]
Bel and M
G. Bel and M. Bandi, Spectral analysis of solar-irradiance fluctuations, Physical Review Applied21, 034019 (2024)
2024
-
[13]
M. M. Bandi and J. Apt, Variability of the wind turbine power curve, Applied Sciences6, 262 (2016)
2016
-
[14]
Z. Chen, L. Wu, and M. Shahidehpour, Effective load carrying capability evaluation of renewable energy via stochastic long-term hourly based scuc, IEEE Transac- tions on Sustainable Energy6, 188 (2015)
2015
-
[15]
Q. Song, B. Wang, Z. Wang, and L. Wen, Multi- objective capacity configuration optimization of the com- bined wind - storage system considering elcc and lcoe, Energy301, 131558 (2024)
2024
-
[16]
O. M. Ajami, M. S. Alkhusaibi, R. H. Tan, F. A. Ja- maludin, and M. Nadarajah, The impact of increased re- newable energy penetration and reduced inertia on the frequency nadir in a multi-area interconnected network based on the peninsula malaysia national grid, Global Energy ...
2026
-
[17]
Bevrani,Robust power system frequency control (Springer, 2009)
H. Bevrani,Robust power system frequency control (Springer, 2009)
2009
-
[18]
X. Chen, M. Zhang, Z. Wu, L. Wu, and X. Guan, Model- free load frequency control of nonlinear power systems based on deep reinforcement learning, IEEE Transactions on Industrial Informatics20, 6825 (2024)
2024
-
[19]
D. G. Padhan and S. Majhi, A new control scheme for pid load frequency controller of single-area and multi- area power systems, ISA Transactions52, 242 (2013)
2013
-
[20]
S. Lim, T. Kim, K. Yoon, D. Choi, and J.-W. Park, A study on frequency stability and primary frequency re- sponse of the korean electric power system considering the high penetration of wind power, Energies15, 1784 (2022)
2022
-
[21]
D. R. Aryani, H. Song, and Y.-S. Cho, Operation strat- egy of battery energy storage systems for stability im- provement of the korean power system, Journal of Energy Storage56, 106091 (2022)
2022
-
[22]
Ingole, U
O. Ingole, U. Chavan, J. Chandrawanshi, S. Kathane, U. Kale, and J. Sawant, Optimizing load balancing through simulation of renewable energy integration, In- ternational Journal of Scientific Research in Science, En- gineering and Technology12, 960 (2025)
2025
-
[23]
P. J. Menck, J. Heitzig, J. Kurths, and H. Joachim Schellnhuber, How dead ends under- mine power grid stability, Nature communications5, 3969 (2014)
2014
-
[24]
Rohden, A
M. Rohden, A. Sorge, M. Timme, and D. Witthaut, Self- organized synchronization in decentralized power grids, Physical review letters109, 064101 (2012)
2012
-
[25]
Veers, K
P. Veers, K. Dykes, E. Lantz, S. Barth, C. L. Bottasso, O. Carlson, A. Clifton, J. Green, P. Green, H. Holttinen, et al., Grand challenges in the science of wind energy, Science366, eaau2027 (2019)
2019
-
[26]
Van Kuik, J
G. Van Kuik, J. Peinke, R. Nijssen, D. Lekou, J. Mann, J. N. Sørensen, C. Ferreira, J.-W. van Wingerden, D. Schlipf, P. Gebraad,et al., Long-term research chal- lenges in wind energy–a research agenda by the european academy of wind energy, Wind energy science1, 1 (2016)
2016
-
[27]
Peinke and A
J. Peinke and A. Fuchs, L’´ energie ´ eolienne, du point de vue de la physique, Reflets de la physique , 67 (2024)
2024
-
[28]
S. E. Lakhal, J. E. Sardonia, and M. M. Bandi, Collective and nonlinear structure of wind-power correlations, PRX Energy (2026)
2026
-
[29]
Akda˘ g, H
S. Akda˘ g, H. Bagiorgas, and G. Mihalakakou, Use of two- component weibull mixtures in the analysis of wind speed in the eastern mediterranean, Applied Energy87, 2566 (2010)
2010
-
[30]
S. A. Akda˘ g and A. Dinler, A new method to estimate weibull parameters for wind energy applications, Energy conversion and management50, 1761 (2009)
2009
-
[31]
Lencastre, A
P. Lencastre, A. Yazidi, and P. G. Lind, Modeling wind- speed statistics beyond the weibull distribution, Energies 17, 2621 (2024)
2024
-
[32]
H. Shi, Z. Dong, N. Xiao, and Q. Huang, Wind speed distributions used in wind energy assessment: a review, Frontiers in Energy Research9, 769920 (2021)
2021
-
[33]
M. Wadi, Chapter 11 - an empirical investigation into wind energy modeling: a case study utilizing five dis- tributions and four advanced optimization methods, inPower Electronics Converters and their Control for Renewable Energy Applications, edited by A. Fekik, M. Ghanes, an...
2023
-
[34]
Celik, A simplified model for estimating yearly wind fraction in hybrid-wind energy systems, Renewable En- ergy31, 105 (2006)
A. Celik, A simplified model for estimating yearly wind fraction in hybrid-wind energy systems, Renewable En- ergy31, 105 (2006)
2006
-
[35]
Carta, P
J. Carta, P. Ram ´ ırez, and S. Vel´ azquez, A review of wind speed probability distributions used in wind energy anal- ysis: Case studies in the canary islands, Renewable and Sustainable Energy Reviews13, 933 (2009)
2009
-
[36]
Carta and P
J. Carta and P. Ram ´ ırez, Analysis of two-component mix- ture weibull statistics for estimation of wind speed dis- tributions, Renewable Energy32, 518 (2007)
2007
-
[37]
A. N. Celik, Energy output estimation for small-scale wind power generators using weibull-representative wind data, Journal of Wind Engineering and Industrial Aero- dynamics91, 693 (2003)
2003
-
[38]
T. P. Chang, Performance comparison of six numerical methods in estimating weibull parameters for wind en- ergy application, Applied Energy88, 272 (2011)
2011
-
[39]
P. K. Chaurasiya, S. Ahmed, and V. Warudkar, Study of different parameters estimation methods of weibull dis- 12 tribution to determine wind power density using ground based doppler sodar instrument, Alexandria Engineering Journal57, 2299 (2018)
2018
-
[40]
Chellali, A
F. Chellali, A. Khellaf, A. Belouchrani, and R. Khan- niche, A comparison between wind speed distributions derived from the maximum entropy principle and weibull distribution. case of study; six regions of algeria, Renew- able and Sustainable Energy Reviews16, 379 (2012)
2012
-
[41]
Ghaffari, M
A. Ghaffari, M. Krstic, and S. Seshagiri, Power optimiza- tion and control in wind energy conversion systems using extremum seeking, IEEE Transactions on Control Sys- tems Technology22, 1684 (2014)
2014
-
[42]
Lydia, S
M. Lydia, S. S. Kumar, A. I. Selvakumar, and G. E. Prem Kumar, A comprehensive review on wind turbine power curve modeling techniques, Renewable and Sustainable Energy Reviews30, 452 (2014)
2014
-
[43]
K. E. Johnson,Adaptive torque control of variable speed wind turbines(University of Colorado at Boulder, 2004)
2004
-
[44]
Narayana, S
P. Narayana, S. Yadlapati, and P. Tripura, Optimal torque control strategy for a variable speed wind tur- bine, International Journal of Control Theory and Ap- plications9, 369 (2016)
2016
-
[45]
J. L. Dom ´ ınguez-Garc ´ ıa, O. Gomis-Bellmunt, F. D. Bianchi, and A. Sumper, Power oscillation damping sup- ported by wind power: A review, Renewable and Sus- tainable Energy Reviews16, 4994 (2012)
2012
-
[46]
Y. Wang, Y. Guo, Y. Du, and W. Xu, Flexible torque control for wind turbines considering frequency response under wind speed crossing region, Frontiers in Energy Re- searchV olume 11 - 2023, 10.3389/fenrg.2023.1181996 (2023)
2023
-
[47]
Yang and B
X. Yang and B. Fei, Mri denoising, (2013)
2013
-
[48]
Karaku¸ s, E
O. Karaku¸ s, E. E. Kuruo˘ glu, and A. Achim, A general- ized gaussian extension to the rician distribution for sar image modeling, IEEE Transactions on Geoscience and Remote Sensing60, 1 (2022)
2022
-
[49]
Famoye, Continuous univariate distributions, volume 1, Technometrics37, 466 (1995)
F. Famoye, Continuous univariate distributions, volume 1, Technometrics37, 466 (1995)
1995
-
[50]
IEC,Wind energy generation systems – Part 12-1: Power performance measurements of electricity producing wind turbines, Tech. Rep. IEC 61400-12-1:2017 (Interna- tional Electrotechnical Commission, Geneva, Switzer- land, 2017)
2017
-
[51]
Wang and W
Z. Wang and W. Liu, Wind energy potential assessment based on wind speed, its direction and power data, Sci- entific reports11, 16879 (2021)
2021
-
[52]
A. A. Subuh, S. H. A. Kaboli, M. Waqar, and F. Vall´ ee, Hybrid model for cleaning abnormal data of wind tur- bine power curve based on machine learning approaches, e-Prime-Advances in Electrical Engineering, Electronics and Energy13, 101043 (2025)
2025
-
[53]
Veena, S
R. Veena, S. Mathew, and M. Petra, Artificially intel- ligent models for the site-specific performance of wind turbines, International Journal of Energy and Environ- mental Engineering11, 289 (2020)
2020
-
[54]
Starke, C
G. Starke, C. Meneveau, J. King, and D. Gayme, A dy- namic model of wind turbine yaw for active farm control, Wind Energy27, 1302 (2023)
2023
-
[55]
Y. Liu, S. Liu, L. Zhang, F. Cao, and L. Wang, Optimization of the yaw control error of wind tur- bine, Frontiers in Energy ResearchV olume 9 - 2021, 10.3389/fenrg.2021.626681 (2021)
2021
-
[56]
Astolfi, F
D. Astolfi, F. Castellani, and F. Natili, Wind turbine yaw control optimization and its impact on performance, Machines7, 41 (2019)
2019
-
[57]
Zhang, J
J. Zhang, J. Wang, and S. Yan, The effect of yaw speed and delay time on power generation and stress of a wind turbine, International Journal of Green Energy20, 1 (2022)
2022
-
[58]
G. Cui, X. Yu, S. Iommelli, and L. Kong, Exact distri- bution for the product of two correlated gaussian ran- dom variables, IEEE Signal Processing Letters23, 1662 (2016)
2016
-
[59]
Balakrishnan,Mathematical Physics: Applications and Problems(2020)
V. Balakrishnan,Mathematical Physics: Applications and Problems(2020)
2020
-
[60]
Jakob, A
M. Jakob, A. Aissiou, W. Morrish, F. Marsiglio, M. Is- lam, A. Kartouzian, and A. Meldrum, Reappraising the luminescence lifetime distributions in silicon nanocrys- tals, Nanoscale Research Letters13(2018)
2018
-
[61]
Kim and B
Y. Kim and B. M. Weon, Stretched exponential dynamics in online article views, Frontiers in PhysicsV olume 8 - 2020, 10.3389/fphy.2020.619729 (2021)
2020
-
[62]
V. K. Rohatgi and A. M. E. Saleh,An introduction to probability and statistics(John Wiley & Sons, 2015)
2015
-
[63]
Colin, Statistics of extreme values of stochastic pro- cesses generated by rotating machines and associated probabilistic reliability model, Mechanics & Industry18, 215 (2017)
B. Colin, Statistics of extreme values of stochastic pro- cesses generated by rotating machines and associated probabilistic reliability model, Mechanics & Industry18, 215 (2017)
2017
-
[64]
´Arp´ ad Baricz, Tight bounds for the generalized marcum q-function, Journal of Mathematical Analysis and Appli- cations360, 265 (2009)
2009
-
[65]
Newman, Power laws, pareto distributions and zipf’s law, Contemporary Physics46, 323–351 (2005)
M. Newman, Power laws, pareto distributions and zipf’s law, Contemporary Physics46, 323–351 (2005)
2005
-
[66]
Alstott, E
J. Alstott, E. Bullmore, and D. Plenz, powerlaw: A python package for analysis of heavy-tailed distributions, PLoS ONE9, e85777 (2014)
2014
-
[67]
Farrell and S
S. Farrell and S. Lewandowsky, Maximum likelihood pa- rameter estimation, inComputational Modeling of Cog- nition and Behavior(Cambridge University Press, 2018) p. 72–104
2018
-
[68]
P. C. Chang, 95% confidence interval, inData Analysis of Medical Studies: Reading and Reporting(Springer Na- ture Switzerland, Cham, 2025) pp. 385–391
2025
-
[69]
Beasley and J
W. Beasley and J. Rodgers, Bootstrapping and monte carlo methods (2012) pp. 407–425
2012
-
[70]
Men´ endez, J
M. Men´ endez, J. Pardo, L. Pardo, and M. Pardo, The jensen-shannon divergence, Journal of the Franklin In- stitute334, 307 (1997)
1997
-
[71]
J. K. Hoyos-Osorio and L. G. Sanchez-Giraldo, The representation jensen-shannon divergence (2024), arXiv:2305.16446 [cs.LG]
2024 arXiv
-
[72]
S. L. Brunton and J. N. Kutz,Data-Driven Science and Engineering: Machine Learning, Dynamical Sys- tems, and Control(Cambridge University Press, 2022) p. 251–252
2022
-
[73]
Z. U. Koreshi, Chapter 4 - mathematical foundations, in Nuclear Engineering Mathematical Modeling and Simu- lation(Academic Press, 2022) pp. 149–209
2022
-
[74]
Majumdar and G
S. Majumdar and G. Schehr,Statistics of Extremes and Records in Random Sequences(2024)
2024
-
[75]
Sabhapandit, Extremes and records (2019), arXiv:1907.00944 [cond-mat.stat-mech]
S. Sabhapandit, Extremes and records (2019), arXiv:1907.00944 [cond-mat.stat-mech]
2019 arXiv
-
[76]
Clauset, C
A. Clauset, C. R. Shalizi, and M. E. Newman, Power- law distributions in empirical data, SIAM review51, 661 (2009)
2009
-
[77]
Malevergne*, V
Y. Malevergne*, V. Pisarenko, and D. Sornette, Empiri- cal distributions of stock returns: between the stretched 13 exponential and the power law?, Quantitative Finance5, 379 (2005)
2005
Reviewed August 1, 2026 · model on record in the stance chip above.
Discussion (0). Continue with ORCID to comment.