REVIEW 4 major objections 6 minor 12 references
Watershed vs. Region Growing for Individual Tree Segmentation from Airborne LiDAR: An Urban Case Study in Bologna
T0 review · 4 major / 6 minor · reviewed 2026-07-30 · grok-4.5
Pith's one-line read Two LiDAR tree-segmentation methods disagree on short trees in Bologna, and the municipal catalogue is too incomplete and outdated to judge either.
desk verdict Honest local pipeline paper: useful Bologna baseline and open-data gap evidence, but the headline “half missing” rate is partly an artifact of watershed over-segmentation, and the carbon/pollen maps rest on transferred coefficients the authors already flag. read the letter →
The pith
A machine-rendered reading of the paper's core claim, the machinery that carries it, and where it could break.
The reading
What carries the argument
The paired segmentation engines—watershed flooding of local maxima on a smoothed canopy-height model versus iterative highest-point region growing on the raw 3D vegetation cloud—produce the per-tree polygons and point labels from which height, crown radius, biomass and pollen indicators are derived.
What would settle it
A field campaign or terrestrial/mobile LiDAR survey on the same twelve tiles that independently counts trees taller than 10 m and measures their true crown bases would show whether watershed over-segments the short end and whether the fixed L = H/2 volume formula systematically mis-estimates pollen and biomass.
Extended reading notes
Core claim
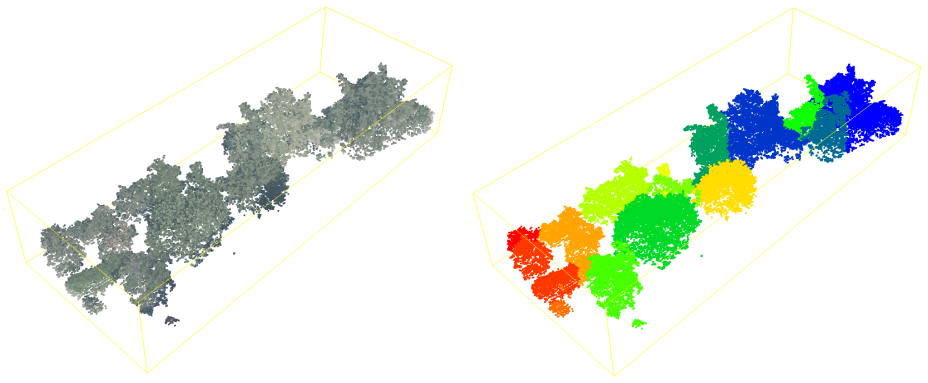
On twelve Talea tiles, watershed segmentation of the canopy-height model detects 7589 trees dominated by a height peak near 5 m, whereas point-wise region growing detects 6432 trees yet retains returns above 40 m; the municipal open-data catalogue fails as ground truth because, on a sample tile, about half the LiDAR trees are absent, several catalogue locations hold no tree, and most height records date from roughly two decades ago.
Load-bearing premise
Carbon and pollen numbers rest on allometric coefficients fitted to plantation dawn redwood and on a fixed live-crown ratio of half the tree height applied to every Bologna street and park tree.
Editorial extensions
If this is right
- Periodic airborne LiDAR can keep the municipal tree inventory current by flagging removals, new plantings, and updated heights and crown extents.
- Watershed crown polygons can be joined directly to species labels for city-scale carbon and allergen maps even before better allometries exist.
- Region growing preserves the tallest individuals, so biomass totals that depend steeply on height will be less biased toward underestimation once crown reconstruction is added.
- The modular pipeline accepts improved vegetation classifications or new sensors without redesigning the indicator layer.
Reading between the lines
- Once a curated reference set exists, the same two engines can be scored for precision/recall by height class, turning the present qualitative contrast into a quantitative recommendation for dense urban canopies.
- Species-specific crown-ratio and allometric recalibration against urban tree databases would shrink the largest systematic error in the carbon and pollen layers without changing the segmentation code.
- The observed catalogue gaps suggest LiDAR difference maps could become an operational maintenance trigger for the city rather than only a research product.
Editorial analysis
A structured set of objections, weighed in public.
Referee Report
Summary. The manuscript presents an end-to-end airborne-LiDAR pipeline for individual-tree segmentation and structural characterisation of tall urban vegetation in Bologna. Starting from Random-Forest-classified high-vegetation points, it implements and compares watershed segmentation on a Canopy Height Model with a point-wise region-growing algorithm operating directly on the 3-D cloud over 12 tiles of the Talea district. Watershed yields more trees (7589) with a height peak near 5 m; region growing yields fewer (6432) but retains individuals above 40 m. The authors confront the results with the municipal Alberi in manutenzione catalogue on a sample tile, reporting that roughly half of LiDAR-detected trees are absent, some catalogue points have no tree, and most height records are ~20 years old, concluding the catalogue is unsuitable as ground truth. Height and crown radius from the segmented trees are used to compute preliminary above-ground biomass/carbon (Lin allometry) and annual pollen production (species-specific inflorescence coefficients), collected in an interactive per-tree map. The pipeline is presented as modular and recalibratable.
Significance. If the descriptive comparison and open-data gap analysis hold, the work supplies a practical, city-scale case study and a reusable modular codebase (public GitHub) for urban greenery inventories where municipal catalogues are incomplete or outdated. The honest refusal to claim quantitative superiority without ground truth, the explicit documentation of free parameters, and the interactive metadata map are genuine strengths. Methodological novelty is limited—both segmenters are established—but the side-by-side urban application, the concrete demonstration that Alberi in manutenzione cannot serve as GT, and the end-to-end path to carbon and pollen demonstrators are useful for municipal planning and for subsequent field-validation campaigns. Significance is therefore applied and infrastructural rather than algorithmic.
major comments (4)
- [§3, Fig. 7; abstract; §4.4] §3, Fig. 7 and the abstract state that on a sample tile “roughly half” of LiDAR-detected trees are absent from Alberi in manutenzione. That comparison is performed with watershed crowns. §4.4 simultaneously reports that watershed produces 7589 trees versus 6432 for region growing, with the excess concentrated at a ~5 m height peak that the authors attribute to CHM-smoothing fragmentation. Those short/small segments are precisely the objects least likely to appear in a municipal maintenance catalogue. The quantitative ~50 % omission figure is therefore confounded by over-segmentation and cannot be read as a clean inventory-gap rate. The negative evidence (catalogue points with no tree, Fig. 8; ~20-year-old heights, Fig. 6) remains valid, but the headline “half missing” claim that anchors the abstract must be recomputed with region-growing crowns and/or after a height or area filter, and t
- [§5.1, Eq. (1), Fig. 19] §5.1, Eq. (1): AGB is computed with α=0.0511, β=1.9486 fitted by Lin et al. on plantation dawn redwood (Metasequoia glyptostroboides). The authors correctly note that Bologna’s urban forest is dominated by broadleaves with different crown architectures, yet the resulting AGB/carbon map (Fig. 19) is still presented as a city-scale product. Because biomass scales steeply with H, systematic bias in the allometric transfer dominates the absolute carbon stock. Either (i) replace or bracket the coefficients with the urban-specific equations from the McPherson Urban Tree Database already cited ([7,11]), or (ii) relegate the map explicitly to a methodological demonstrator and suppress absolute stock totals until a local or genus-resolved calibration exists.
- [§5.1.1–5.1.2, §5.2] §5.1.1–5.1.2: Indicators are computed only on watershed polygons because they supply closed 2-D crowns for species join and area. The text argues that over-segmentation “affects almost exclusively the low end” and contributes negligibly to carbon (steep H scaling) while mattering more for pollen (R-dominated). This is plausible but unquantified. A short sensitivity table—total AGB and total pollen with vs. without a minimum-height or minimum-area cut, and ideally the same indicators after a simple convex-hull crown reconstruction on the region-growing labels—would make the claim falsifiable and would justify the exclusive use of watershed for the public map.
- [§4.3–4.4] No spatial agreement metric between the two segmenters is reported—only aggregate height and crown-radius histograms (§4.3–4.4). Even without external ground truth, one can compute, e.g., the fraction of region-growing tops that fall inside a watershed polygon, or a bipartite matching of crowns within a distance tolerance. Such internal consistency numbers would strengthen the claim that the methods “agree on trees above 10 m” and would clarify how much of the count discrepancy is pure fragmentation versus genuine omission/commission.
minor comments (6)
- [Fig. 5] Fig. 5 caption says “lidar heights are computed with watershed method” but does not state how many trees were successfully matched or what distance threshold was used for the Open Data–LiDAR pairing; add those numbers.
- [§4.2] §4.2: the region-growing proximity and “elongated distribution” criteria are described qualitatively; the actual distance/threshold values (or a pointer to the GitHub config) should appear in the text for reproducibility.
- [§5.2, Eq. (3)] §5.2, Eq. (3): fixing L=H/2 for every individual is acknowledged as conservative; state the numerical factor by which total pollen would change under L=H or under a genus-mean live-crown ratio from McPherson, so readers can gauge sensitivity.
- [§5.1.2] Species transfer uses a 30 m buffer then nearest centroid (§5.1.2). In dense street-tree rows this can assign the wrong species; report the distribution of join distances and the fraction of polygons left unassigned.
- [Abstract; bibliography] Minor typography: “theTaleadistrict” (missing spaces) in the abstract; “UA V-borne” and “UA V-lidar” should be “UAV-borne”/“UAV-lidar”; bibliography entry [5] has venue volume/pages incomplete relative to the DOI.
- [Fig. 16] Fig. 16 tile list uses EPSG-like codes without stating the CRS explicitly in the caption; add “EPSG:32632” or equivalent.
Circularity Check
No circularity: empirical segmentation comparison and external-coefficient indicators, not tautological predictions
full rationale
The paper’s load-bearing results are observational counts and distributions (watershed 7589 vs region-growing 6432 trees over 12 tiles; height/crown histograms; sample-tile mismatch with Alberi in manutenzione) and modular application of externally published formulas (Lin et al. AGB with stated α,β; IPCC 0.47; literature D,E pollen coefficients; fixed L=H/2 crown-depth ansatz). None of these reduce by construction to quantities fitted on the same Bologna LiDAR and then re-presented as predictions. The prior Random Forest classifier and Rondini thesis supply only the input vegetation class and are explicitly declared substitutable; they do not underwrite a uniqueness claim or force the segmentation or catalogue conclusions. Transfer caveats on dawn-redwood allometry and constant live-crown ratio are correctness/generalization risks, not circular derivation. Score 0.
Assumptions & free parameters
free parameters (6)
- allometric α, β (Lin et al.) =
α=0.0511, β=1.9486
- live-crown ratio L/H =
0.5
- carbon fraction of AGB =
0.47
- species inflorescence coefficients D, E =
species-specific table (external)
- spatial join buffer for species transfer =
30 m
- region-growing proximity / elongation thresholds
assumptions (6)
- domain assumption Input points labelled high vegetation by the prior Random Forest classifier are a sufficiently clean mask for individual-tree segmentation.
- domain assumption CHM = DSM_v − DTM_v and local maxima of the (smoothed) CHM are valid treetop markers for watershed flooding.
- domain assumption Point-wise region growing by descending elevation with nearest-neighbour inheritance and elongation checks (Li et al. 2012) yields individual crowns.
- domain assumption Crown radius R is the radius of the equal-area circle of the segmented canopy footprint.
- ad hoc to paper Municipal Open Data species labels, when present, can be transferred to LiDAR crowns by nearest-centroid proximity.
- domain assumption Airborne LiDAR returns are inadequate to observe crown base, so crown depth cannot be measured per tree and must be modelled.
Cite this review
Pith. "Pith review of Watershed vs. Region Growing for Individual Tree Segmentation from Airborne LiDAR: An Urban Case Study in Bologna." pith.science (2026). https://pith.science/paper/FR6EUM7D
@misc{pith2026260727018,
  author       = {Pith},
  title        = {Pith review of: Watershed vs. Region Growing for Individual Tree Segmentation from Airborne LiDAR: An Urban Case Study in Bologna},
  year         = {2026},
  howpublished = {\url{https://pith.science/paper/FR6EUM7D}},
  note         = {Machine review of arXiv:2607.27018}
}
read the original abstract
We present a LiDAR-based pipeline for the segmentation and structural characterisation of tall urban vegetation in Bologna. Starting from airborne LiDAR point clouds previously classified as high vegetation by a Random Forest model, we implement and compare two individual-tree segmentation strategies: a watershed algorithm applied to the Canopy Height Model and a point-wise region growing algorithm operating directly on the three-dimensional cloud. Over an area of 12 tiles covering the Talea district, the watershed method detects a larger number of trees (7589), dominated by short trees with a height peak around 5 meters, whereas region growing yields fewer trees (6432) but retains the highest returns, yielding individuals above 40 meters, reflecting the absence of a smoothing step in the latter. We further confront the segmentation results with the municipal Open Data catalogue Alberi in manutenzione: on a sample tile roughly half of the LiDAR-detected trees turn out to be absent from the catalogue, several catalogued positions correspond to locations where no tree is observed, and the majority of the height records date back about two decades, which makes the dataset unsuitable as a ground truth reference. From the segmented trees we extract height and crown radius and use them to compute preliminary vegetation indicators, namely above-ground biomass and carbon storage through allometric relations and annual pollen production through species-specific inflorescence coefficients. All results are collected in an interactive per-tree metadata map. The pipeline is modular and can be recalibrated as improved classifications, field campaigns, or complementary sensing technologies become available, providing a scalable basis for data-driven urban greenery planning.
Figures


Figures from the paper (18 more)




Reference graph
Works this paper leans on
-
[1]
Lohani and S
B. Lohani and S. Ghosh , title =. Proceedings of the National Academy of Sciences, India Section A: Physical Sciences , volume =. 2017 , doi =
2017
-
[2]
Y. Y. Song and Y. Lu , title =. Shanghai Archives of Psychiatry , volume =. 2015 , month = apr, doi =
2015
-
[3]
Remote Sensing , volume =
Man, Qixia and Dong, Pinliang and Yang, Xinming and Wu, Quanyuan and Han, Rongqing , title =. Remote Sensing , volume =. 2020 , number =
2020
-
[4]
Open Geosciences , doi =
Individual tree detection using UAV-lidar and UAV-SfM data: A tutorial for beginners , author =. Open Geosciences , doi =. 2021 , lastchecked =
2021
-
[5]
and Kelly, Maggi , journal =
Li, Wenkai and Guo, Qinghua and Jakubowski, Marek K. and Kelly, Maggi , journal =. A New Method for Segmenting Individual Trees from the Lidar Point Cloud , volume =. 2012 , doi =
2012
-
[6]
Frontiers in Forests and Global Change , volume=
Precise aboveground biomass estimation of plantation forest trees using the novel allometric model and UAV-borne LiDAR , author=. Frontiers in Forests and Global Change , volume=. 2023 , publisher=
2023
-
[7]
Pollen production for 13 urban North American tree species: Allometric equations for tree trunk diameter and crown area , volume =
Katz, Daniel and Morris, Jonathan and Batterman, Stuart , year =. Pollen production for 13 urban North American tree species: Allometric equations for tree trunk diameter and crown area , volume =. Aerobiologia , doi =
-
[8]
Journal of Arboriculture 27: 169-180 , volume=
Predictive equations for dimensions and leaf area of coastal Southern California street trees , author=. Journal of Arboriculture 27: 169-180 , volume=. 2001 , url =
2001
Show all 12 references
-
[9]
Journal of Arboriculture
Equations for predicting diameter, height, crown width, and leaf area of San Joaquin Valley street trees , author=. Journal of Arboriculture. 27: 306-317 , volume=. 2001 , url =
2001
-
[10]
2024 , url =
Towards a digital twin of Bologna: features extraction and semantic classification using LiDAR , author =. 2024 , url =
2024
-
[11]
2016 , url =
Urban tree database and allometric equations , author =. 2016 , url =
2016
-
[12]
2016 , doi =
Urban tree database , author =. 2016 , doi =
2016
Reviewed July 30, 2026 · model on record in the stance chip above.
Discussion (0). Continue with ORCID to comment.