REVIEW 4 major objections 7 minor 59 references
Practical Quantum Topological Data Analysis with Applications to High-Dimensional Feature Extraction and Time Series Analysis
T0 review · 4 major / 7 minor · reviewed 2026-07-30 · grok-4.5
Pith's one-line read Low-order spectral moments of the combinatorial Laplacian can stand in for high-dimensional Betti numbers, letting near-term quantum circuits extract topological features that improve real time-series tasks.
desk verdict Solid packaging of moment-based QTDA plus real hardware, but the trace–Betti story is regime-conditioned and the apps are still thin. read the letter →
The pith
A machine-rendered reading of the paper's core claim, the machinery that carries it, and where it could break.
The reading
What carries the argument
The relative (normalized) trace of the combinatorial Laplacian, tr[Δ_k^Γ] = (1/N_k) Tr[Δ_k^Γ], estimated by averaging ⟨ℓ|Δ_k^Γ|ℓ⟩ over random-phase Dicke states after projecting into the simplicial complex; this first-moment observable is the proxy that carries the topological signal.
What would settle it
On application-scale complexes (for example denser fMRI ROI graphs or larger financial embeddings), measure relative trace and exact β_{k-1} in matched N_k bins: if the correlation collapses, or if replacing higher-homology features with noise no longer hurts classifier or crash-indicator performance, the central claim fails.
Extended reading notes
Core claim
Low-order spectral moments of the combinatorial Laplacian, above all the normalized relative trace, remain strongly correlated with high-dimensional Betti numbers even when the relative Betti number is small. That correlation lets a moment-based quantum algorithm extract topological features useful for downstream analysis without exact or high-precision Betti estimation, and the authors show those higher-order features improve two time-series applications while demonstrating the circuits on trapped-ion hardware.
Load-bearing premise
The observed correlation between relative trace and Betti number, after binning on clique density and often at selected edge densities, must still hold on the large structured complexes where classical methods become prohibitive, and a fixed-precision proxy must be enough for the downstream predictors.
Editorial extensions
If this is right
- Near-term quantum devices can target Laplacian moments instead of full persistent homology and still feed useful features into classical ML pipelines.
- Higher-order homologies (H2–H4 and beyond) become practical inputs for fMRI disease classification and financial early-warning indicators.
- Quantum-classical crossover for these features is projected at tens to hundreds of nodes at high edge density, with TTS from hours to days under stated gate-speed assumptions.
- Hardware with mid-circuit measurement can already resolve relative-trace differences that track distinct Betti numbers on graphs up to 16 nodes.
Reading between the lines
- If the correlation is stable under mild graph noise, the same moment circuits could serve as regularizers or fingerprints inside larger hybrid quantum-classical models without ever reporting Betti numbers.
- The edge-density dependence of the correlation suggests a practical filter: only complexes near the high-correlation ζ_2 bands need quantum evaluation, shrinking the workload further.
- Extending the same proxy to time-varying filtrations could turn crash or disease signals into streaming topological scores rather than batch persistence diagrams.
Editorial analysis
A structured set of objections, weighed in public.
Referee Report
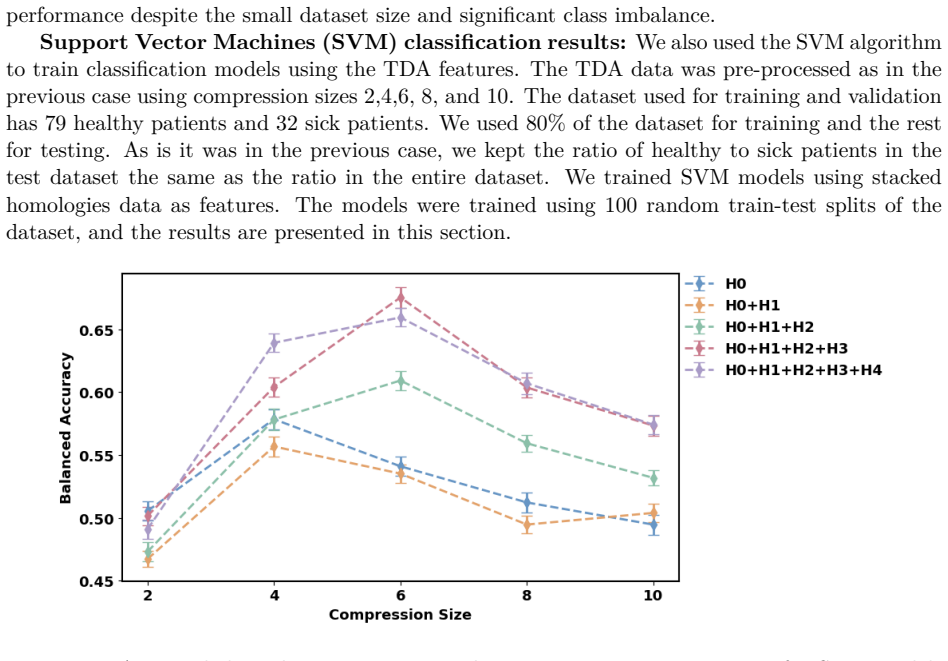
Summary. The manuscript reframes quantum topological data analysis as near-term feature extraction: instead of high-precision Betti-number estimation, it proposes measuring low-order spectral moments of the combinatorial Laplacian (especially the normalized relative trace tr[Δ_k^Γ]) as proxies for high-dimensional topology. Classically, it argues that H2–H4 features improve (i) Alzheimer’s vs healthy classification on a reduced OASIS fMRI subset and (ii) early-warning signals in multi-index financial time series. Algorithmically, it gives NISQ circuit constructions (Dicke preparation, complement-edge projection, Trotterized boundary operator), resource and shot-count estimates, quantum–classical TTS crossovers under a 10 μs two-qubit-gate assumption, and trapped-ion experiments on N=8 (β1) and N=16 (β3) graphs that resolve relative-trace differences consistent with exact Betti labels within fixed-(N,ζ2,ζk) slices.
Significance. If the proxy claim holds in the regimes that matter for applications, the paper meaningfully widens the practical scope of quantum TDA beyond the narrow large-relative-Betti setting emphasized in prior complexity analyses. Strengths include: concrete classical baselines for giotto-ph TTS/memory scaling (§2.2); an explicit moment-based circuit and resource formula (§4.1); honest discussion of Simpson’s paradox and sign flips in the trace–Betti correlation (Figs. 17–18); and a hardware demonstration that quantitatively compares a measured Laplacian observable to exact Betti information (§4.5, Fig. 24)—to the authors’ knowledge a first. The dual application–algorithm framing is a useful contribution to the quantum-applications literature even if some claims need tightening.
major comments (4)
- [§4.2, Figs. 17–19] §4.2 and Figs. 17–19: The central algorithmic claim—that fixed-precision relative trace remains strongly correlated with β_{k−1} even when β_{k−1}/N_k is small—is supported only after restricting to selected edge densities (where Corr peaks) and then binning by clique count N_k. Outside those bins the unconditional correlation is weaker and the sign can flip (authors note Simpson’s paradox). Downstream claims and crossovers treat a single fixed-ε moment as a usable topological feature without that conditioning. Please quantify unconditional Corr(tr,β) and Corr under the natural filtration/edge-density measure of the fMRI and finance pipelines, or state clearly that the proxy is only validated inside same-(ζ2,N_k) slices and revise Abstract/§4.3 language accordingly.
- [§3.1.2, §3.2.2, §4] §3 vs §4 disconnect: Application results use classical persistent-homology summaries (ROI PD distance matrices; L2 norms of birth–death diagrams over full filtrations, H1–H4). The quantum algorithm estimates low-order moments of Δ_k^Γ at fixed filtration/edge density. No experiment shows that replacing PH features by relative-trace (or low-order moment) features preserves the reported classification gains or crash-indicator lead. Either add a classical ablation that trains the same NN/SVM and finance indicators on moment/trace features alone, or narrow the claim from “quantum TDA establishes practical feature extraction for these tasks” to “higher-order PH is useful, and moments correlate with Betti in restricted ensembles.”
- [§4.3, Figs. 20–21] §4.3, Figs. 20–21: Quantum–classical TTS crossovers compare classical exact (persistent) Betti computation to quantum estimation of a correlated first-moment proxy under optimistic 10 μs serialized two-qubit gates. The manuscript acknowledges the comparison is imperfect, but the plots and shaded “advantage” regions still read as drop-in replacements. Please either (i) benchmark classical cost of estimating the same relative-trace/moments (e.g. stochastic Lanczos/Hutchinson on sparse Δ) against the quantum circuit, or (ii) reframe crossovers as order-of-magnitude guidance and remove language that equates moment estimation with Betti TTS.
- [§4.5, Fig. 24] §4.5, Fig. 24: Hardware runs distinguish two hand-chosen graphs at the extremes of the tr-vs-β cloud within a fixed (N,ζ2,ζk) slice. That supports resolvability of A=tr[Δ] under noise for those instances, but does not yet show reliable ranking or classification across a random draw from the slice, nor transfer to application graphs. A modest expansion—more graphs per slice, reported error bars vs shot budget, and at least one filtration-derived graph from §3—would better anchor the “practical pathway” claim.
minor comments (7)
- [§3.1, Table 1] Table 1 and surrounding text correctly caveat non-comparability of accuracies across studies, but the main text still leans on ∼74% vs literature ∼81–86%. Soften residual comparative phrasing; the within-pipeline H0→H4 lift is the relevant result.
- [§3.1.2] Duplicate “Overall, these results provide preliminary evidence…” paragraphs appear back-to-back near the end of §3.1.2; remove the repeated block.
- [§3.2.2, Eq. (16)] Eq. (16) writes L2 = ∑_i |λ_i(d_i)−d_i|^2; notation for birth/death is nonstandard (λ_i usually eigenvalues). Clarify persistence-pair notation.
- [§3.2, Fig. 13] Fig. 13 caption says “17 stocks” while text says “17 different indexes”; keep terminology consistent.
- [passim] Typos: “neuroedegenerative” (Intro), “simplical” (multiple), “T opological F eature” (section title spacing), “‹In Fig. 23” (stray character in §4.5).
- [§4.1] Resource formula (19) and CNOT count (24): define ζ_k scaling exponents a,b in the main text when first used, and state Trotter error target tied to the fixed ε≈0.1 used for correlation.
- [front matter] arXiv ID/date in the header (2607.27206, Jul 2026) looks placeholder-like relative to citation years; verify metadata before journal submission.
Circularity Check
No derivation circularity: trace–Betti link is empirical correlation of independently computed quantities, not a fit or definition restated as prediction.
full rationale
The paper’s load-bearing algorithmic claim is that low-order Laplacian moments (especially the normalized relative trace tr[Δ_k^Γ]) correlate with β_{k−1} even when β_{k−1}/N_k is small, so fixed-precision moment circuits can serve as topological features. That claim is supported by computing both sides independently on the same graphs (exact classical Betti and exact/estimated relative trace on ER ensembles and fMRI-derived complexes; hardware runs compared to exact classical values). dim(ker Δ)=β is standard algebraic topology, not a self-definition of the trace. Applications (§3) use classical persistent-homology features for classification and crash indicators; they do not feed a fitted proxy back as a ‘prediction.’ Circuit resources and TTS crossovers are engineering estimates, not uniqueness theorems or self-citation chains that force the result. Regime choice (edge density, N_k binning) affects how strong the reported correlation is and is a generalization/correctness concern, but it is not circularity under the defined patterns: nothing reduces by construction to its own fitted input or to an author-only uniqueness claim. Honest finding: no significant circularity.
Assumptions & free parameters
free parameters (6)
- Trotter steps T and evolution scale θ (or t0) =
T ~ O(√N); experiments use T=5–10
- Trace estimation shots: M random phase vectors and shots per vector =
M~100 (ε~0.1); sim 500×500
- Edge-density / N_k binning regime for correlation =
e.g. fMRI p=0.6; high ζ_2 ER slices
- Assumed two-qubit gate time 10 μs for TTS crossover =
10 μs/gate
- fMRI feature compression size and NN/SVM hyperparameters =
NN 12×12; SVM best at compression 6
- Finance embedding parameters (D, τ, window, index set) =
D=10, τ=2, window=100d, 17 indexes
assumptions (5)
- standard math dim(ker(Δ_k^Γ)) = β_{k-1} for the combinatorial Laplacian of a simplicial complex
- domain assumption Vietoris–Rips clique complexes from pairwise distances (and Takens delay embeddings) faithfully carry task-relevant topology of fMRI ROI series and multi-asset returns
- ad hoc to paper A fixed additive-precision estimate of low-order moments (especially p=1 relative trace) is a sufficient statistic for downstream prediction in place of exact or persistent Betti numbers
- domain assumption For ER-like and application graphs of interest, ζ_k decays roughly as a power of ζ_2 but remains large enough at high edge density for shot counts to be practical at moderate k
- domain assumption Classical high-dimensional PH time-to-solution continues to scale ~ a(N choose d)/d with memory ~ (N choose d) as in giotto-ph benchmarks, independent of edge density
invented entities (1)
-
Relative-trace / low-order Laplacian-moment proxy for high-d Betti features
Cite this review
Pith. "Pith review of Practical Quantum Topological Data Analysis with Applications to High-Dimensional Feature Extraction and Time Series Analysis." pith.science (2026). https://pith.science/paper/YRUU3WXQ
@misc{pith2026260727206,
  author       = {Pith},
  title        = {Pith review of: Practical Quantum Topological Data Analysis with Applications to High-Dimensional Feature Extraction and Time Series Analysis},
  year         = {2026},
  howpublished = {\url{https://pith.science/paper/YRUU3WXQ}},
  note         = {Machine review of arXiv:2607.27206}
}
read the original abstract
Topological data analysis (TDA) provides a powerful framework for extracting information about the shape of complex, unstructured data, but the classical cost of computing high dimensional topological features limits its application. Quantum algorithms for TDA offer a route around this bottleneck, yet existing approaches typically focus on exact or high precision Betti number estimation, making the regime for practical quantum advantage appear narrow. Here, we instead frame quantum TDA as a feature-extraction method for downstream data analysis by extracting low-order spectral information from the combinatorial Laplacian as a proxy for high-dimensional topology. We support this perspective from both the application and algorithmic sides. First, we show that higher-order TDA features improve predictive performance in two time-series applications: functional MRI analysis for neurodegenerative disease classification and financial time-series analysis for identifying market instability. Second, we develop a moment-based quantum algorithm and show that low-order moments, including the relative trace, are strongly correlated with high-dimensional Betti information, even when the relative Betti number is small. Finally, we present circuit constructions, resource estimates, quantum-classical crossover projections, and experimental results from a Barium development system similar to the forthcoming IonQ Tempo line, extracting Laplacian-derived observables from graph instances and quantitatively comparing them with exact Betti information. Together, these results establish quantum TDA as a practical approach for extracting topological features from classically challenging data
Figures


Figures from the paper (21 more)




Reference graph
Works this paper leans on
-
[1]
What are higher-order networks? SIAM Review , 65(3):686–731, 2023
Christian Bick, Elizabeth Gross, Heather A Harrington, and Michael T Schaub. What are higher-order networks? SIAM Review , 65(3):686–731, 2023
2023
-
[2]
The importance of the whole: topological data analysis for the network neuroscientist
Ann E Sizemore, Jennifer E Phillips-Cremins, Robert Ghrist, and Danielle S Bassett. The importance of the whole: topological data analysis for the network neuroscientist. Network Neuroscience, 3(3):656–673, 2019
2019
-
[3]
Debanjali Bhattacharya, Rajneet Kaur, Ninad Aithal, Neelam Sinha, Issac, and Thomas Gre- gor. Persistent homology for MCI classification: A comparative analysis between graph and Vietoris-Rips filtrations. arXiv:2410.22681, 2024
arXiv 2024
-
[4]
An introduction to topological data analysis: funda- mental and practical aspects for data scientists
Frédéric Chazal and Bertrand Michel. An introduction to topological data analysis: funda- mental and practical aspects for data scientists. Frontiers in artificial intelligence , 4:667963, 2021
2021
-
[5]
Topological data analysis in biomedicine: A review
Yara Skaf and Reinhard Laubenbacher. Topological data analysis in biomedicine: A review. Journal of Biomedical Informatics , 130:104082, 2022
2022
-
[6]
Extracting insights from the shape of complex data using topology
Pek Y Lum, Gurjeet Singh, Alan Lehman, Tigran Ishkanov, Mikael Vejdemo-Johansson, Muthu Alagappan, John Carlsson, and Gunnar Carlsson. Extracting insights from the shape of complex data using topology. Scientific reports, 3(1):1236, 2013
2013
-
[7]
Topological recognition of critical transitions in time series of cryptocurrencies, 2018
Marian Gidea, Daniel Goldsmith, Yuri Katz, Pablo Roldan, and Yonah Shmalo. Topological recognition of critical transitions in time series of cryptocurrencies, 2018
2018
-
[8]
Topological data analysis of financial time series: Landscapes of crashes
Marian Gidea and Yuri Katz. Topological data analysis of financial time series: Landscapes of crashes. Physica A: Statistical mechanics and its applications , 491:820–834, 2018
2018
Show all 59 references
-
[9]
Bow echo alarm system using topo- logical data analysis
Hélène Canot, Philippe Durand, and Emmanuel Frénod. Bow echo alarm system using topo- logical data analysis. Applied Mathematics for Modern Challenges , 3(0):44–63, 2025
2025
-
[10]
Quantum algorithms for topological and geometric analysis of data
Seth Lloyd, Silvano Garnerone, and Paolo Zanardi. Quantum algorithms for topological and geometric analysis of data. Nature communications, 7(1):10138, 2016
2016
-
[11]
Analyzing prospects for quantum advantage in topological data analysis
Dominic W Berry, Yuan Su, Casper Gyurik, Robbie King, Joao Basso, Alexander Del Toro Barba, Abhishek Rajput, Nathan Wiebe, Vedran Dunjko, and Ryan Babbush. Analyzing prospects for quantum advantage in topological data analysis. PRX Quantum , 5(1):010319, 2024
2024
-
[12]
Complexity-theoretic limitations on quantum algo- rithms for topological data analysis
Alexander Schmidhuber and Seth Lloyd. Complexity-theoretic limitations on quantum algo- rithms for topological data analysis. PRX Quantum , 4(4):040349, 2023
2023
-
[13]
Topological data analysis on noisy quantum computers
Ismail Yunus Akhalwaya, Shashanka Ubaru, Kenneth L Clarkson, Mark S Squillante, Vishnu Jejjala, Yang-Hui He, Kugendran Naidoo, Vasileios Kalantzis, and Lior Horesh. Topological data analysis on noisy quantum computers. In The Twelfth International Conference on Learning Repres...
2023
-
[14]
The grand challenge of quantum applications
Ryan Babbush, Robbie King, Sergio Boixo, William Huggins, Tanuj Khattar, Guang Hao Low, Jarrod R McClean, Thomas O’Brien, and Nicholas C Rubin. The grand challenge of quantum applications. arXiv preprint arXiv:2511.09124 , 2025
2025
-
[15]
A roadmap for the computation of persistent homology
Nina Otter, Mason A Porter, Ulrike Tillmann, Peter Grindrod, and Heather A Harrington. A roadmap for the computation of persistent homology. EPJ Data Science , 6:1–38, 2017
2017
-
[16]
giotto-ph: A python library for high-performance computation of persistent homology of Vietoris-Rips filtrations, 2021
Julián Burella Pérez, Sydney Hauke, Umberto Lupo, Matteo Caorsi, and Alberto Dassatti. giotto-ph: A python library for high-performance computation of persistent homology of Vietoris-Rips filtrations, 2021
2021
-
[17]
Ripser: efficient computation of Vietoris–Rips persistence barcodes
Ulrich Bauer. Ripser: efficient computation of Vietoris–Rips persistence barcodes. Journal of Applied and Computational Topology , 5(3):391–423, June 2021
2021
-
[18]
GUDHI User and Reference Manual
The GUDHI Project. GUDHI User and Reference Manual . GUDHI Editorial Board, 2015
2015
-
[19]
https://www.humanconnectome.org/
Connectome Coordination Facility. https://www.humanconnectome.org/. The Human Con- nectome Project and Connectome Coordination Facility are funded by the National Institutes of Health
-
[20]
The human connectome project: a data acquisition perspective
David C Van Essen, Kamil Ugurbil, Edward Auerbach, Deanna Barch, Timothy EJ Behrens, Richard Bucholz, Acer Chang, Liyong Chen, Maurizio Corbetta, Sandra W Curtiss, et al. The human connectome project: a data acquisition perspective. Neuroimage, 62(4):2222–2231, 2012
2012
-
[21]
Glasser, Timothy S
Matthew F. Glasser, Timothy S. Coalson, Emma C. Robinson, Carl D. Hacker, John Harwell, Essa Yacoub, Kamil Ugurbil, Jesper Andersson, Christian F. Beckmann, Mark Jenkinson, Stephen M. Smith, and David C. Van Essen. A multi-modal parcellation of human cerebral cortex. Nature, 5...
2016
-
[22]
Glasser, Michael P
Jennifer Stine Elam, Matthew F. Glasser, Michael P. Harms, Stamatios N. Sotiropoulos, Jes- per L.R. Andersson, Gregory C. Burgess, Sandra W. Curtiss, Robert Oostenveld, Linda J. Larson-Prior, Jan-Mathijs Schoffelen, Michael R. Hodge, Eileen A. Cler, Daniel M. Marcus, Deanna M....
2021
-
[23]
Modern methods for interrogating the human connectome
Lowe MJ, Sakaie KE, Beall EB, Calhoun VD, Bridwell DA, Rubinov M, and Rao SM. Modern methods for interrogating the human connectome. Int Neuropsychol Soc. , 2016
2016
-
[24]
Gordon, Timothy O
Evan M. Gordon, Timothy O. Laumann, Adrian W. Gilmore, Dillan J. Newbold, Deanna J. Greene, Jeffrey J. Berg, Mario Ortega, Catherine Hoyt-Drazen, Caterina Gratton, Haoxin Sun, Jacqueline M. Hampton, Rebecca S. Coalson, Annie L. Nguyen, Kathleen B. McDermott, Joshua S. Shimony,...
2017
-
[25]
Assessing functional connectivity in the human brain by fMRI
Baxter P Rogers, Victoria L Morgan, Allen T Newton, and John C Gore. Assessing functional connectivity in the human brain by fMRI. Magnetic resonance imaging , 25(10):1347–1357, 2007. 40
2007
-
[26]
Topological learning and its applica- tion to multimodal brain network integration
Tananun Songdechakraiwut, Li Shen, and Moo Chung. Topological learning and its applica- tion to multimodal brain network integration. In International Conference on Medical Image Computing and Computer-Assisted Intervention , pages 166–176. Springer, 2021
2021
-
[27]
Complex brain networks: graph theoretical analysis of structural and functional systems
Ed Bullmore and Olaf Sporns. Complex brain networks: graph theoretical analysis of structural and functional systems. Nature Reviews Neuroscience , 2009
2009
-
[28]
Topo- logical data analysis reveals robust alterations in the whole-brain and frontal lobe functional connectomes in attention-deficit/hyperactivity disorder
Zeus Gracia-Tabuenca, Juan Carlos Díaz-Patiño, Isaac Arelio, and Sarael Alcauter. Topo- logical data analysis reveals robust alterations in the whole-brain and frontal lobe functional connectomes in attention-deficit/hyperactivity disorder. bioRxiv, 2019
2019
-
[29]
Graph theory-based brain con- nectivity for automatic classification of multiple sclerosis clinical courses
Gabriel Kocevar, Claudio Stamile, Salem Hannoun, François Cotton, Sandra Vukusic, Françoise Durand-Dubief, and Dominique Sappey-Marinier. Graph theory-based brain con- nectivity for automatic classification of multiple sclerosis clinical courses. Frontiers in Neuro- science, V...
2016
-
[30]
Complex network measures of brain connectivity: uses and interpretations
Mikail Rubinov and Olaf Sporns. Complex network measures of brain connectivity: uses and interpretations. Neuroimage, 52(3):1059–1069, 2010
2010
-
[31]
Graph theory methods: applications in brain networks
Olaf Sporns. Graph theory methods: applications in brain networks. Dialogues in clinical neuroscience, 20(2):111–121, 2018
2018
-
[32]
Networks beyond pairwise interactions: Struc- ture and dynamics
Federico Battiston, Giulia Cencetti, Iacopo Iacopini, Vito Latora, Maxime Lucas, Alice Pata- nia, Jean-Gabriel Young, and Giovanni Petri. Networks beyond pairwise interactions: Struc- ture and dynamics. Physics reports, 874:1–92, 2020
2020
-
[33]
A hands-on tutorial on network and topological neuroscience
Eduarda Gervini Zampieri Centeno, Giulia Moreni, Chris Vriend, Linda Douw, and Fernando Antônio Nóbrega Santos. A hands-on tutorial on network and topological neuroscience. Brain Structure and Function , 227(3):741–762, 2022
2022
-
[34]
Alarjani and Badar A
Maitha S. Alarjani and Badar A. Almarri. Brain functional connectivity analysis of fMRI-based Alzheimer’s disease data. Frontiers in Medicine , Volume 12 - 2025, 2025
2025
-
[35]
Alzheimer’s disease neuroimaging initiative (ADNI) clinical characterization
Ronald Carl Petersen, Paul S Aisen, Laurel A Beckett, Michael C Donohue, Anthony Collins Gamst, Danielle J Harvey, Clifford R Jack Jr, William J Jagust, Leslie M Shaw, Arthur W Toga, et al. Alzheimer’s disease neuroimaging initiative (ADNI) clinical characterization. Neurology...
2010
-
[36]
Rolls, Chu-Chung Huang, Ching-Po Lin, Jianfeng Feng, and Marc Joliot
Edmund T. Rolls, Chu-Chung Huang, Ching-Po Lin, Jianfeng Feng, and Marc Joliot. Auto- mated anatomical labelling atlas 3. NeuroImage, 206:116189, 2020
2020
-
[37]
Nilearn contributors. Nilearn
-
[38]
A few thoughts on brain rois
Tianming Liu. A few thoughts on brain rois. Brain imaging and behavior , 5(3):189–202, 2011
2011
-
[39]
Region of interest analysis for fMRI
Russell A Poldrack. Region of interest analysis for fMRI. Social cognitive and affective neuro- science, 2(1):67–70, 2007
2007
-
[40]
giotto-tda: A topological data analysis toolkit for machine learning and data exploration, 2020
Guillaume Tauzin, Umberto Lupo, Lewis Tunstall, Julian Burella Pérez, Matteo Caorsi, Ani- bal Medina-Mardones, Alberto Dassatti, and Kathryn Hess. giotto-tda: A topological data analysis toolkit for machine learning and data exploration, 2020. 41
2020
-
[41]
Nash, Roberto Vincis, Martin Bauer, Richard Bertram, and Tom Needham
Cagatay Ayhan, Audrey N. Nash, Roberto Vincis, Martin Bauer, Richard Bertram, and Tom Needham. A persistent homology pipeline for the analysis of neural spike train data, 2025
2025
-
[42]
Topological features of spike trains in recurrent spiking neural networks that are trained to generate spatiotemporal patterns
Oleg Maslennikov, Matjaž Perc, and Vladimir Nekorkin. Topological features of spike trains in recurrent spiking neural networks that are trained to generate spatiotemporal patterns. Frontiers in Computational Neuroscience , Volume 18 - 2024, 2024
2024
-
[43]
Building portfolios based on machine learning predictions
Tomasz Kaczmarek and Katarzyna Perez. Building portfolios based on machine learning predictions. Economic Research-Ekonomska Istraživanja, 35(1):19–37, 2022
2022
-
[44]
Enhancing portfolio management using artificial intelligence: literature review
Kristina Sutiene, Peter Schwendner, Ciprian Sipos, Luis Lorenzo, Miroslav Mirchev, Petre Lameski, Audrius Kabasinskas, Chemseddine Tidjani, Belma Ozturkkal, and Jurgita Cernevi- ciene. Enhancing portfolio management using artificial intelligence: literature review. Frontiers i...
2024
-
[45]
Statistical and machine learning forecasting methods: Concerns and ways forward
Spyros Makridakis, Evangelos Spiliotis, and Vassilios Assimakopoulos. Statistical and machine learning forecasting methods: Concerns and ways forward. PLOS ONE , 13(3):1–26, 03 2018
2018
-
[46]
Complexity, big data and financial stability
Charilaos Mertzanis. Complexity, big data and financial stability. Quantitative Finance and Economics, 2(3):637–660, 2018
2018
-
[47]
Financial reporting complexity, investor sentiment, and stock prices
Min-Hsi Chung and Ya-Kai Chang. Financial reporting complexity, investor sentiment, and stock prices. Finance Research Letters, 62:105026, 2024
2024
-
[48]
Extreme Events in Finance: A Handbook of Extreme Value Theory and its Applications
Francois Longin. Extreme Events in Finance: A Handbook of Extreme Value Theory and its Applications. Wiley, 2016
2016
-
[49]
When to be discrete: The importance of time formulation in the modeling of extreme events in finance
Katarzyna Bień-Barkowska and Rodrigo Herrera. When to be discrete: The importance of time formulation in the modeling of extreme events in finance. International Journal of Forecasting, 42(1):61–84, 2026
2026
-
[50]
Extreme events, economic uncertainty and speculation on occurrences of price bubbles in crude oil futures
Chiu-Lan Chang. Extreme events, economic uncertainty and speculation on occurrences of price bubbles in crude oil futures. Energy Economics, 130:107318, 2024
2024
-
[51]
Statistics of extreme events in risk management: The impact of the subprime and global financial crisis on the German stock market
Rodrigo Herrera and Bernhard Schipp. Statistics of extreme events in risk management: The impact of the subprime and global financial crisis on the German stock market. The North American Journal of Economics and Finance , 29(C):218–238, None 2014
2014
-
[52]
Enhancing financial time series forecasting through topological data analysis
Luiz Carlos de Jesus, Francisco Fernández-Navarro, and Mariano Carbonero-Ruz. Enhancing financial time series forecasting through topological data analysis. Neural Computing and Applications, 2025
2025
-
[53]
Topological data analysis in investment decisions
Anubha Goel, Puneet Pasricha, and Aparna Mehra. Topological data analysis in investment decisions. Expert Systems with Applications , 147:113222, 2020
2020
-
[54]
Nurujjaman, and Sushovan Majhi
Anish Rai, Buddha Nath Sharma, Salam Rabindrajit Luwang, Md. Nurujjaman, and Sushovan Majhi. Identifying extreme events in the stock market: A topological data analysis. Chaos: An Interdisciplinary Journal of Nonlinear Science , 34(10):103106, 10 2024
2024
-
[55]
Finding cliques by quantum adiabatic evolution
Andrew M Childs, Edward Farhi, Jeffrey Goldstone, and Sam Gutmann. Finding cliques by quantum adiabatic evolution. arXiv: 0012104 , 2000. 42
2000
-
[56]
Short-depth circuits for Dicke state preparation
Andreas Bärtschi and Stephan Eidenbenz. Short-depth circuits for Dicke state preparation. In 2022 IEEE International Conference on Quantum Computing and Engineering (QCE) , pages 87–96. IEEE, 2022
2022
-
[57]
Deterministic preparation of Dicke states
Andreas Bärtschi and Stephan Eidenbenz. Deterministic preparation of Dicke states. In International Symposium on Fundamentals of Computation Theory , pages 126–139. Springer, 2019
2019
-
[58]
High-speed and high-connectivity two-qubit gates in long chains of trapped ions
Isabelle Savill-Brown, Joseph J Hope, Alexander K Ratcliffe, Varun D Vaidya, Haonan Liu, Simon A Haine, C Ricardo Viteri, and Zain Mehdi. High-speed and high-connectivity two-qubit gates in long chains of trapped ions. Physical Review Letters , 136(19):190802, 2026
2026
-
[59]
High-fidelity laser-free universal control of trapped ion qubits
Raghavendra Srinivas, Shaun C Burd, Hannah M Knaack, Robert T Sutherland, Alex Kwiatkowski, Scott Glancy, Emanuel Knill, David J Wineland, Dietrich Leibfried, Andrew C Wilson, et al. High-fidelity laser-free universal control of trapped ion qubits. Nature, 597(7875):209–213, 2021. 43
2021
Reviewed July 30, 2026 · model on record in the stance chip above.
Discussion (0). Continue with ORCID to comment.