REVIEW 3 major objections 6 minor 59 references
Measuring Distortion in the Empty Regions of Dimensionality Reduction Scatterplots with the Gap Index
T0 review · 3 major / 6 minor · reviewed 2026-07-31 · grok-4.5
Pith's one-line read Empty gaps in dimensionality-reduction scatterplots carry the visual story, and common quality scores miss their distortion; the Gap Index measures it directly.
desk verdict Solid, usable DR quality metric that actually moves when empty-space artifacts appear; the relative-area proxy is a real limit but not a hidden one. read the letter →
The pith
A machine-rendered reading of the paper's core claim, the machinery that carries it, and where it could break.
The reading
What carries the argument
The Gap Index: Delaunay triangulation of the 2D points, per-triangle deformation defined as the normalized difference of relative areas (Eq. 2), then absolute weighted average into one scalar or direct coloring of the triangles.
What would settle it
Construct a pair of layouts whose empty regions look dramatically different to viewers yet keep identical relative triangle areas (or vice versa); if human judgments of distortion then diverge from the Gap Index while matching ordinary stress or trustworthiness, the central claim fails.
Extended reading notes
Core claim
Standard DR quality metrics fail to flag visually salient distortions that live in the empty regions of a 2D layout; the Gap Index captures those distortions by comparing relative areas of Delaunay triangles in the projection against the corresponding high-dimensional triples, yielding both a global scalar and a per-region stretch/compression map that popular metrics miss.
Load-bearing premise
That how much relative area each empty triangle gains or loses is a good enough stand-in for the visual reliability of the gaps people actually notice.
Editorial extensions
If this is right
- Analysts can reject or re-parameterize projections whose empty gaps are artifacts even when stress and trustworthiness look excellent.
- Local stretch/compression overlays become a routine diagnostic layer on scatterplots without needing per-point scores or Voronoi fills.
- Large datasets (hundreds of thousands of points) become practical to audit because the metric runs in O(N log N) time.
- Users of local methods such as t-SNE gain an explicit warning when inter-cluster space has been inflated or collapsed.
Reading between the lines
- Projection algorithms could be redesigned to penalize Gap-Index deformation directly, producing layouts whose blanks are more trustworthy by construction.
- The same triangle-area idea might serve as a perceptual prior inside automated view-selection or animation tools that currently optimize only point-wise criteria.
- When high-dimensional distances concentrate, switching the area formula to a more robust metric (e.g., L1) could keep the index informative where Euclidean areas become uniform.
Editorial analysis
A structured set of objections, weighed in public.
Referee Report
Summary. The paper proposes the Gap Index (GI), a quality metric for 2D dimensionality-reduction scatterplots that quantifies stretch and compression in empty layout regions. It builds a Delaunay triangulation of the 2D points, compares each triangle’s relative area to the triangle formed by the same triple in high-D (via edge lengths and Heron’s formula), defines a per-triangle deformation in [-1,1], and aggregates with max-relative-area weights into a scale-invariant scalar; the same field can be overlaid (optionally blurred) on the scatterplot. Controlled synthetics (plane, sphere with anchor stretch Δ, cube vs t-SNE perplexity), comparisons to stress, trustworthiness/continuity and steadiness/cohesiveness, scalability to 250k points, a jitter stability check, and an MNIST-CNN embedding use case are used to argue that GI tracks visually salient empty-space artifacts that leave standard metrics nearly flat, while remaining O(N log N) and interpretable.
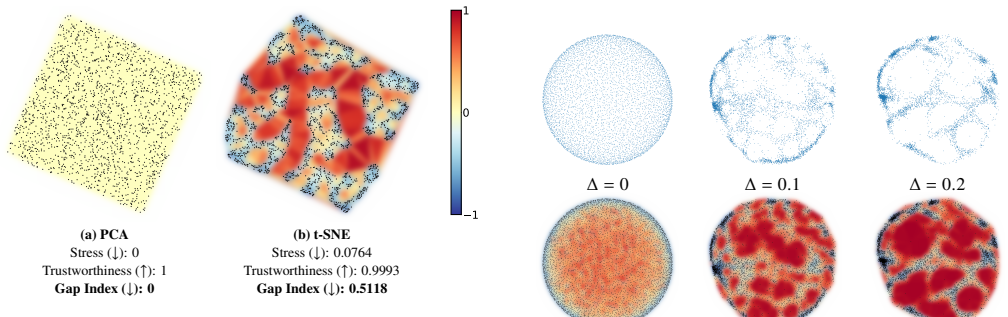
Significance. If the central claim holds, GI fills a genuine methodological gap: empty regions define clusters and other pre-attentive structure in DR scatterplots, yet almost all popular unsupervised metrics are point-, neighborhood-, or cluster-based and can miss high-impact gap artifacts (Figs. 2, 6–8). Strengths that should count in the assessment include an explicit, reproducible definition (§3), open-source code, clean controlled contrasts that separate GI from stress/trustworthiness/S&C, honest discussion of failure modes (area-preserving warps, distance concentration, raw vs relative areas), and practical O(N log N) scalability with a usable local visualization that colors empty space itself rather than Voronoi cells of point scores. Even as a geometric surrogate rather than a full model of human gap perception, that package is a useful addition to the DR quality-metric toolkit.
major comments (3)
- [§3.3 Eqs. (1)–(2); §5 Fig. 12a; Abstract] The load-bearing link from geometry to “visual” empty-region distortion is the relative-area deformation (Eqs. 1–2, §3.3). By construction it is blind to area-preserving shape changes (explicitly shown in Fig. 12a and §5), and under distance concentration the paper notes that high-D triangle areas can become similar so that GI correlates with 2D density (§3.3). The Abstract and §1/§4.2 nevertheless claim sensitivity to “small structural deformations that have high visual impact” and that GI “captures visual distortion.” Those claims need either (i) tighter scoping to “relative-area stretch/compression of Delaunay gaps” with the Fig. 12a class of failures stated up front, or (ii) additional evidence (e.g., a small perception study or a systematic comparison against perimeter/angle-based deformations on the same synthetic series) that the quantity tracked is the one analysts use when judgi
- [§4.2 Fig. 7] The sphere-Δ protocol (§4.2, Fig. 7) is the strongest demonstration that GI alone rises while stress, trustworthiness/continuity and steadiness/cohesiveness stay flat. The distortion is an iterative displacement of non-anchor points toward matching high-D distances to 50 anchors. That construction is useful but somewhat tailored to open gaps; it is unclear how representative it is of artifacts produced by standard DR objectives (t-SNE, UMAP, mMDS, etc.). Please either (a) justify why this family of warps is the right stress test for empty-region metrics, or (b) add at least one complementary distortion family (e.g., local cluster collapse, global anisotropic stretch, or real DR hyperparameter sweeps beyond cube perplexity) and report whether the same metric ranking holds. Without that, the “contrary to popular quality metrics” claim rests heavily on one synthetic mechanism plus the plane
- [§3.4 Eq. (4); §4.2] Aggregation and weighting are presented as modular (§3.4: w_i = max(A'(t_i), A'(t̂_i)), with alternatives w_i = A'(t_i) or A'(t̂_i)), but the main results report only the default. Because the scalar GI is what practitioners will compare across projections, the paper should show—at least on the plane, sphere-Δ, and cube-perplexity series—how much the ranking and the Δ/perplexity curves change under the two dual weights and under an unweighted mean. If the qualitative story is stable, say so with a short ablation; if not, the default choice needs a clearer task-level justification (veracity of visible gaps vs recovery of missing high-D gaps).
minor comments (6)
- [Figure 1] Fig. 1 caption and pipeline labels are clear; consider adding the equation numbers for deformation and aggregation on the figure itself so readers can map the schematic to §3 without flipping.
- [§4] Trustworthiness/continuity neighborhood size k and steadiness/cohesiveness HDBSCAN settings are not stated in the main text (only that ZADU was used). A short parameter table or appendix note would improve reproducibility of the comparative curves.
- [§3.3] In §3.3 the thin-triangle clip (e.g. 10^{-6}) and the convention D=0 when both areas are zero are reasonable but free parameters; list them explicitly with the defaults used in all reported runs.
- [§4.5 Fig. 10] Fig. 10 y-axes use scientific notation that is easy to misread (1e-2 / 1e-3); spell out the scale in the caption and state that layouts were scaled to [0,1]^2 before jitter.
- [§2] Related work on empty-space visualization (Sclow plots, ClustMe) is cited for motivation; a sentence contrasting GI (high-D-referenced distortion) with purely 2D empty-space descriptors would sharpen the novelty claim.
- [§1] Minor wording: “scale-normalized stress (from now on referred simply as “stress”)” appears early; keep that alias consistent in all figure captions (some already do).
Circularity Check
No significant circularity: GI is a newly defined geometric functional, then empirically contrasted with other metrics on controlled layouts.
full rationale
The Gap Index is introduced by explicit construction (Delaunay triangulation of the 2D layout; relative-area deformation of each triangle versus the same triple in high-D via Eqs. 1–2; max-area weighted aggregation in Eq. 4). That definition does not encode, fit, or presuppose the target claim that GI alone tracks high-visual-impact empty-region artifacts while stress, trustworthiness/continuity, and steadiness/cohesiveness stay flat. The empirical sections (§4.1–4.2, Figs. 2, 6–8) apply the fixed functional to synthetic and real projections and report numerical contrasts; nothing in those plots is a fitted parameter renamed as a prediction. Prior self-citations are ordinary and non-load-bearing: [41] is the authors’ short precursor whose ideas this paper extends, and [42] only motivates the Δ-stretch experimental protocol—the metric values themselves are recomputed independently. External lineage (Warnking et al., Aupetit) supplies the triangulation/distortion visualization idea; scale-invariance and scalar aggregation are stated extensions, not uniqueness theorems imported to forbid alternatives. Caveats in §5 (area-preserving warps invisible to GI; distance concentration) are honesty about the proxy’s scope, not circular reductions. The derivation chain is therefore self-contained against the circularity patterns in the rubric.
Assumptions & free parameters
free parameters (3)
- Gaussian blur σ for GI overlay =
examples σ ∈ {0,10,20,40}
- Thin-triangle area clip tolerance =
e.g. 10^{-6}
- Deformation and weight functional form
assumptions (5)
- domain assumption Delaunay triangulation of the 2D layout is an appropriate nonempty partition of visually relevant empty space (unique under deterministic cocircular tie-break, O(N log N)).
- ad hoc to paper Relative triangle areas (not raw areas or angles) capture the stretch/compression that matters for visual analysis and yield desirable scale invariance.
- domain assumption High-dimensional triple distances satisfy the triangle inequality so Heron area is real; non-Euclidean distances may be substituted when the DR method used them.
- domain assumption Empty gaps (Gestalt proximity) are first-class visual features whose fidelity should be measured separately from per-point neighborhood or full pairwise stress.
- standard math Standard facts of computational geometry: Delaunay properties, O(N) triangles, Cayley–Menger for higher-D simplices if extended.
invented entities (1)
-
Gap Index (GI) scalar and per-triangle deformation field
independent evidence
Cite this review
Pith. "Pith review of Measuring Distortion in the Empty Regions of Dimensionality Reduction Scatterplots with the Gap Index." pith.science (2026). https://pith.science/paper/L2CRWOWS
@misc{pith2026260728324,
  author       = {Pith},
  title        = {Pith review of: Measuring Distortion in the Empty Regions of Dimensionality Reduction Scatterplots with the Gap Index},
  year         = {2026},
  howpublished = {\url{https://pith.science/paper/L2CRWOWS}},
  note         = {Machine review of arXiv:2607.28324}
}
read the original abstract
Quality metrics play a crucial role in the proper use of dimensionality reduction projections for visual analysis of high-dimensional data. They quantify the degree of distortion of a projection compared to the high-dimensional data and provide a reliable indication of how confident users can be in the structures they see in the resulting layouts. However, most popular metrics focus on capturing direct relationships between points (e.g., distances or neighborhoods) while neglecting distortions in empty areas of the layout, even though these often compose visually relevant features of a 2D layout. In this paper, we introduce the Gap Index (GI), a quality metric for 2D projections that captures visual distortion by measuring spatial distortion in empty areas of a projection. It does so by decomposing the space into empty triangles, which are then compared to their high-dimensional counterparts to compute the deformation. This per-triangle deformation can be aggregated into a single scalar value or overlaid on a projection to visualize regional distortion patterns. Results show that, contrary to popular quality metrics, the GI is sensitive to small structural deformations that have high visual impact. It is also fast to compute and interpretable.
Figures


Figures from the paper (8 more)



Reference graph
Works this paper leans on
-
[1]
M. M. Abbas, M. Aupetit, M. Sedlmair, and H. Bensmail. Clustme: A visual quality measure for ranking monochrome scatterplots based on cluster patterns.Computer Graphics Forum, 38(3):225–236, 2019. doi: 10.1111/cgf.13684 1
-
[2]
C. C. Aggarwal, A. Hinneburg, and D. A. Keim. On the surprising behavior of distance metrics in high dimensional space. InInternational conference on database theory, pp. 420–434. Springer, 2001. doi: 10. 1007/3-540-44503-X_27 4
2001
-
[3]
M. Aupetit. Visualizing distortions and recovering topology in continuous projection techniques.Neurocomputing, 70(7–9):1304–1330, Mar. 2007. doi: 10.1016/j.neucom.2006.11.018 3, 4, 9
-
[4]
M. Aupetit and M. Sedlmair. SepMe: 2002 new visual separation measures. In2016 IEEE Pacific Visualization Symposium (PacificVis), pp. 1–8, 2016. doi: 10.1109/PACIFICVIS.2016.7465244 2
arXiv 2002
-
[5]
M. De Berg, O. Cheong, M. Van Kreveld, and M. Overmars.Computa- tional Geometry: Algorithms and Applications, chap. 9. Springer Berlin Heidelberg, Berlin, Heidelberg, 2008. doi: 10.1007/978-3-540-77974-2 3
-
[6]
D. P. Dobkin, H. Edelsbrunner, and M. H. Overmars. Searching for empty convex polygons. InProceedings of the Fourth Annual Symposium on Computational Geometry, SCG ’88, pp. 224–228. Association for Computing Machinery, New York, NY , USA, 1988. doi: 10.1145/73393. 73416 9
-
[7]
M. Espadoto, R. M. Martins, A. Kerren, N. S. T. Hirata, and A. C. Telea. Toward a quantitative survey of dimension reduction techniques.IEEE Transactions on Visualization and Computer Graphics, 27(3):2153–2173, Mar. 2021. doi: 10.1109/TVCG.2019.2944182 2, 5, 7
arXiv 2021
-
[8]
S. Fortune. V oronoi diagrams and delaunay triangulations. InHandbook of discrete and computational geometry, pp. 705–721. Chapman and Hall/CRC, 2017. doi: 10.1007/978-3-642-27848-8_507-1 3, 8
Show all 59 references
-
[9]
Geng, D.-C
X. Geng, D.-C. Zhan, and Z.-H. Zhou. Supervised nonlinear dimensional- ity reduction for visualization and classification.IEEE Transactions on Systems, Man and Cybernetics, Part B (Cybernetics), 35(6):1098–1107, Dec. 2005. doi: 10.1109/TSMCB.2005.850151 2
2005
-
[10]
Giesen, L
J. Giesen, L. Kühne, and P. Lucas. Sclow plots: Visualizing empty space. Computer Graphics Forum, 36(3):145–155, June 2017. doi: 10.1111/cgf. 13175 1
2017 doi
-
[11]
Hermann, A
M. Hermann, A. Greß, and R. Klein. Interactive exploration of large event datasets in high energy physics.J. WSCG, 17(1-3):41–48, 2009. 3
2009
-
[12]
Heulot, M
N. Heulot, M. Aupetit, and J.-D. Fekete. Proxilens: Interactive exploration of high-dimensional data using projections.EuroVis Workshop on Visual Analytics using Multidimensional Projections, p. 5 pages, 2013. doi: 10. 2312/PE.V AMP.V AMP2013.011-015 3
2013
-
[13]
Inaba, E
F. Inaba, E. Salles, and T. Rauber. Kernel sammon map. In2011 24th SIBGRAPI Conference on Graphics, Patterns and Images, pp. 329–336. IEEE, Alagoas, MaceiA, Brazil, Aug. 2011. doi: 10.1109/SIBGRAPI. 2011.22 2
2011 doi
-
[14]
H. Jeon, A. Cho, J. Jang, S. Lee, J. Hyun, H.-K. Ko et al. ZADU: A python library for evaluating the reliability of dimensionality reduction embeddings. In2023 IEEE Visualization and Visual Analytics (VIS), pp. 196–200. IEEE, Melbourne, Australia, Oct. 2023. doi: 10.1109/VIS54...
2023
-
[15]
Jeon, H.-K
H. Jeon, H.-K. Ko, J. Jo, Y . Kim, and J. Seo. Measuring and explaining the inter-cluster reliability of multidimensional projections.IEEE Transac- tions on Visualization and Computer Graphics, 28(1):551–561, Jan. 2022. doi: 10.1109/TVCG.2021.3114833 2, 3, 5
2022
- [16]
-
[17]
P. Joia, F. V . Paulovich, D. Coimbra, J. A. Cuminato, and L. G. Nonato. Local affine multidimensional projection.IEEE Transactions on Visual- ization and Computer Graphics, 17(12):2563–2571, Dec. 2011. doi: 10. 1109/TVCG.2011.220 2
2011
-
[18]
Jolliffe
I. Jolliffe. Principal component analysis.Encyclopedia of statistics in behavioral science, 2005. doi: 10.1007/b98835 1
2005 doi
-
[19]
W. Kahan. Mathematics written in sand. InProc. Joint Statistical Mtg. of the American Statistical Association, pp. 12–26, 1983. 4
1983
-
[20]
Katchalski and A
M. Katchalski and A. Meir. On empty triangles determined by points in the plane.Acta Mathematica Hungarica, 51(3):323–328, 1988. doi: 10. 1007/BF01903339 9
1988
- [21]
-
[22]
J. B. Kruskal. Multidimensional scaling by optimizing goodness of fit to a nonmetric hypothesis.Psychometrika, 29(1):1–27, 1964. 2, 6
1964
-
[23]
LeCun, C
Y . LeCun, C. Cortes, and C. Burges. MNIST handwritten digit database. ATT Labs [Online]. Available: http://yann.lecun.com/exdb/mnist, 2, 2010. 8
2010
-
[24]
J. A. Lee and M. Verleysen. Quality assessment of dimensionality re- duction: Rank-based criteria.Neurocomputing, 72(7–9):1431–1443, Mar
-
[25]
Lespinats and M
S. Lespinats and M. Aupetit. CheckViz: Sanity check and topological clues for linear and non-linear mappings.Computer Graphics Forum, 30(1):113–125, Mar. 2011. doi: 10.1111/j.1467-8659.2010.01835.x 1, 3, 7, 9
2011
-
[26]
Machado, M
A. Machado, M. Behrisch, and A. Telea. Necessary but not sufficient: Limitations of projection quality metrics.Computer Graphics Forum, p. e70101, May 2025. doi: 10.1111/cgf.70101 1, 8
2025 doi
- [27]
-
[28]
R. M. Martins, D. B. Coimbra, R. Minghim, and A. Telea. Visual analysis of dimensionality reduction quality for parameterized projections.Com- puters & Graphics, 41:26–42, June 2014. doi: 10.1016/j.cag.2014.01.006 3
2014 doi
-
[29]
McInnes and J
L. McInnes and J. Healy. Accelerated hierarchical density based cluster- ing. In2017 IEEE international conference on data mining workshops (ICDMW), pp. 33–42. IEEE, 2017. doi: 10.1109/ICDMW.2017.12 7
2017 doi
-
[30]
A. Mead. Review of the development of multidimensional scaling meth- ods.Journal of the Royal Statistical Society. Series D (The Statistician), 41(1):27–39, 1992. doi: 10.2307/2348634 2
1992 doi
-
[31]
Mokbel, W
B. Mokbel, W. Lueks, A. Gisbrecht, and B. Hammer. Visualizing the quality of dimensionality reduction.Neurocomputing, 112:109–123, 2013. doi: 10.1016/j.neucom.2012.11.046 1, 3
2013 doi
-
[32]
L. G. Nonato and M. Aupetit. Multidimensional projection for visual analytics: Linking techniques with distortions, tasks, and layout en- richment.IEEE Transactions on Visualization and Computer Graphics, 25(8):2650–2673, Aug. 2019. doi: 10.1109/TVCG.2018.2846735 1, 2, 3
2019
-
[33]
O’Callaghan
J. O’Callaghan. Human perception of homogeneous dot patterns.Percep- tion, 3(1):33–45, 1974. doi: 10.1068/p030033 2
1974 doi
-
[34]
A. A. Orlov, T. N. Akhmetshin, D. Horvath, G. Marcou, and A. Varnek. From high dimensions to human insight: Exploring dimensionality reduction for chemical space visualization.Molecular Informatics, 44(1):e202400265, 2025. doi: 10.1002/minf.202400265 3
2025 doi
-
[35]
Pagliosa, F
P. Pagliosa, F. V . Paulovich, R. Minghim, H. Levkowitz, and L. G. Nonato. Projection inspector: Assessment and synthesis of multidimensional pro- jections.Neurocomputing, 150:599–610, Feb. 2015. doi: 10.1016/j.neu- com.2014.07.072 2
2015 doi
-
[36]
Paulovich, L
F. Paulovich, L. Nonato, R. Minghim, and H. Levkowitz. Least square pro- jection: A fast high-precision multidimensional projection technique and its application to document mapping.IEEE Transactions on Visualization and Computer Graphics, 14(3):564–575, May 2008. doi: 10.1109...
2008
- [37]
-
[38]
J. Poco, D. M. Eler, F. V . Paulovich, and R. Minghim. Employing 2D projections for fast visual exploration of large fiber tracking data.Com- puter Graphics Forum, 31(3pt2):1075–1084, June 2012. doi: 10.1111/j. 1467-8659.2012.03100.x 7
2012
-
[39]
G. J. Quadri and P. Rosen. Modeling the influence of visual density on cluster perception in scatterplots using topology.IEEE Transactions on Visualization and Computer Graphics, 27(2):1829–1839, 2021. doi: 10. 1109/TVCG.2020.3030365 2
2021
-
[40]
P. E. Rauber, S. G. Fadel, A. X. Falcão, and A. C. Telea. Visualizing the hidden activity of artificial neural networks.IEEE Transactions on Visualization and Computer Graphics, 23(1):101–110, 2017. doi: 10. 1109/TVCG.2016.2598838 8
2017
-
[41]
J. Ros, A. Arleo, and F. Paulovich. Mind the gaps: Measuring visual artifacts in dimensionality reduction, 2025. doi: 10.48550/arXiv.2511. 14544 2
2025 doi
-
[42]
J. Ros, A. Arleo, and F. Paulovich. Enhanced force-scheme: A fast and accurate global dimensionality reduction method.Computers & Graphics, 135:104536, 2026. doi: 10.1016/j.cag.2026.104536 6
2026
-
[43]
J. Ros, A. Arleo, and F. Paulovich. Gap Index source code. https: //codeberg.org/jros/gap-index, 2026. 2, 5
2026
-
[44]
Sadahiro
Y . Sadahiro. Cluster perception in the distribution of point objects.Carto- graphica, 34(1):49–62, 1997. doi: 10.3138/Y308-2422-8615-1233 2
1997 doi
-
[45]
J. W. Sammon. A nonlinear mapping for data structure analysis.IEEE Transactions on computers, 100(5):401–409, 1969. doi: 10.1109/T-C. 1969.222678 2
1969
-
[46]
R. Seidel. The upper bound theorem for polytopes: an easy proof of its asymptotic version.Computational Geometry, 5(2):115–116, Sept. 1995. doi: 10.1016/0925-7721(95)00013-Y 3
1995 doi
-
[47]
M. Sips, B. Neubert, J. P. Lewis, and P. Hanrahan. Selecting good views of high-dimensional data using class consistency.Computer Graphics Forum, 28(3):831–838, 2009. doi: 10.1111/j.1467-8659.2009.01467.x 2
2009
-
[48]
normalized stress
K. Smelser, J. Miller, and S. Kobourov. “normalized stress” is not nor- malized: How to interpret stress correctly. In2024 IEEE Evaluation and Beyond-Methodological Approaches for Visualization (BELIV), pp. 41–50. IEEE, 2024. doi: 10.1109/BELIV64461.2024.00010 1, 2, 5
2024
-
[49]
J. B. Tenenbaum, V . D. Silva, and J. C. Langford. A global ge- ometric framework for nonlinear dimensionality reduction.Science, 290(5500):2319–2323, Dec. 2000. doi: 10.1126/science.290.5500.2319 4
-
[50]
W. S. Torgerson. Multidimensional scaling: I. theory and method.Psy- chometrika, 17(4):401–419, 1952. doi: 10.1007/BF02288916 2
1952 doi
-
[51]
F. S. Tsai. A visualization metric for dimensionality reduction.Expert Systems with Applications, 39(2):1747–1752, Feb. 2012. doi: 10.1016/j. eswa.2011.08.080 4
2012 doi
-
[52]
van der Maaten and G
L. van der Maaten and G. Hinton. Visualizing data using t-SNE.Journal of Machine Learning Research, 9(86):2579–2605, 2008. 1
2008
-
[53]
Venna and S
J. Venna and S. Kaski. Local multidimensional scaling.Neural Networks, 19(6–7):889–899, July 2006. doi: 10.1016/j.neunet.2006.05.014 1, 2, 3, 5
2006 doi
-
[54]
Venna, J
J. Venna, J. Peltonen, K. Nybo, H. Aidos, and S. Kaski. Information retrieval perspective to nonlinear dimensionality reduction for data visual- ization.Journal of Machine Learning Research, 11:451–490, Mar. 2010. doi: doi/10.5555/1756006.1756019 2
2010
-
[55]
Y . Wang, K. Feng, X. Chu, J. Zhang, C.-W. Fu, M. Sedlmair et al. A perception-driven approach to supervised dimensionality reduction for visualization.IEEE Transactions on Visualization and Computer Graphics, 24(5):1828–1840, 2018. doi: 10.1109/TVCG.2017.2701829 2
2018
-
[56]
C. Ware. Chapter six - static and moving patterns. In C. Ware, ed., Information Visualization (Third Edition), Interactive Technologies, pp. 179–237. Morgan Kaufmann, Boston, third edition ed., 2013. doi: 10. 1016/B978-0-12-381464-7.00006-5 1
2013
-
[57]
Warnking, M
J. Warnking, M. Dojat, A. Guérin-Dugué, C. Delon-Martin, S. Olympieff, N. Richard et al. fMRI retinotopic mapping—step by step.NeuroImage, 17(4):1665–1683, 2002. doi: 10.1006/nimg.2002.1304 2
2002
-
[58]
Wattenberg, F
M. Wattenberg, F. Viégas, and I. Johnson. How to use t-SNE effectively. Distill, 2016. doi: 10.23915/distill.00002 1, 5, 8
2016 doi
-
[2009]
doi: 10.1016/j.neucom.2008.12.017 1, 2
2008 doi
Reviewed July 31, 2026 · model on record in the stance chip above.
Discussion (0). Sign in to comment.