REVIEW 5 major objections 6 minor 102 references
Quiescent Host Galaxies of Extended Quasars Revealed by Spectrophotometric Decomposition
T0 review · 5 major / 6 minor · reviewed 2026-08-03 · deepseek-v4-flash
Pith's one-line read This paper argues that most quasars with extended optical morphologies at redshifts 0.1–1 are hosted by quiescent, old-stellar-population galaxies—about 83% quiescent and 23% post-starburst—contrary to the star-forming hosts typical of comp
desk verdict First large systematic look at extended quasar hosts at z<1 finds them mostly quiescent, but the headline fractions rest on selection and model-internal SFR validation. read the letter →
The pith
A machine-rendered reading of the paper's core claim, the machinery that carries it, and where it could break.
The reading
What carries the argument
The central mechanism is an iterative spectrophotometric decomposition: five-band optical imaging is fit with a point-source component plus a generalized elliptical surface-brightness profile, and photometry of the residual image gives the host-to-quasar flux ratio in each band. These image-derived ratios are used as priors when fitting the quasar spectrum, which is modeled as an AGN component (broken power-law continuum, blended iron pseudo-continuum, hydrogen emission lines) plus a host stellar component with a star-formation history divided into age bins. Host and AGN are refit alternately until derived parameters change by less than 5%, breaking the usual degeneracy between the featurele
What would settle it
Generate mock extended quasars with a stellar-population library, dust prescription, and star-formation histories different from the one used in the fitting, then run the decomposition; if the recovered quiescent and post-starburst fractions shift by more than the quoted statistical uncertainties, the classification is template-dependent. Observationally, measure star formation in a subset of the same hosts with an indicator that bypasses template fitting—such as resolved H-alpha emission or far-infrared/radio continuum—and compare the resulting fractions.
Extended reading notes
Core claim
On the paper's own terms, the discovery is that the host galaxies of extended quasars at 0.1<z<1 are mainly quiescent: about 83% have log sSFR < -10.94, and about 23% satisfy post-starburst criteria (strong H-delta absorption, HδA > 4 Å, together with log sSFR < -10.94). The hosts are massive—median stellar mass near 10^10.6 solar masses—with old stellar populations and red colors, and the sample is clearly bimodal in star-formation rate, with no substantial population on the star-forming main sequence. Black-hole masses measured from the decomposed quasar light track host stellar mass with a slope broadly consistent with local relations once systematic uncertainties are included, while the
Load-bearing premise
The quiescent and post-starburst classifications depend on the assumed star-formation-history templates, dust law, and priors used to model the host spectra; the mock tests are generated with the same model family, so they validate internal consistency, not absolute accuracy of the derived star-formation rates.
Editorial extensions
If this is right
- A previously undercounted population of active black holes resides in passive galaxies, so AGN activity and strong star formation are not necessarily simultaneous in low-redshift quasars.
- The 23% post-starburst share implies that a substantial subset of extended quasars is caught shortly after a burst of star formation was shut off, making them direct laboratories for quenching and feedback.
- The host stellar masses peak near 10^10.6 solar masses and match the mass function of quiescent galaxies, so selecting extended morphology effectively selects massive, structurally evolved, quenched hosts.
- The black-hole–stellar-mass relation in this sample is consistent with local relations once systematic uncertainties are included, arguing against strong redshift evolution in this restricted population.
- The absence of a measurable black-hole–velocity-dispersion relation here should not be read as a physical absence, because the same large uncertainties flatten a known input relation in mock tests.
Reading between the lines
- Editorial inference: the 83% and 23% figures are conditional on the morphological selection and do not apply to compact quasars; the combined picture suggests a diversity axis tied to host structure rather than only luminosity or redshift.
- Editorial inference: the same decomposition procedure could be applied to other imaging-plus-spectroscopy AGN samples to map how the quiescent fraction varies with host size and bulge prominence, with a testable prediction that it rises with effective radius.
- Editorial inference: the inferred sequence—star-forming compact hosts giving way to post-starburst extended hosts and then to quiescent hosts—could be tested with spatially resolved stellar-population ages, which should show younger cores or tidal features in the post-starburst systems.
- Editorial inference: if real hosts contain dusty or nebular emission not captured by the template family, the quiescent fraction would be overestimated; resolving this requires star-formation indicators that bypass template fitting, such as infrared luminosity, resolved H-alpha, or radio continuum.
Editorial analysis
A structured set of objections, weighed in public.
Referee Report
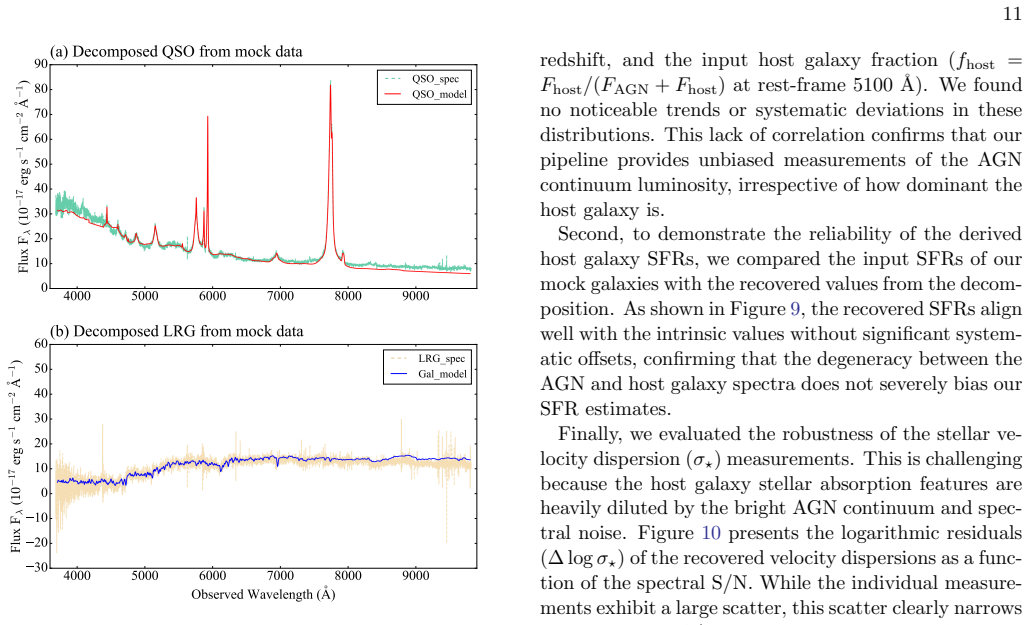
Summary. The paper presents a spectrophotometric decomposition technique that jointly fits DESI spectra and Subaru HSC images for 1126 type 1 quasars at 0.1<z<1 with extended optical morphologies. The key claims are that the host galaxies of these extended quasars are predominantly quiescent (83% with log sSFR<−10.94), that a large fraction (23%) show post-starburst signatures (HδA>4 Å and log sSFR<−10.94), and that the host stellar masses and the MBH–M⋆ relation are broadly consistent with local scaling relations. The method iterates between an AGN spectral model (power-law continuum, Fe pseudo-continuum, Balmer continuum, Gaussian emission lines) and a Bagpipes non-parametric SFH stellar population model, using GalfitM photometric decomposition as a prior. Mock tests are used to argue that the decomposition recovers AGN luminosities, host SFRs, and stellar velocity dispersions with acceptable fidelity.
Significance. If the central claims hold, the paper would add an important data point to the quasar-host co-evolution debate: a sizable population of low-redshift quasars with quiescent and post-starburst hosts, complementing the well-studied compact quasars whose hosts are star-forming. The sample size (1126 objects) is substantial for spectroscopically decomposed quasar hosts, and the joint use of imaging priors with spectral fitting is a genuinely useful methodological direction. The paper is also honest in acknowledging that the morphological selection pre-selects a particular host population. However, the quantitative headline fractions (83% quiescent, 23% post-starburst) are only as reliable as the SFR calibration, and the current validation is not strong enough to support them at face value. The MBH–M⋆ analysis is more robust and less dependent on the disputed SFR values.
major comments (5)
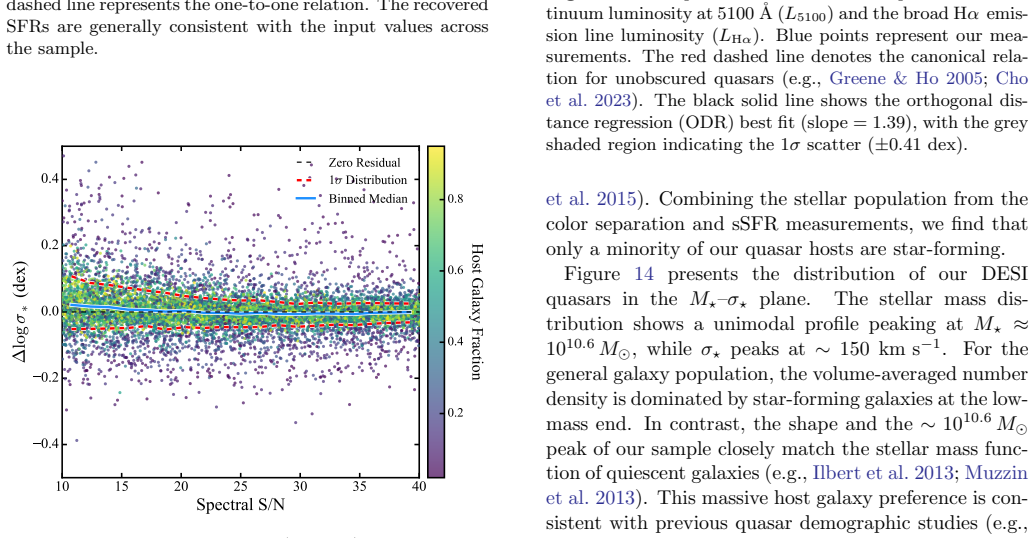
- [Sec. 4, Fig. 9] The SFR recovery test that underpins the quiescent/post-starburst classification contains only N=8 'confident recoveries,' and the mocks are generated with Bagpipes (plus Galsim) and then fitted with Bagpipes. This demonstrates template self-consistency, not external accuracy. The real sample is concentrated at log sSFR<−10.5 (Fig. 12), but no recovery statistics are shown for that low-sSFR regime. If the pipeline systematically biases weak hosts toward even lower sSFR, the 83% and 23% fractions would be inflated. I recommend adding an independent calibration—e.g., mock galaxies from a different SPS code (or with a different dust/nebular prescription) and reporting recovery rates as a function of input sSFR, including upper-limit behavior.
- [Sec. 5.2/5.4, Fig. 12] The 83% quiescent fraction appears to include objects whose sSFRs are upper limits: Fig. 12 explicitly states that points in the shaded region 'only indicate upper limits,' and this shaded region covers the low-sSFR area where the quiescent population lies. Treating upper limits as detections can artificially boost the quiescent fraction. The paper should report the quiescent fraction both with and without upper limits, or use a survival-analysis estimator, and state how many of the 1126 objects are non-detections in SFR.
- [Sec. 2.3/5.4] The sample is selected to have 'non-psf' (extended) morphologies in the Legacy Survey and to be bright (λLλ(5100 Å)>10^43.3 erg s−1). As the paper itself notes, extended morphology is correlated with large effective radius, high stellar mass, and quiescence. The comparison with previous compact-quasar studies is therefore not apples-to-apples: the claim that extended quasar hosts are 'quite different' from compact quasar hosts conflates selection with a physical difference. To make the comparison meaningful, the authors should at least match the two populations in redshift, AGN luminosity, and host stellar mass, or explicitly frame the result as characterizing a pre-selected morphological class rather than as evidence for diversity among quasars in general.
- [Sec. 5.3, Fig. 15] The post-starburst criterion (HδA>4 Å and log sSFR<−10.94) is measured on decomposed host spectra, but no mock test is presented for HδA recovery in the presence of residual AGN contamination. The Lick index is sensitive to continuum placement and to any residual AGN power-law or emission-line leakage. Given that the 23% post-starburst fraction is one of the two central quantitative claims, the paper should validate HδA recovery on mocks with injected AGN at the actual host-fraction and S/N distributions of the sample, and show how the fraction changes under reasonable continuum-placement uncertainties.
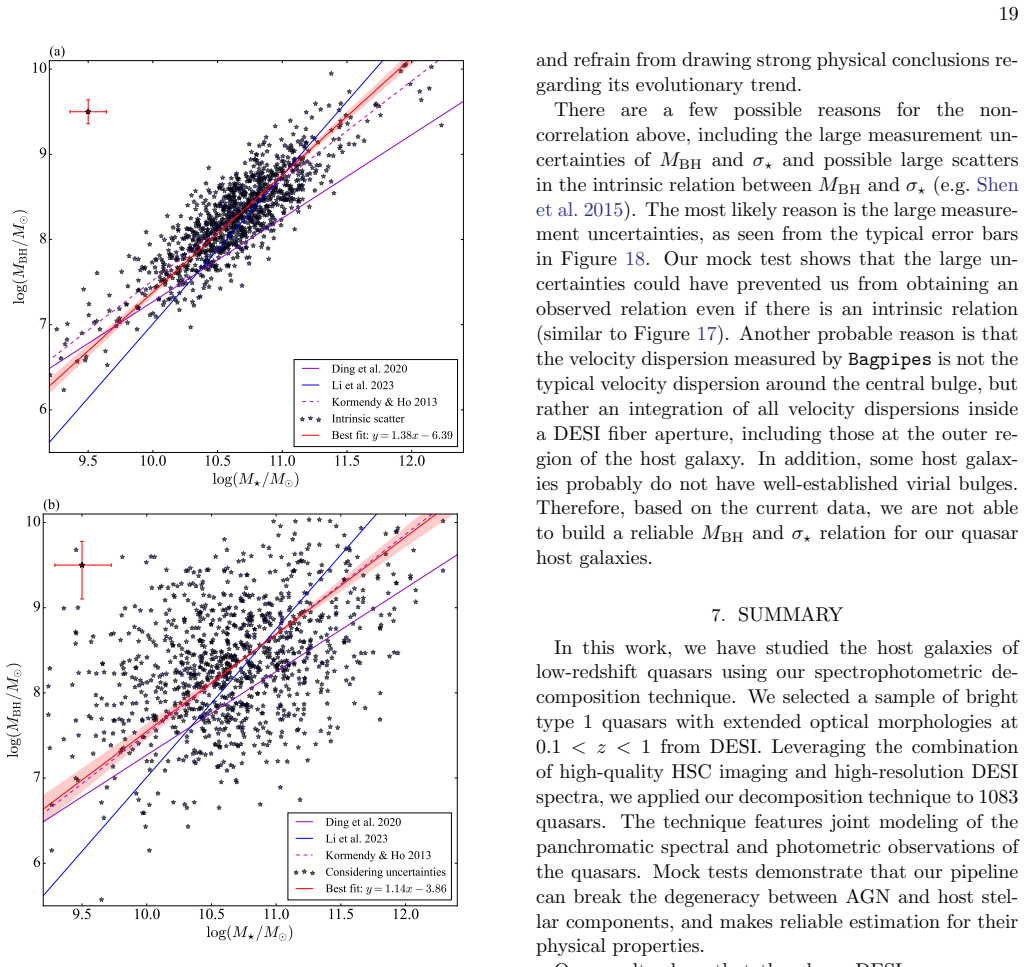
- [Sec. 6.1, Fig. 17] The MBH–M⋆ slope recovery test is constructed by generating mock galaxies that follow the local relation and then injecting the same systematic uncertainties (σsys,M⋆=0.2 dex, σsys,MBH=0.3 dex) that are used in the ODR fit. This is not an independent validation of the fitted slope; it shows that a steep input relation can survive these uncertainties, not that the data themselves require a steep relation. The paper should also present the best-fit slope without the adopted systematic floors, or a sensitivity analysis over a range of floor values, so the reader can see how much of the 'consistency with local relations' is built into the uncertainty model.
minor comments (6)
- [Abstract/Introduction] The phrase 'extended objects' should be defined precisely at first use; it is only fully explained in Sec. 2.3. Also 'Mgii' and 'Caii' are typeset inconsistently (Mgii, Caii, CaI, Mgi) throughout; standard 'Mg II'/'Ca II' would be clearer.
- [Sec. 2.1] The sentence 'its spectra were reduced with pipeline from Guy et al. (2023)' should be 'with the pipeline from Guy et al. (2023).' Similarly, 'The Signal-to-Noise ratios (S/N) of the spectra are calculated as flux divided by the flux error (converted from ivar), which is 1σ value' is awkward and should be rephrased.
- [Sec. 3.1] The 20% systematic error floor is motivated, but it is not stated whether the 20% is applied in quadrature to the statistical errors or as a multiplicative fractional error in the likelihood. This should be clarified for reproducibility.
- [Sec. 4/Appendix B] The text says 'Statistical analysis for the decomposition results of the second mock dataset is displayed in Appendix A (Figure B1)' but the figure appears in Appendix B. The cross-reference should be corrected.
- [Fig. 15] The color bar in the upper panel is labeled 'AGN Density' while the panel shows sSFR on the y-axis; the color scale presumably encodes black hole mass (as stated in the caption), so the label is confusing and should be corrected.
- [Sec. 5.1] The virial mass calibration uses a=6.91 from Ho & Kim (2015). Since the host galaxy decomposition changes the continuum luminosity, the authors should state whether the systematic uncertainty in the virial factor is propagated into the MBH errors used in the scaling-relation fits. This is relevant to the claimed 1σ agreement with local relations.
Circularity Check
No significant circularity: the headline quiescent/post-starburst fractions are measurements on real data with independent color, absorption-line, and control-sample support; no fitted parameter is renamed as a prediction and no load-bearing self-citation is used.
full rationale
The central derivation is not circular. Host sSFR and HδA values are fitted to real DESI spectra and HSC images through an iterative AGN+host decomposition; the headline 83% quiescent and 23% post-starburst fractions are then obtained by applying fixed literature thresholds (log sSFR < -10.94 and HδA > 4 Å) to those fitted values. No parameter is fitted to the headline fractions and then reported as a prediction, and no equation reduces one claimed result to another by construction. The Section 4 mock tests are generated with Bagpipes+Galsim and fitted with the same Bagpipes non-parametric SFH family, so they establish internal self-consistency of the pipeline rather than external accuracy of the SPS templates; this is a validation limitation, not a circular step, because the mock inputs are not the real data and the real-data conclusions are not derived from the mock outputs. Independent evidence supports the classification: the decomposed AGN continuum follows the canonical Hα-L5100 relation (Fig. 11); the host CMD shows red old populations (Fig. 13); the stacked post-starburst spectra show strong Balmer and Ca II absorption (Fig. 15b,c); and an SDSS AGN control sample yields a ~1.2% post-starburst fraction versus 23% for the extended-host sample (Fig. 15a). The sample's morphological pre-selection is explicitly acknowledged as biasing toward quiescent hosts (Sec. 5.4), so it is a stated selection effect rather than a hidden circularity. The self-citations present (e.g., Guo et al. 2018 for PyQSOFit; Siudek et al. 2024 for SED-fitting uncertainties) are code or general-context citations and are not load-bearing. Therefore, under the required quote-and-reduction standard, no circular step is present.
Assumptions & free parameters
free parameters (5)
- Virial MBH calibration constant a =
6.91 ± 0.02
- Systematic uncertainty floors in ODR fit =
σ_sys,M* = 0.2 dex, σ_sys,MBH = 0.3 dex
- Host photometry systematic error floor =
20%
- Quiescent / post-starburst thresholds =
log sSFR = −10.94 yr⁻¹; HδA = 4 Å
- Bagpipes SFH setup =
14 age bins, student-t prior
assumptions (6)
- domain assumption Bagpipes stellar population synthesis templates and non-parametric SFH priors represent the true stellar populations of quasar host galaxies.
- domain assumption The HSC PSF model is accurate and the central AGN is unresolved, so a PSF+Sérsic decomposition separates AGN and host light.
- domain assumption All emission lines are attributed to the AGN and all absorption lines to the host galaxy.
- domain assumption The virial BH mass estimator with the Ho & Kim (2015) calibration is valid for this sample.
- ad hoc to paper Mock validation using Bagpipes-generated galaxies establishes reliability of recovered SFRs.
- domain assumption The 1.5 arcsec aperture photometry on PSF-subtracted images faithfully represents host flux inside the DESI fiber, within the 20% error floor.
Cite this review
Pith. "Pith review of Quiescent Host Galaxies of Extended Quasars Revealed by Spectrophotometric Decomposition." pith.science (2026). https://pith.science/paper/HKJXRW3Z
@misc{pith2026260728732,
  author       = {Pith},
  title        = {Pith review of: Quiescent Host Galaxies of Extended Quasars Revealed by Spectrophotometric Decomposition},
  year         = {2026},
  howpublished = {\url{https://pith.science/paper/HKJXRW3Z}},
  note         = {Machine review of arXiv:2607.28732}
}
abstract
Previous works of low-redshift quasar host galaxies have focused on compact quasars and found that their host galaxies are mainly star-forming galaxies. Here we present a study of host galaxies for quasars with extended morphologies in ground-based optical images. We select a sample of more than 1000 type 1 quasars at redshift $0.1<z<1$ that are classified as extended objects by DESI. Combining high-resolution spectra from DESI and high-quality images from Subaru HSC, we develop a spectrophotometric decomposition technique to iteratively decompose each quasar into an AGN component and its host galaxy. The technique can effectively break the degeneracy between the AGN and host components and capture the host spectral features. Our results show that the host galaxies of most quasars have low star-formation rates (SFRs) and low specific SFRs, indicating that they are quiescent galaxies. Many of them exhibit prominent post-starburst features with the existence of significant old stellar populations. These properties are quite different from the nature of compact quasars with star-forming host galaxies. In addition, the relation between the black hole mass and stellar mass for our sample is broadly consistent with the canonical local relations. This work is complementary to the previous studies and suggests that the host galaxies of low-redshift quasars are more diverse than what was thought.
Figures


Figures from the paper (13 more)







Reference graph
Works this paper leans on
-
[1]
2020, ApJS, 249, 3, doi: 10.3847/1538-4365/ab929e
Ahumada, R., Allende Prieto, C., Almeida, A., et al. 2020, ApJS, 249, 3, doi: 10.3847/1538-4365/ab929e
-
[2]
2022, PASJ, 74, 247, doi: 10.1093/pasj/psab122
Aihara, H., AlSayyad, Y., Ando, M., et al. 2022, PASJ, 74, 247, doi: 10.1093/pasj/psab122
-
[3]
Alexander, D. M., Davis, T. M., Chaussidon, E., et al. 2023, The Astronomical Journal, 165, 124, doi: 10.3847/1538-3881/acacfc
-
[4]
K., Glazebrook, K., Brinkmann, J., et al
Baldry, I. K., Glazebrook, K., Brinkmann, J., et al. 2004, ApJ, 600, 681, doi: 10.1086/380092
doi:10.1086/380092 2004
-
[5]
Bell, E. F., McIntosh, D. H., Barden, M., et al. 2004a, ApJL, 600, L11, doi: 10.1086/381388
-
[6]
F., Wolf, C., Meisenheimer, K., et al
Bell, E. F., Wolf, C., Meisenheimer, K., et al. 2004b, ApJ, 608, 752, doi: 10.1086/420778
-
[7]
F., van der Wel, A., Papovich, C., et al
Bell, E. F., van der Wel, A., Papovich, C., et al. 2012, ApJ, 753, 167, doi: 10.1088/0004-637X/753/2/167
-
[8]
2018, Physics of the Dark Universe, 22, 189, doi: 10.1016/j.dark.2018.11.002
Birrer, S., & Amara, A. 2018, Physics of the Dark Universe, 22, 189, doi: 10.1016/j.dark.2018.11.002
Show all 102 references
- [9]
-
[10]
2018, PASJ, 70, S5, doi: 10.1093/pasj/psx080
Bosch, J., Armstrong, R., Bickerton, S., et al. 2018, PASJ, 70, S5, doi: 10.1093/pasj/psx080
2018 doi
-
[11]
2019, in Astronomical Society of the Pacific Conference Series, Vol
Bosch, J., AlSayyad, Y., Armstrong, R., et al. 2019, in Astronomical Society of the Pacific Conference Series, Vol. 523, Astronomical Data Analysis Software and Systems XXVII, ed. P. J. Teuben, M. W. Pound, B. A. Thomas, & E. M. Warner, 521, doi: 10.48550/arXiv.1812.03248
-
[12]
2023, astropy/photutils: 1.8.0, 1.8.0, Zenodo, doi: 10.5281/zenodo.7946442
Bradley, L., Sip˝ ocz, B., Robitaille, T., et al. 2023, astropy/photutils: 1.8.0, 1.8.0, Zenodo, doi: 10.5281/zenodo.7946442
2023 doi
-
[13]
B., van Dokkum, P
Brammer, G. B., van Dokkum, P. G., & Coppi, P. 2008, ApJ, 686, 1503, doi: 10.1086/591786
2008 doi
-
[14]
Brinchmann, J., Charlot, S., White, S. D. M., et al. 2004, MNRAS, 351, 1151, doi: 10.1111/j.1365-2966.2004.07881.x
2004
-
[15]
2023, AJ, 166, 66, doi: 10.3847/1538-3881/ace35d
Brodzeller, A., Dawson, K., Bailey, S., et al. 2023, AJ, 166, 66, doi: 10.3847/1538-3881/ace35d
2023 doi
- [17]
-
[18]
L., Brotherton, M
Cales, S. L., Brotherton, M. S., Shang, Z., et al. 2013, ApJ, 762, 90, doi: 10.1088/0004-637X/762/2/90 Calistro Rivera, G., Lusso, E., Hennawi, J. F., & Hogg, D. W. 2016, ApJ, 833, 98, doi: 10.3847/1538-4357/833/1/98
2013 doi
-
[19]
2023, MNRAS, 526, 3273, doi: 10.1093/mnras/stad2597
Cappellari, M. 2023, MNRAS, 526, 3273, doi: 10.1093/mnras/stad2597
2023 doi
-
[20]
C., McLure, R
Carnall, A. C., McLure, R. J., Dunlop, J. S., & Dav´ e, R. 2018, Monthly Notices of the Royal Astronomical Society, 480, 4379, doi: 10.1093/mnras/sty2169
2018 doi
-
[21]
C., McLure, R
Carnall, A. C., McLure, R. J., Dunlop, J. S., et al. 2019, MNRAS, 490, 417, doi: 10.1093/mnras/stz2544
2019 doi
-
[22]
2015, ApJL, 805, L9, doi: 10.1088/2041-8205/805/1/L9
Cen, R. 2015, ApJL, 805, L9, doi: 10.1088/2041-8205/805/1/L9
2015 doi
-
[23]
2023, ApJ, 944, 107, doi: 10.3847/1538-4357/acb3c2
Chaussidon, E., Y` eche, C., Palanque-Delabrouille, N., et al. 2023, ApJ, 944, 107, doi: 10.3847/1538-4357/acb3c2
2023 doi
-
[24]
C., Li, R., & Zhuang, M.-Y
Chen, C.-H., Ho, L. C., Li, R., & Zhuang, M.-Y. 2025, ApJ, 983, 60, doi: 10.3847/1538-4357/ada93a
2025 doi
-
[25]
2019, MNRAS, 489, 5709, doi: 10.1093/mnras/stz2494
Chen, Y.-M., Shi, Y., Wild, V., et al. 2019, MNRAS, 489, 5709, doi: 10.1093/mnras/stz2494
2019 doi
-
[26]
2023, ApJ, 953, 142, doi: 10.3847/1538-4357/ace1e5 Cid Fernandes, R., Mateus, A., Sodr´ e, L., Stasi´ nska, G., &
Cho, H., Woo, J.-H., Wang, S., et al. 2023, ApJ, 953, 142, doi: 10.3847/1538-4357/ace1e5 Cid Fernandes, R., Mateus, A., Sodr´ e, L., Stasi´ nska, G., &
2023 doi
-
[27]
Gomes, J. M. 2005, MNRAS, 358, 363, doi: 10.1111/j.1365-2966.2005.08752.x
2005
-
[28]
2013, ARA&A, 51, 393, doi: 10.1146/annurev-astro-082812-141017 DESI Collaboration, Aghamousa, A., Aguilar, J., et al
Conroy, C. 2013, ARA&A, 51, 393, doi: 10.1146/annurev-astro-082812-141017 DESI Collaboration, Aghamousa, A., Aguilar, J., et al. 2016a, arXiv e-prints, arXiv:1611.00036. https://arxiv.org/abs/1611.00036 —. 2016b, arXiv e-prints, arXiv:1611.00037. https://arxiv.org/abs/1611.000...
2013 arXiv
-
[29]
J., Lang, D., et al
Dey, A., Schlegel, D. J., Lang, D., et al. 2019, AJ, 157, 168, doi: 10.3847/1538-3881/ab089d
2019 doi
-
[30]
2020, ApJ, 888, 37, doi: 10.3847/1538-4357/ab5b90 22
Ding, X., Silverman, J., Treu, T., et al. 2020, ApJ, 888, 37, doi: 10.3847/1538-4357/ab5b90 22
2020 doi
-
[31]
D., et al
Ding, X., Onoue, M., Silverman, J. D., et al. 2023, Nature, 621, 51, doi: 10.1038/s41586-023-06345-5
2023 doi
-
[32]
Ramirez-Ruiz, E., & Foley, R. J. 2021, ApJL, 907, L21, doi: 10.3847/2041-8213/abd852
2021 doi
-
[33]
2014, The Astrophysical Journal, 782, 45, doi: 10.1088/0004-637X/782/1/45
Du, P., Hu, C., Lu, K.-X., et al. 2014, The Astrophysical Journal, 782, 45, doi: 10.1088/0004-637X/782/1/45
2014 doi
-
[34]
Fabian, A. C. 2012, ARA&A, 50, 455, doi: 10.1146/annurev-astro-081811-125521
2012 doi
-
[35]
J., Faber, S
Fang, J. J., Faber, S. M., Koo, D. C., & Dekel, A. 2013, ApJ, 776, 63, doi: 10.1088/0004-637X/776/1/63
2013 doi
-
[36]
2020, Journal of Cosmology and Astroparticle Physics, 2020, 015, doi: 10.1088/1475-7516/2020/11/015
Farr, J., Font-Ribera, A., & Pontzen, A. 2020, Journal of Cosmology and Astroparticle Physics, 2020, 015, doi: 10.1088/1475-7516/2020/11/015
2020 doi
-
[37]
P., Mather, J
Gardner, J. P., Mather, J. C., Abbott, R., et al. 2023, Publications of the Astronomical Society of the Pacific, 135, 068001, doi: 10.1088/1538-3873/acd1b5
2023 doi
-
[38]
2002, ApJS, 139, 369, doi: 10.1086/338927
Giacconi, R., Zirm, A., Wang, J., et al. 2002, ApJS, 139, 369, doi: 10.1086/338927
2002 doi
-
[39]
2007, MNRAS, 381, 187, doi: 10.1111/j.1365-2966.2007.12227.x
Goto, T. 2007, MNRAS, 381, 187, doi: 10.1111/j.1365-2966.2007.12227.x
2007
-
[40]
2011, MNRAS, 412, 2211, doi: 10.1111/j.1365-2966.2010.18045.x
Combes, F. 2011, MNRAS, 412, 2211, doi: 10.1111/j.1365-2966.2010.18045.x
2011
-
[41]
E., & Ho, L
Greene, J. E., & Ho, L. C. 2005, ApJ, 630, 122, doi: 10.1086/431897 —. 2006, ApJ, 641, 117, doi: 10.1086/500353
2005 doi
-
[42]
2018, PyQSOFit: Python code to fit the spectrum of quasars, Astrophysics Source Code Library
Guo, H., Shen, Y., & Wang, S. 2018, PyQSOFit: Python code to fit the spectrum of quasars, Astrophysics Source Code Library. http://ascl.net/1809.008
2018
-
[43]
2023, AJ, 165, 144, doi: 10.3847/1538-3881/acb212 H¨ außler, B., Vika, M., Bamford, S
Guy, J., Bailey, S., Kremin, A., et al. 2023, AJ, 165, 144, doi: 10.3847/1538-3881/acb212 H¨ außler, B., Vika, M., Bamford, S. P., et al. 2022, A&A, 664, A92, doi: 10.1051/0004-6361/202142935
2023 doi
-
[44]
M., & Best, P
Heckman, T. M., & Best, P. N. 2014, ARA&A, 52, 589, doi: 10.1146/annurev-astro-081913-035722
2014 doi
- [45]
-
[46]
F., Hernquist, L., Cox, T
Hopkins, P. F., Hernquist, L., Cox, T. J., & Kereˇ s, D. 2008, ApJS, 175, 356, doi: 10.1086/524362
2008 doi
-
[47]
C., et al
Hu, C., Wang, J.-M., Ho, L. C., et al. 2008, The Astrophysical Journal, 687, 78, doi: 10.1086/591838
2008 doi
-
[48]
J., Le F` evre, O., et al
Ilbert, O., McCracken, H. J., Le F` evre, O., et al. 2013, A&A, 556, A55, doi: 10.1051/0004-6361/201321100
2013 doi
-
[49]
2022, ApJ, 926, 184, doi: 10.3847/1538-4357/ac410c
Jin, J.-J., Wu, X.-B., & Feng, X.-T. 2022, ApJ, 926, 184, doi: 10.3847/1538-4357/ac410c
2022 doi
-
[50]
M., White, S
Kauffmann, G., Heckman, T. M., White, S. D. M., et al. 2003a, MNRAS, 341, 33, doi: 10.1046/j.1365-8711.2003.06291.x —. 2003b, MNRAS, 341, 54, doi: 10.1046/j.1365-8711.2003.06292.x
2003
-
[51]
Kormendy, J., & Ho, L. C. 2013, ARA&A, 51, 511, doi: 10.1146/annurev-astro-082708-101811
2013 doi
-
[52]
2023, ApJ, 943, 68, doi: 10.3847/1538-4357/aca5fa
Lan, T.-W., Tojeiro, R., Armengaud, E., et al. 2023, ApJ, 943, 68, doi: 10.3847/1538-4357/aca5fa
2023 doi
-
[53]
R., Tremaine, S., Richstone, D., & Faber, S
Lauer, T. R., Tremaine, S., Richstone, D., & Faber, S. M. 2007, ApJ, 670, 249, doi: 10.1086/522083
2007 doi
-
[54]
D., Conroy, C., et al
Leja, J., Johnson, B. D., Conroy, C., et al. 2019, The Astrophysical Journal, 877, 140, doi: 10.3847/1538-4357/ab1d5a
2019 doi
-
[55]
D., Ding, X., et al
Li, J., Silverman, J. D., Ding, X., et al. 2021, ApJ, 918, 22, doi: 10.3847/1538-4357/ac06a8
2021 doi
-
[56]
Li, J. I. H., Shen, Y., Ho, L. C., et al. 2023, ApJ, 954, 173, doi: 10.3847/1538-4357/acddda
2023 doi
-
[57]
N., Xue, Y
Luo, B., Brandt, W. N., Xue, Y. Q., et al. 2017, ApJS, 228, 2, doi: 10.3847/1538-4365/228/1/2
2017 doi
-
[58]
2024, A&A, 691, A145, doi: 10.1051/0004-6361/202347640
Maiolino, R., Scholtz, J., Curtis-Lake, E., et al. 2024, A&A, 691, A145, doi: 10.1051/0004-6361/202347640
2024 doi
-
[59]
A., Shen, Y., et al
Matsuoka, Y., Strauss, M. A., Shen, Y., et al. 2015, ApJ, 811, 91, doi: 10.1088/0004-637X/811/2/91
2015 doi
-
[60]
A., Ryan, R
Mechtley, M., Windhorst, R. A., Ryan, R. E., et al. 2012, The Astrophysical Journal Letters, 756, L38, doi: 10.1088/2041-8205/756/2/L38
2012 doi
-
[61]
A., et al
Mechtley, M., Jahnke, K., Windhorst, R. A., et al. 2016, ApJ, 830, 156, doi: 10.3847/0004-637X/830/2/156
2016 doi
-
[62]
N., Doel, P., Gutierrez, G., et al
Miller, T. N., Doel, P., Gutierrez, G., et al. 2024, AJ, 168, 95, doi: 10.3847/1538-3881/ad45fe
2024 doi
-
[63]
2023, PhRvD, 108, 123517, doi: 10.1103/PhysRevD.108.123517
Miyatake, H., Sugiyama, S., Takada, M., et al. 2023, PhRvD, 108, 123517, doi: 10.1103/PhysRevD.108.123517
2023 doi
-
[64]
C., Wang, R., et al
Molina, J., Ho, L. C., Wang, R., et al. 2023, ApJ, 944, 30, doi: 10.3847/1538-4357/acaa9b
2023 doi
-
[65]
2013, ApJ, 777, 18, doi: 10.1088/0004-637X/777/1/18
Muzzin, A., Marchesini, D., Stefanon, M., et al. 2013, ApJ, 777, 18, doi: 10.1088/0004-637X/777/1/18
2013 doi
-
[66]
2023, ApJL, 957, L3, doi: 10.3847/2041-8213/ad0158
Pacucci, F., Nguyen, B., Carniani, S., Maiolino, R., & Fan, X. 2023, ApJL, 957, L3, doi: 10.3847/2041-8213/ad0158
2023 doi
-
[67]
Peng, C. Y. 2007, ApJ, 671, 1098, doi: 10.1086/522774
2007 doi
-
[68]
Y., Ho, L
Peng, C. Y., Ho, L. C., Impey, C. D., & Rix, H.-W. 2002, AJ, 124, 266, doi: 10.1086/340952
2002 doi
-
[69]
Peterson, B. M. 1993, PASP, 105, 247, doi: 10.1086/133140
1993 doi
-
[70]
2018, Monthly Notices of the Royal Astronomical Society, 483, 3213, doi: 10.1093/mnras/sty3210
Popesso, P., Concas, A., Morselli, L., et al. 2018, Monthly Notices of the Royal Astronomical Society, 483, 3213, doi: 10.1093/mnras/sty3210
2018 doi
-
[71]
2023, MNRAS, 519, 1526, doi: 10.1093/mnras/stac3214
Popesso, P., Concas, A., Cresci, G., et al. 2023, MNRAS, 519, 1526, doi: 10.1093/mnras/stac3214
2023 doi
-
[72]
2024, AJ, 168, 245, doi: 10.3847/1538-3881/ad76a4
Poppett, C., Tyas, L., Aguilar, J., et al. 2024, AJ, 168, 245, doi: 10.3847/1538-3881/ad76a4
2024 doi
-
[73]
2024, The Astrophysical Journal, 974, 153, doi: 10.3847/1538-4357/ad6e76 23
Ren, W., Guo, H., Shen, Y., et al. 2024, The Astrophysical Journal, 974, 153, doi: 10.3847/1538-4357/ad6e76 23
2024 doi
-
[74]
Robotham, A. S. G., Bellstedt, S., Lagos, C. d. P., et al. 2020, MNRAS, 495, 905, doi: 10.1093/mnras/staa1116
2020 doi
-
[75]
F., Lotz, J
Rodriguez-Gomez, V., Snyder, G. F., Lotz, J. M., et al. 2019, MNRAS, 483, 4140, doi: 10.1093/mnras/sty3345
2019 doi
-
[76]
Rowe, B. T. P., Jarvis, M., Mandelbaum, R., et al. 2015, Astronomy and Computing, 10, 121, doi: 10.1016/j.ascom.2015.02.002
2015 doi
-
[77]
M., Charlot, S., et al
Salim, S., Rich, R. M., Charlot, S., et al. 2007, The Astrophysical Journal Supplement Series, 173, 267, doi: 10.1086/519218 S´ anchez-Bl´ azquez, P., Peletier, R. F., Jim´ enez-Vicente, J., et al. 2006, MNRAS, 371, 703, doi: 10.1111/j.1365-2966.2006.10699.x
2007
-
[78]
F., Kirkby, D., Schlegel, D
Schlafly, E. F., Kirkby, D., Schlegel, D. J., et al. 2023, AJ, 166, 259, doi: 10.3847/1538-3881/ad0832
2023 doi
-
[79]
2021, in American Astronomical Society Meeting Abstracts, Vol
Schlegel, D., Dey, A., Herrera, D., et al. 2021, in American Astronomical Society Meeting Abstracts, Vol. 237, American Astronomical Society Meeting Abstracts, 235.03
2021
-
[80]
Schramm, M., & Silverman, J. D. 2013, ApJ, 767, 13, doi: 10.1088/0004-637X/767/1/13
2013 doi
-
[81]
2007, ApJS, 172, 1, doi: 10.1086/516585
Scoville, N., Aussel, H., Brusa, M., et al. 2007, ApJS, 172, 1, doi: 10.1086/516585
2007 doi
-
[82]
Shen, Y., & Kelly, B. C. 2010, ApJ, 713, 41, doi: 10.1088/0004-637X/713/1/41
2010 doi
-
[83]
E., Ho, L
Shen, Y., Greene, J. E., Ho, L. C., et al. 2015, ApJ, 805, 96, doi: 10.1088/0004-637X/805/2/96
2015 doi
-
[84]
H., Fagrelius, P., Fanning, K., et al
Silber, J. H., Fagrelius, P., Fanning, K., et al. 2023, AJ, 165, 9, doi: 10.3847/1538-3881/ac9ab1
2023 doi
-
[85]
2024, A&A, 691, A308, doi: 10.1051/0004-6361/202451761
Siudek, M., Pucha, R., Mezcua, M., et al. 2024, A&A, 691, A308, doi: 10.1051/0004-6361/202451761
2024 doi
-
[86]
2011, ApJ, 741, 77, doi: 10.1088/0004-637X/741/2/77
Jonsson, P. 2011, ApJ, 741, 77, doi: 10.1088/0004-637X/741/2/77
2011 doi
-
[87]
A., Lyu, J., Rieke, G
Stone, M. A., Lyu, J., Rieke, G. H., Alberts, S., & Hainline, K. N. 2024, The Astrophysical Journal, 964, 90, doi: 10.3847/1538-4357/ad2a57
2024 doi
-
[88]
E., Robotham, A
Thorne, J. E., Robotham, A. S. G., Davies, L. J. M., et al. 2021, MNRAS, 505, 540, doi: 10.1093/mnras/stab1294
2021 doi
-
[89]
2006, The Astrophysical Journal, 650, 57, doi: 10.1086/506376
Tsuzuki, Y., Kawara, K., Yoshii, Y., et al. 2006, The Astrophysical Journal, 650, 57, doi: 10.1086/506376
2006 doi
-
[90]
Vestergaard, M., & Wilkes, B. J. 2001, ApJS, 134, 1, doi: 10.1086/320357
2001 doi
-
[91]
2024, ApJL, 969, L13, doi: 10.3847/2041-8213/ad55f7
Wang, B., Leja, J., de Graaff, A., et al. 2024, ApJL, 969, L13, doi: 10.3847/2041-8213/ad55f7
2024 doi
-
[92]
2021, ApJL, 907, L1, doi: 10.3847/2041-8213/abd8c6
Wang, F., Yang, J., Fan, X., et al. 2021, ApJL, 907, L1, doi: 10.3847/2041-8213/abd8c6
2021 doi
-
[93]
R., Kauffmann, O
Weaver, J. R., Kauffmann, O. B., Ilbert, O., et al. 2022, ApJS, 258, 11, doi: 10.3847/1538-4365/ac3078
2022 doi
-
[94]
2016, MNRAS, 463, 832, doi: 10.1093/mnras/stw1996
Wild, V., Almaini, O., Dunlop, J., et al. 2016, MNRAS, 463, 832, doi: 10.1093/mnras/stw1996
2016 doi
-
[95]
Worthey, G., & Ottaviani, D. L. 1997, ApJS, 111, 377, doi: 10.1086/313021
1997 doi
-
[96]
C., Zhuang, M.-Y., & Shangguan, J
Xie, Y., Ho, L. C., Zhuang, M.-Y., & Shangguan, J. 2021, ApJ, 910, 124, doi: 10.3847/1538-4357/abe404
2021 doi
-
[97]
A., et al
Yan, R., Tremonti, C., Bershady, M. A., et al. 2016, AJ, 151, 8, doi: 10.3847/0004-6256/151/1/8
2016 doi
-
[98]
M., Faber, S
Yesuf, H. M., Faber, S. M., Trump, J. R., et al. 2014, ApJ, 792, 84, doi: 10.1088/0004-637X/792/2/84
2014 doi
-
[99]
W., Connolly, A
Yip, C. W., Connolly, A. J., Szalay, A. S., et al. 2004, AJ, 128, 585, doi: 10.1086/422429
2004 doi
-
[100]
G., Adelman, J., Anderson, Jr., J
York, D. G., Adelman, J., Anderson, Jr., J. E., et al. 2000, AJ, 120, 1579, doi: 10.1086/301513
2000 doi
-
[101]
I., Zaritsky, D., Lin, H., et al
Zabludoff, A. I., Zaritsky, D., Lin, H., et al. 1996, ApJ, 466, 104, doi: 10.1086/177495
1996 doi
-
[102]
Zhuang, M.-Y., & Ho, L. C. 2022, ApJ, 934, 130, doi: 10.3847/1538-4357/ac7aaf —. 2023, Nature Astronomy, 7, 1376, doi: 10.1038/s41550-023-02051-4
2022 doi
-
[103]
Zou, H., Zhou, X., Fan, X., et al. 2017, PASP, 129, 064101, doi: 10.1088/1538-3873/aa65ba 24 APPENDIX A.ADDITIONAL IMAGING DECOMPOSITION EXAMPLE In this appendix, we provide an additional example of our 2D imaging decomposition usingGalfitM. This illustrates the separation of ...
2017 doi
Reviewed August 3, 2026 · model on record in the stance chip above.
Discussion (0). Continue with ORCID to comment.