REVIEW 4 major objections 5 minor 15 references
More than 300 gamma-ray pulsars show a wide variety of pulse shapes; this paper argues the diversity is explained by asymmetric pair-plasma loading in the striped-wind current sheet, with a few physically motivated parameters.
Reviewed by Pith at T0; open to challenge. T0 means a machine referee read the full paper against a public rubric. the ladder, T0–T4 →
T0 review · deepseek-v4-flash
2026-08-03 13:12 UTC pith:OIFI5LGR
load-bearing objection A large and useful atlas of split-monopole light curves with asymmetric emissivity, but the polar-cap pair-loading interpretation rests on an unvalidated sheet locus and an ad hoc emissivity mapping. the 4 major comments →
Polar cap plasma loading and the morphology of pulsar γ-ray light curves
The pith
A machine-rendered reading of the paper's core claim, the machinery that carries it, and where it could break.
Core claim
The paper's central claim is that a spatially dependent emissivity in the split-monopole current sheet — not a collection of separate emission zones — is enough to account for most observed gamma-ray pulse shapes. The current sheet is located where the radial field reverses, at the locus cosθ cosα + sinθ sinα cosψ = 0 (Eq. 1), and each polar cap contributes an emissivity f_K = κ_K |Y^R_{mK,mK}(θ,φ,ϕ_K)|^2 r^{-q}, meaning the pair-multiplicity pattern above each cap is squared and carried into the sheet with a radial falloff. Fitting this model to 130 observed pulsars, the paper finds the symmetric mode (m_N = m_S = 0) almost never works (2% of top-3 fits), the simplest asymmetric dipolar mod
What carries the argument
The machinery is a two-part construction. First, the emitting surface: the split-monopole current sheet, defined analytically by cosθ cosα + sinθ sinα cosψ = 0 with ψ = φ − Ω(t − r/V), the locus of radial magnetic-field reversal, assumed to coincide with the current sheet of a real oblique force-free dipole. Second, the emissivity prescription: f_K(r,θ,φ) = κ_K |Y^R_{mK,mK}(θ,φ,ϕ_K)|^2 r^{-q}, where κ_K sets the pair multiplicity in polar cap K, m_K is the azimuthal spherical-harmonic mode in that cap, ϕ_K is an azimuthal rotation, and q controls the radial falloff. For m=0 with equal amplitudes this reduces to the old uniform-emissivity striped-wind model; for m≥1 the squared spherical harm
Load-bearing premise
The load-bearing premise is that gamma rays are emitted from the split-monopole current-sheet surface given by cosθ cosα + sinθ sinα cosψ = 0, and that the polar-cap pair pattern is transported onto it unchanged; if the true emitting sheet of a dipolar magnetosphere lies elsewhere or the pattern is distorted in transit, every atlas light curve and every fitted obliquity, viewing angle, and loading mode is shifted.
What would settle it
Compute the null surface where the radial magnetic field reverses in a force-free oblique-dipole magnetosphere and compare it with the split-monopole locus cosθ cosα + sinθ sinα cosψ = 0 across the full obliquity range; if the two surfaces differ by more than the current-sheet thickness, the atlas light curves and fitted (α, ζ, κ, m, ϕ) parameters are systematically displaced. A secondary check is to measure whether the pair density in the current sheet of a kinetic simulation actually tracks the polar-cap loading pattern, or is scrambled by reconnection.
If this is right
- If the current-sheet scenario with asymmetric loading is correct, a pulsar's gamma-ray pulse profile directly encodes the pair-loading pattern of its two polar caps as transported into the wind.
- The symmetric uniform current-sheet model is essentially ruled out as a general explanation: it appears in the top-3 fits for only about 2% of the 130-pulsar sample.
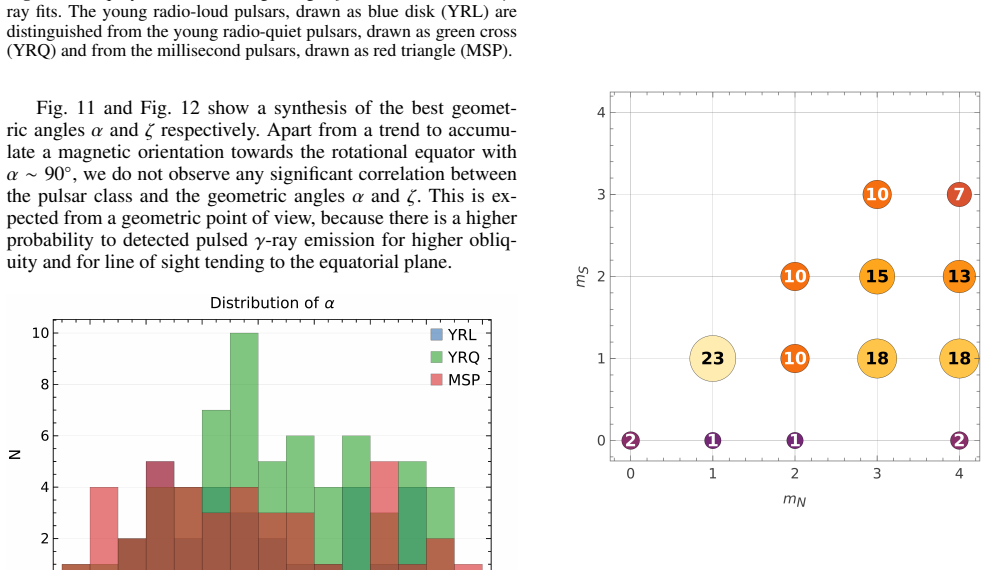
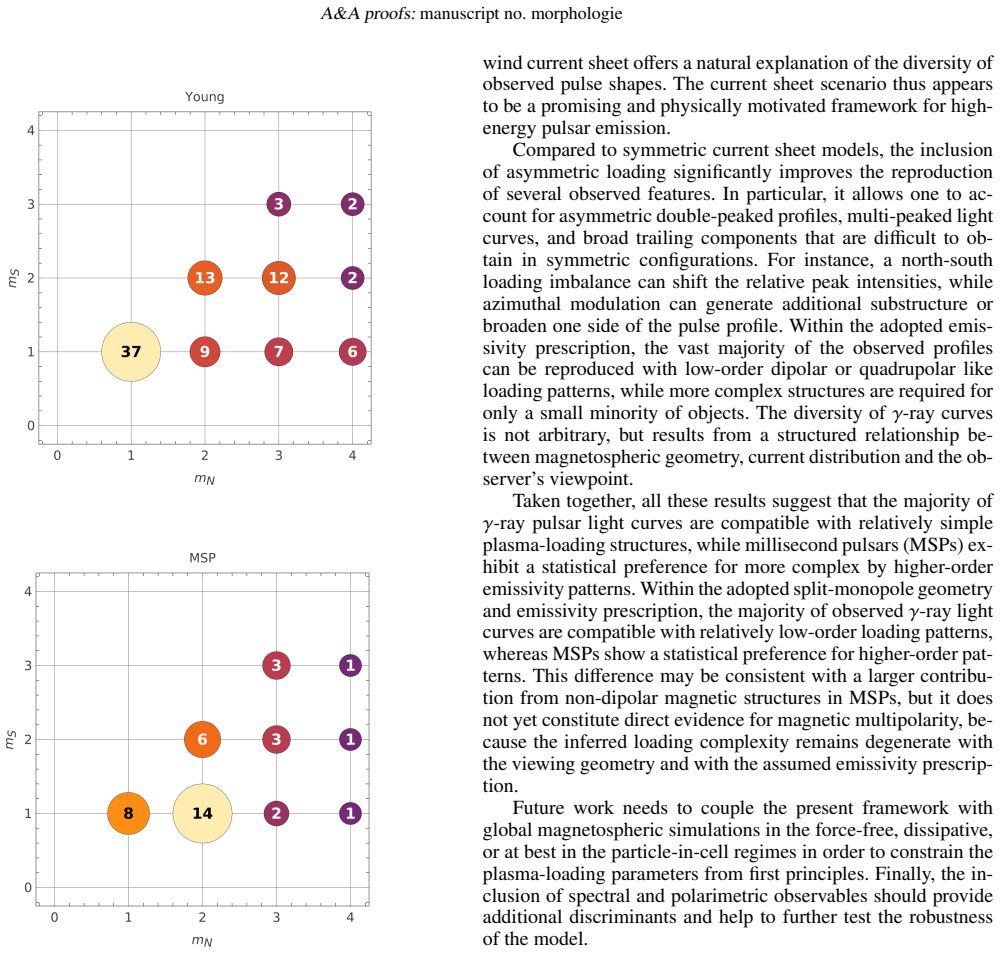
- More than 90% of the sample is fitted with dipolar (m=1) or quadrupolar (m=2) loading patterns, implying large-scale asymmetries dominate the emitting sheet over small-scale structure.
- Millisecond pulsars systematically require higher-order loading modes than young pulsars, a statistical hint of non-dipolar magnetic structures near their surfaces — though the paper stresses this is not yet direct evidence.
- Because the model uses a single emission surface, the magnetic obliquity α and viewing angle ζ can be extracted from peak separation and shape, with the loading parameters controlling asymmetry and substructure.
Where Pith is reading between the lines
- Editorial inference: If the loading pattern truly travels from the polar caps to the current sheet, pulse-profile fitting becomes an indirect probe of the pair-creation cascade near the neutron-star surface, complementing radio drifting-subpulse observations.
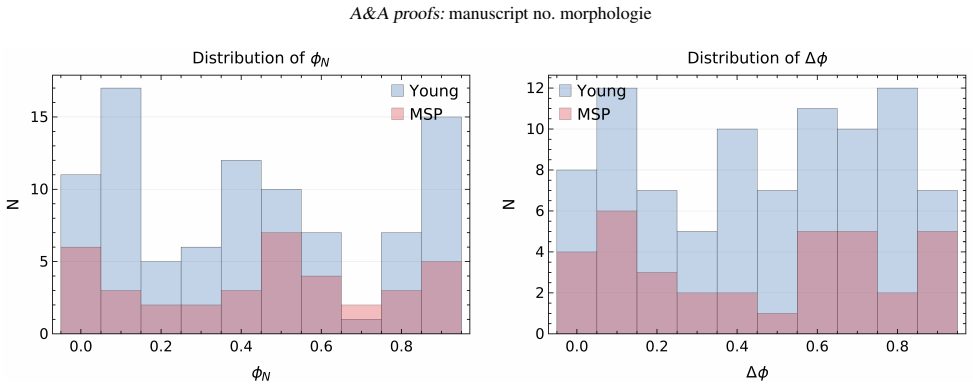
- Editorial inference: The model's preference for phase alignments near ϕ_N=0 and 0.5 is a testable prediction; force-free or particle-in-cell simulations of polar-cap current patterns could confirm or refute that preferred orientation, since the paper itself leaves the causal link unresolved.
- Editorial inference: The model's flexibility implies a strong degeneracy between geometry (α, ζ) and loading parameters (κ, m, ϕ); population-level conclusions about spin-axis geometry should marginalize over loading parameters before interpreting fitted angles.
- Editorial inference: A direct numerical comparison of the split-monopole null surface with the true current-sheet null surface of a force-free oblique dipole — especially near the light cylinder and at high obliquity — would quantify the largest systematic error in this atlas.
Editorial analysis
A structured set of objections, weighed in public.
Referee Report
Summary. The manuscript constructs an analytic model of pulsed gamma-ray emission in which the emitting region is the split-monopole striped-wind current sheet (Eq. 1) and the local emissivity is modulated by squared spherical-harmonic patterns associated with the north and south polar caps (Eq. 4). The author computes a large atlas of light curves, fits the model to 130 Fermi 3PC pulsars, and reports that low-order asymmetric plasma-loading modes, especially (m_N, m_S) = (1, 1), reproduce a large fraction of observed profiles, with millisecond pulsars preferring somewhat higher-order patterns than young pulsars. The central claim is that pulse morphology encodes the polar-cap pair-loading pattern as transported into the current sheet.
Significance. If the two key premises of the model were validated—namely, that the gamma-ray emitting sheet coincides with the split-monopole locus and that the polar-cap pattern is advected unchanged into the sheet—this would be a useful, economical unified framework for Fermi pulsar light curves and would connect macroscopic pulse morphology to polar-cap pair physics. The paper is computationally thorough and transparent about several limitations, and the atlas itself may be a useful reference. However, the physical interpretation goes beyond what is demonstrated: the fit quality is assessed with an ad hoc score, no parameter uncertainties are reported, and the two load-bearing geometric/emissivity assumptions are asserted rather than tested. The conclusions are hedged in places, but the abstract and parts of §4.5 make stronger causal claims than the model currently supports.
major comments (4)
- [§2.1, Eq. (1)] The emitting surface is identified with the split-monopole locus cosθ cosα + sinθ sinα cosψ = 0. The text states that 'several previous works showed' the force-free dipole sheet lies nearly at this location, but no citation or quantitative comparison is given. Every fitted α, ζ, and all mode counts depend on this locus. If the true current sheet in a dipolar magnetosphere differs, e.g., in the near zone or for high obliquity, all fitted parameters and the population-level distributions in Fig. 19 shift. This premise needs to be supported by a citation and a quantitative error estimate, or the paper must explicitly restrict its physical interpretation to the split-monopole toy model rather than claiming that observed morphology encodes the pair-loading pattern.
- [§2.2, Eq. (4)] The central emissivity prescription f_K = κ_K |Y^R_{mK,mK}|² r^{-q} assumes that the polar-cap spherical-harmonic pattern propagates unchanged into the current sheet, with φ replaced by ψ. The paper itself calls this 'phenomenological' and later concedes it is 'not derived from a self-consistent treatment of pair creation and injection' (§4.6). This mapping is load-bearing for the conclusion that pulse morphology reflects polar-cap pair loading. Since only this one emissivity family is used, the successful fits do not test the transport assumption. I request either a physical derivation/justification of Eq. (4) or a robustness check with an alternative ansatz (e.g., localized spots, Gaussian columns, or different harmonic orders) to show that the inferred mode distribution is not an artifact of the specific prescription.
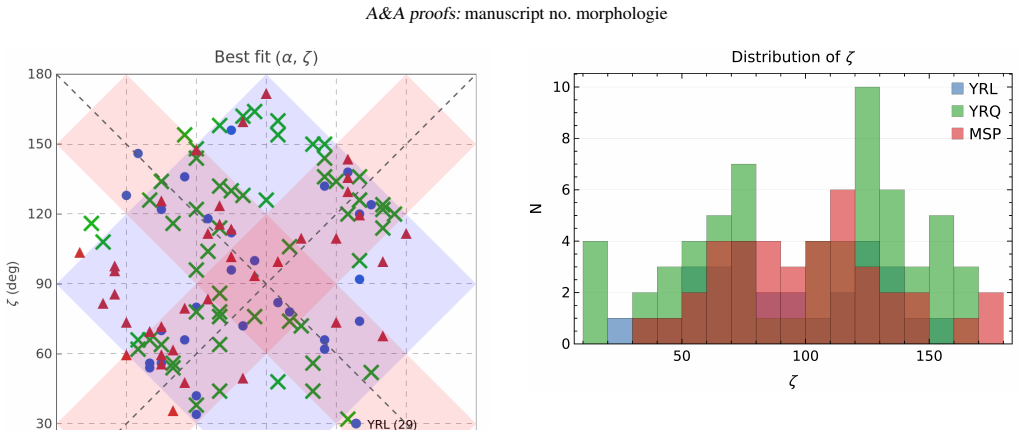
- [§4.2–§4.3, Table 2, Eq. (6)] The population-level claims (e.g., the (1,1) mode in the top-3 for 60% of pulsars, and the young/MSP separation in Fig. 19) are based on χ² minimization with the modified score S_mod of Eq. (6), but no uncertainties on the fitted parameters are reported and no model-selection or cross-validation is performed. Figure 17 shows that many fits, especially for bright pulsars, have very large χ²/d.o.f. values; the 'top-3' criterion selects among poorly fitting models. The statement in §4.5 that 'more than 90%' of pulsars are reproduced by dipolar/quadrupolar modes needs an explicit goodness-of-fit threshold. Without parameter errors or a validation scheme, the mode-count distributions may be dominated by noise and degeneracy rather than by physically meaningful structure.
- [§3.1, §4.3] The atlas is described as containing 16,549,260 light curves, but the fitting section uses only a coarse grid of κ_S/κ_N ∈ {1,2,5,10}, m up to 4, and fixed phase grids. The paper does not discuss the uniqueness or degeneracy of the best-fit parameters, nor the sensitivity of the mode ranking to the chosen grid resolution. Since multiple nearly degenerate solutions are acknowledged (Fig. 18 and the top-3 discussion), the reported histograms of m_N, m_S, φ_N, and Δφ should be accompanied by an assessment of how representative the selected best fits are, for example by showing the spread of parameters among all statistically acceptable fits.
minor comments (5)
- [§2.2, Eq. (2)] The notation arctan(A,B) should be defined explicitly as the two-argument arctangent, and the range of the angle used in cos(m arctan(A,B)) should be stated to avoid ambiguity.
- [§4.2] There are several typographical errors: 'reproduces by' should be 'reproduced by', 'wit the mode' should be 'with the mode', and 'depict' should be 'depicted'.
- [Fig. 10] 'translucence blue square' and 'translucence red cross' should be 'translucent'; the caption could state briefly how the α and ζ values were obtained for the plotted pulsars.
- [§4.4] The sentence 'firm conclusions are difficult to drawn' should read 'difficult to draw'.
- [References] The claim in §2.1 that previous works located the force-free dipole sheet near the split-monopole locus is made without citation; please add the relevant references or remove the claim.
Circularity Check
No significant circularity: the atlas is a forward model and the fitted loading parameters are explicitly labeled phenomenological, not independent predictions.
full rationale
The claimed derivation chain is: adopt the split-monopole current-sheet locus (Eq. 1), prescribe an emissivity (Eq. 4), compute light curves over a grid, and fit those light curves to Fermi pulsar profiles. The paper does not claim that the observed light curves are derived from first principles; it explicitly describes the emissivity as "phenomenological but physically motivated" (§2.2) and later concedes that it "is not derived from a self-consistent treatment of pair creation and injection" (§4.6). The statement that asymmetric emissivity produces asymmetric profiles is a mathematical consequence of the forward model, not a circular inference from the data: the asymmetry parameters were introduced before the light-curve computation, and the atlas is generated independently of the 3PC data before fitting. The fitted mode/phase/asymmetry distributions are parameter estimates under an assumed model, not independent predictions; they should be weighed for model validity and degeneracy, but that is a correctness/robustness concern, not circularity in the derivation. The main load-bearing premise — that the force-free dipolar current sheet lies near the split-monopole locus — is asserted in §2.1 with "Several previous works showed" but without a citation or quantitative comparison, and a dipolar treatment is deferred; this is a missing-support/correctness risk, not a circular equivalence. Self-citations to Pétri (2011, 2024, 2026) and Pétri & Mitra (2021) are used for the base geometry and method, not to forbid alternatives or to import a uniqueness theorem. The paper's conclusions are explicitly hedged "within the adopted split-monopole geometry and emissivity prescription," so it does not overclaim an independent verification of pair loading. No equation or fitted parameter is, on inspection, identical to the claimed result by construction in a way that qualifies as circularity under the rubric.
Axiom & Free-Parameter Ledger
free parameters (7)
- magnetic obliquity α =
best-fit per pulsar from a 35-value grid (5°–175°); not tabulated
- observer line-of-sight angle ζ =
best-fit per pulsar from a 91-value grid (0°–180°); not tabulated
- north-south emissivity ratio κ_S/κ_N =
discrete grid {1,2,5,10}; distribution in Fig. 16
- spherical-harmonic modes m_N, m_S =
0–4 with m_S ≤ m_N; top-3 ranking in Table 2
- north-pole emissivity phase φ_N =
11 grid values; distribution in Fig. 15
- south-pole emissivity phase φ_S (or Δφ) =
11×11 grid; distribution in Fig. 15
- radial emissivity index q =
not reported / not fitted
axioms (5)
- domain assumption The force-free split-monopole solution is a sufficient proxy for the global pulsar magnetosphere.
- domain assumption Gamma-ray emission is produced only in a thin current sheet where B_r reverses sign, and the force-free dipole sheet lies nearly at the split-monopole surface.
- ad hoc to paper Current-sheet emissivity is proportional to |shifted spherical harmonic Y^R_{m,m}|² times r^{-q}, with φ replaced by the phase ψ, as a proxy for pair plasma loading.
- ad hoc to paper Restricting to ℓ=m and m≤4 preserves the physically relevant angular structure of the loading pattern.
- domain assumption A line-of-sight integration of the emissivity with relativistic beaming, ignoring spectral and polarization details, captures pulse morphology.
read the original abstract
The discovery of more than 300 $\gamma$-ray pulsars by the Fermi Large Area Telescope (Fermi-LAT) has revealed a rich diversity of light-curve morphologies that remains challenging to reproduce within purely magnetospheric emission models, suggesting that particle acceleration and radiation may occur, at least in part, in the striped-wind current sheet. We compute a comprehensive atlas of pulsar $\gamma$-ray light curves based on the split-monopole current sheet geometry, with the goal of quantifying the role of pair plasma loading in shaping the observed pulse morphology. The current-sheet surface is described analytically and assumed to be the dominant site of high-energy photon emission. Spatially dependent emissivity prescriptions are introduced through a minimal set of parameters that explicitly break the north-south and azimuthal symmetries of the emitting plasma. With only a few physically motivated parameters, the model is able to reproduce a broad range of the observed $\gamma$-ray light-curve morphologies, including asymmetric, multi-peaked, and highly structured profiles. The results show that asymmetric emissivity, possibly related to pair-plasma loading, provides a natural and economical mechanism capable of reproducing a substantial fraction of the observed diversity of $\gamma$-ray pulse profiles. The current-sheet scenario therefore appears to provide a promising and physically motivated framework for high-energy pulsar emission.
Figures





Reference graph
Works this paper leans on
-
[1]
& Spitkovsky, A
Bai, X.-N. & Spitkovsky, A. 2010, ApJ, 715, 1282
2010
-
[2]
A., & Spitkovsky, A
Cerutti, B., Philippov, A. A., & Spitkovsky, A. 2016, MNRAS, 457, 2401
2016
-
[3]
2024, ApJL, 974, L32
Chernoglazov, A., Philippov, A., & Timokhin, A. 2024, ApJL, 974, L32
2024
-
[4]
Coroniti, F. V . 1990, ApJ, 349, 538
1990
-
[5]
E., Lupsasca, A., & Philippov, A
Gralla, S. E., Lupsasca, A., & Philippov, A. 2017, ApJ, 851, 137
2017
-
[6]
2012, MNRAS, 420, 2793
Kalapotharakos, C., Contopoulos, I., & Kazanas, D. 2012, MNRAS, 420, 2793
2012
-
[7]
2026, A&A, 707, A395
Lorange, A., Pétri, J., Sautron, M., & Vigon, V . 2026, A&A, 707, A395
2026
-
[8]
Michel, F. C. 1994, ApJ, 431, 397 Pétri, J. 2011, MNRAS, 412, 1870 Pétri, J. 2024, A&A, 687, A169 Pétri, J. 2026, A&A, 706, A215 Pétri, J. & Mitra, D. 2021, A&A, 654, A106
1994
-
[9]
Ruderman, M. A. & Sutherland, P. G. 1975, ApJ, 196, 51
1975
-
[10]
A., Abdollahi, S., Ajello, M., et al
Smith, D. A., Abdollahi, S., Ajello, M., et al. 2023, ApJ, 958, 191
2023
-
[11]
2006, ApJ, 648, L51
Spitkovsky, A. 2006, ApJ, 648, L51
2006
-
[12]
Timokhin, A. N. & Arons, J. 2013, MNRAS, 429, 20
2013
-
[13]
Uzdensky, D. A. & Spitkovsky, A. 2014, ApJ, 780, 3
2014
-
[14]
2026, arXiv:2607.08596 [astro-ph.HE]
Zhang, J., Zhu, H., Lin, G., et al. 2026, arXiv:2607.08596 [astro-ph.HE]
Pith/arXiv arXiv 2026
-
[15]
W., Lin, L
Zhao, J., Ng, C. W., Lin, L. C. C., et al. 2017, ApJ, 842, 53 Article number, page 12 of 15 J. Pétri: Polar cap plasma loading and the morphology of pulsarγ-ray light curves Appendix A: Light curve fitting results: full sample In this appendix, we show the full sample of fitted light curves, concerning the 130 pulsars we selected. Fig. A.1 shows the light...
2017
discussion (0)
Sign in with ORCID, Apple, or X to comment. Anyone can read and Pith papers without signing in.