REVIEW 4 major objections 5 minor 146 references
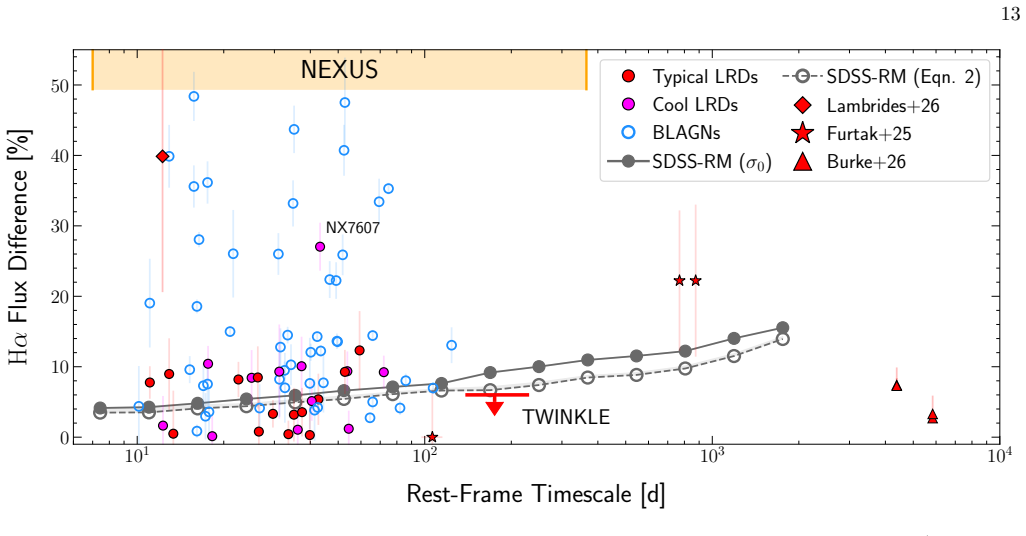
Little Red Dots show H-alpha variability of at most about 4 percent on monthly timescales—far below the ~6 percent red-noise flicker of normal quasars—suggesting their broad-line light is produced differently.
Reviewed by Pith at T0; open to challenge. T0 means a machine referee read the full paper against a public rubric. the ladder, T0–T4 →
2026-08-04 23:36 UTC pith:M4ERO5Y7
load-bearing objection First systematic NIRSpec multi-epoch H-alpha variability sample for LRDs gives a plausible 4% upper limit, but the local-continuum normalization can suppress exactly the variability it measures, so the white-noise conclusion is not yet solid. the 4 major comments →
NEXUS: Spectral Variability of Little Red Dots and Blue Active Galactic Nuclei at 2 lesssim z lesssim 6
The pith
A machine-rendered reading of the paper's core claim, the machinery that carries it, and where it could break.
Core claim
The central claim is that, as a population, LRDs have intrinsic H-alpha flux variability of about 4 percent rms or less on rest-frame timescales under roughly 100 days, with rest-optical continuum variability below about 3 percent, while luminosity-matched low-redshift AGNs show about 6 percent monthly H-alpha variability with a red-noise structure function that grows with timescale. Combining the present multi-epoch NIRSpec measurements with published LRD variability measurements on roughly six-month to decade timescales, the paper argues that LRD variability is flat—white-noise-like—across all sampled timescales, in both H-alpha and continuum. The authors present this as evidence that the
What carries the argument
The load-bearing tool is the maximum-likelihood intrinsic rms variability estimator sigma_0, applied to pairwise fractional H-alpha flux differences between epochs: the paper symmetrizes the difference distribution with negative duplicates and divides the resulting scatter by the square root of two to obtain a sample-wide light-curve rms, sigma_0,lc. This estimator separates true source variability from per-epoch measurement noise, allowing 12 LRDs to be compared statistically with 56 low-redshift SDSS-RM AGNs. The secondary machinery is the ensemble structure function built from SDSS-RM H-alpha light curves, which supplies the red-noise baseline, together with a local-continuum normalizatio
Load-bearing premise
The load-bearing premise is that the LRD continuum is steady over the observed months, so dividing each epoch spectrum by its local continuum only corrects slit losses—an assumption supported by difference-imaging photometry from the first three epochs, since if the continuum actually varies the normalization would cancel the associated line variability and could create the flat low-amplitude pattern the paper reports.
What would settle it
Take the same or a larger LRD sample and normalize every NIRSpec epoch using independent difference-imaging photometry for all epochs rather than the spectral continuum. If the resulting H-alpha rms variability exceeds about 6 percent on rest-frame timescales below 100 days, or if the structure function rises with timescale instead of staying flat, the white-noise, weak-variability conclusion fails.
If this is right
- If LRDs genuinely vary as white noise, standard reverberation-mapping campaigns will not detect correlated H-alpha responses on monthly cadences, and black-hole masses for LRDs cannot be derived the usual way.
- The flat structure function means longer baselines do not accumulate variability signal the way they do for normal AGNs; detecting real LRD variability will require much larger samples or rare individual objects, not simply longer monitoring.
- Models that predict normal AGN-like ionizing-flux flicker, and hence roughly 6 percent monthly broad-line variability, are disfavored for the bulk of the LRD population, while dense-envelope or super-Eddington models that damp short-term variability are favored.
- The enhanced Balmer decrement combined with weak variability points to collisional excitation or radiative transfer in dense gas, rather than dust reddening, as the origin of LRD line ratios.
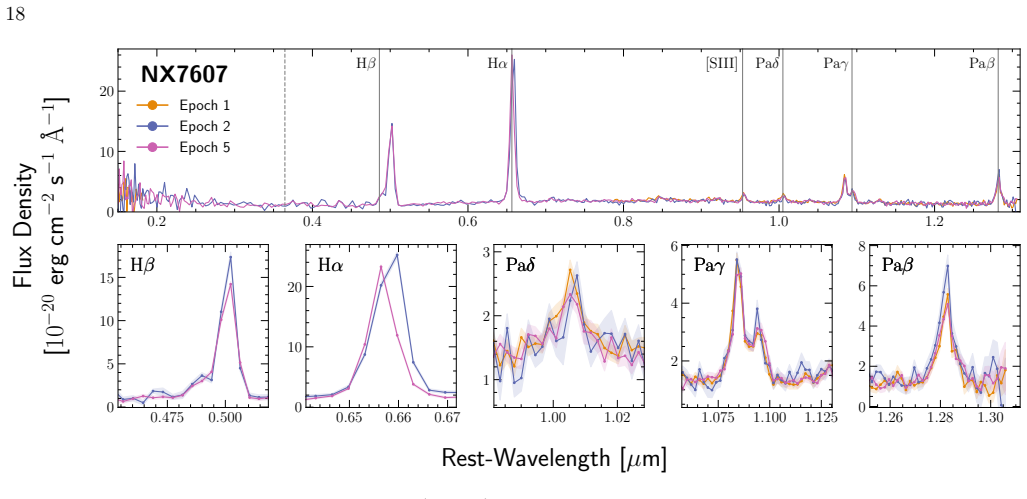
- Rare variable LRDs such as NX7607 may be transitional objects or misclassified reddened AGNs, and identifying such objects is a path toward understanding diversity within the population.
Where Pith is reading between the lines
- If the flat variability pattern is real, the reported 4 percent H-alpha upper limit may itself be optimistic: normalizing each epoch to a constant local continuum would erase any line variability that tracks the continuum, so the true line variability could be even lower than measured.
- The comparison sample is luminosity-matched but not matched in Eddington ratio or black-hole mass; if LRD variability follows the same anti-correlation with accretion rate seen in local AGNs, the observed suppression might reflect extreme super-Eddington accretion rather than a fundamentally different emission mechanism—an alternative the current data may not fully exclude.
- A direct test would be to obtain difference-imaging photometry for every spectroscopic epoch and normalize each spectrum independently; if the LRD continuum does vary at the roughly 2 percent level, the white-noise conclusion would need revision.
- The same multi-epoch NIRSpec data could be searched for correlated narrow-line variability, for example in [OIII], which would discriminate between scattered or reprocessed emission and collisionally excited line origins in the dense-gas picture.
Editorial analysis
A structured set of objections, weighed in public.
Referee Report
Summary. The paper presents multi-epoch JWST/NIRSpec MSA spectroscopy from the first six NEXUS Deep epochs for 17 Little Red Dots and 14 blue broad-line AGNs at 2 ≲ z ≲ 6. After fitting the Hα complex and normalizing each epoch spectrum (local-continuum normalization for LRDs, aperture-photometric normalization for BLAGNs), the authors measure Balmer decrements, line ratios, and Hα and continuum variability. They report that LRDs have enhanced Balmer decrements, low continuum variability (σ0,lc ≈ 2–3%), and low Hα variability (σ0,lc = 4.02%) on rest-frame ~1–3 month timescales, compared with 6.29% for an Hα-luminosity-matched SDSS-RM sample, a difference they quote as 3.8σ. Combining this with literature results at longer timescales, they argue that LRD broad-line variability follows a white-noise pattern, in contrast to the red-noise behavior of normal AGNs, suggesting different broad-line production mechanisms in LRDs.
Significance. If the central result holds, it is valuable: it provides one of the first spectroscopic, ensemble constraints on high-redshift LRD broad-line variability and connects to a growing body of photometric non-detections. The use of an external SDSS-RM comparison sample, the explicit treatment of flux uncertainties via the σ0 maximum-likelihood estimator, and the authors' repeated caution that their estimates are upper limits are strengths. The sample is small (12 LRDs, 26 Hα flux pairs), however, and the headline 4% constraint is conditional on a local-continuum normalization that assumes a non-varying LRD continuum. That assumption, plus the exclusion of the most variable LRD (NX7607), means the population-level claim and the white-noise interpretation are not yet fully secured. With additional robustness tests and more careful reporting of the NX7607 exclusion, the paper would provide a solid upper-limit benchmark for LRD variability models.
major comments (4)
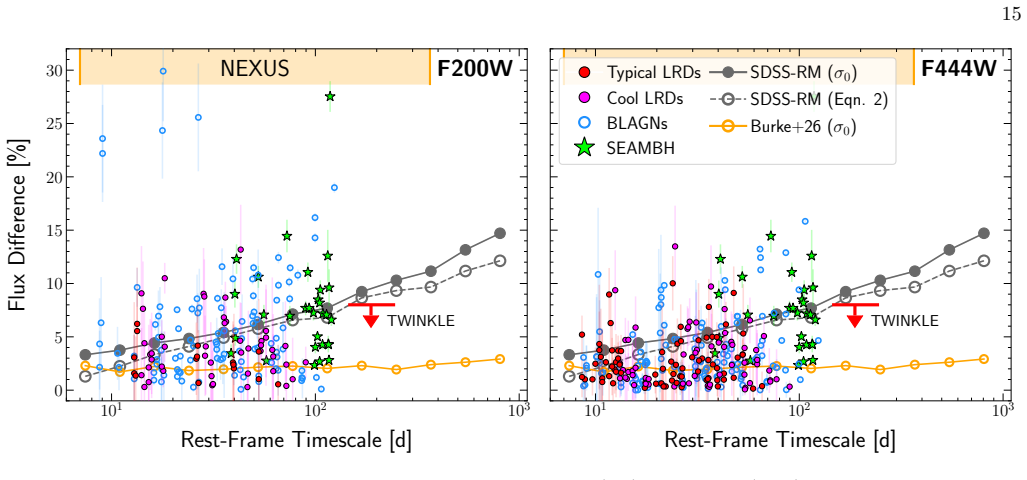
- [§3.1, normalization scheme] The LRD normalization divides each epoch's Hα profile by the fitted local continuum and rescales to the epoch with the largest continuum. This removes any fractional flux change that is common to Hα and the adjacent continuum. In the standard AGN reverberation picture the paper contrasts with, a few-percent ionizing-continuum change over 1–3 months would induce a proportional Hα response, so the normalization would suppress exactly the signal the paper aims to measure. The only direct evidence that the LRD continuum is constant comes from difference-image photometry of the first three Deep imaging epochs (§4.3), whereas the spectroscopic variability uses up to six MSA epochs; raw F200W aperture photometry shows ~6% scatter, comparable to the quoted 4% Hα rms. Thus σ0,lc = 4.02% (Table 3) is an upper limit only under the assumption of a non-varying LRD rest-optical continuum. Please quant
- [§3.3 and Table 3] The text says 'We exclude NX7607 when obtaining σ0,lc, as its ∼30% variability significantly inflates the estimated intrinsic variability,' yet Table 3 lists 'All LRDs' with N_obj = 12, N_pair = 26, and σ0,lc = 4.02%, which appears to include NX7607 (which has 2 reliable epochs in Table 1). No row is given for the sample excluding NX7607, and §4.2 quotes 4.02% as the main LRD result. Please clarify which sample produced the headline value and report both with and without NX7607. Because NX7607 is the single most variable LRD, its inclusion/exclusion is pivotal to the claimed 3.8σ suppression; this must be transparent and not confined to a single sentence.
- [§3.3, σ0 estimator] The σ0 estimate is obtained by duplicating all |ΔF| values with negative signs, thereby doubling the number of data points without adding independent information. The quoted uncertainty (e.g., 4.02+0.59, Table 3) is therefore likely optimistic. With only 26 independent flux pairs from 12 LRDs, the 3.8σ excess over SDSS-RM is fragile. Please validate with bootstrap resampling of the 26 pairs and with one-object-out/jackknife tests, and state the number of independent (non-duplicated) pairs when quoting significances. The SDSS-RM uncertainty is tiny because of its large pair count; the comparison error is dominated by the LRD side, so a proper small-sample treatment is essential.
- [§4.2 and §5.1, white-noise claim] The conclusion of a 'white-noise pattern across all timescales' is derived by combining the NEXUS 4% upper limit with literature points on yearly-to-decade timescales, several of which are themselves upper limits or marginal detections (TWINKLE; Burke et al. 2026; Furtak et al. 2025). Upper limits cannot demonstrate a flat structure function; they only place an envelope. Moreover, the combined data are heterogeneous (different objects, different normalizations, some photometric, some spectroscopic). Please fit a power-law structure function to the upper limits or provide a statistical test that the ensemble is inconsistent with a red-noise model; otherwise soften the conclusion to 'consistent with low-level variability bounded by current upper limits.'
minor comments (5)
- [§3.2, Eq. (1)] The extinction coefficient κ(λ) is used in Eq. (1) before being defined; define R_V and κ in the text immediately before the equation.
- [§4.3/Table 3] The F200W 'Typical LRDs' row contains only 1 object and 15 pairs. This is too little to support an ensemble claim; the text should explicitly caution that the F200W typical-LRD constraint is dominated by a single source.
- [§6] Typo: 'inclde' should be 'include' in the final paragraph.
- [References] A few references are arXiv-only or lack full bibliographic details (e.g., Naidu et al. 2025, Chen et al. 2026, Sneppen et al. 2026). Please ensure all cited works have complete journal/volume/page information where available.
- [§3.1, cool LRDs] The cool LRDs are normalized with aperture photometry while typical LRDs use local continuum, yet both are combined in Table 3's 'All LRDs' row. The text should remind the reader of this methodological difference when interpreting the combined σ0,lc.
Circularity Check
No circular derivation: the Hα variability constraint is an upper limit with a continuum-normalization caveat, and the SDSS-RM comparison is externally grounded.
full rationale
The paper's central derivation (Hα rms variability of LRDs vs SDSS-RM) is self-contained: the same σ0,lc maximum-likelihood estimator is applied to both NEXUS and SDSS-RM light curves, and the comparison sample is drawn from the public SDSS-RM program. The only quasi-circular element is the local-continuum normalization in Section 3.1, which divides each epoch's line profile by the fitted local continuum. This removes any common-mode line+continuum variability and would bias the measured Hα rms low if LRD continua vary at the few-percent level. However, the paper explicitly justifies this choice with difference-image photometry (Section 4.3, quoting Z. Stone et al. 2025) showing ≲2-3% continuum rms, and labels the derived estimates as upper limits due to systematics. That is an explicit assumption with external empirical support, not a mathematical reduction of the conclusion to the inputs. Self-citations to NEXUS survey papers and the σ0 estimator (Y. Shen et al. 2019) are standard method/data references, not circular premises. No fitted parameter is renamed as a prediction. The white-noise interpretation is a synthesis of several independent upper limits, not a derivation from a self-citation chain. The normalization caveat is a correctness risk, not circularity, so the score is low.
Axiom & Free-Parameter Ledger
free parameters (2)
- 5% flux uncertainty cut =
5%
- Line-spread-function resolution increase factor =
60%
axioms (4)
- domain assumption LRDs are compact, so slit losses affect continuum and emission lines identically
- ad hoc to paper The rest-optical continuum of LRDs is not intrinsically variable over ~1-3 month timescales
- domain assumption Intrinsic population variability is Gaussian distributed around zero mean
- domain assumption SMC extinction curve and Case B recombination intrinsic Balmer ratio for A_V estimates
Cite this review
Pith. "Pith review of NEXUS: Spectral Variability of Little Red Dots and Blue Active Galactic Nuclei at $2 \lesssim z \lesssim 6$." pith.science (2026). https://pith.science/paper/M4ERO5Y7
@misc{pith2026260801647,
  author       = {Pith},
  title        = {Pith review of: NEXUS: Spectral Variability of Little Red Dots and Blue Active Galactic Nuclei at $2 \lesssim z \lesssim 6$},
  year         = {2026},
  howpublished = {\url{https://pith.science/paper/M4ERO5Y7}},
  note         = {Machine review of arXiv:2608.01647}
}
read the original abstract
We present spectral measurements for 17 Little Red Dots (LRDs) and 14 blue broad-line active galactic nuclei (AGNs) at $2\lesssim z \lesssim 6$ using multi-epoch JWST NIRSpec MSA spectra from the NEXUS program, sampling rest-frame timescales of $\sim 1-3$ months. Overall, the LRD population shows significantly enhanced Balmer decrement compared with both blue JWST AGNs at similar redshifts and 56 low-redshift broad-line AGNs matched in H$\rm\alpha$ luminosity. The rest-optical continua of LRDs show little ensemble variability (rms $\lesssim 3\%$), and the total H$\rm\alpha$ emission also shows weaker ensemble variability compared with low-redshift AGNs matched in H$\rm\alpha$ luminosity and rest-frame timescales. Based on the flux uncertainties, we constrain the intrinsic H$\rm\alpha$ rms variability to be $\lesssim 4\%$ for the LRD population over these timescales. Combining our results with recent broad-line variability measurements of LRDs over yearly to decade timescales reveals a low-level white-noise pattern across all timescales, in stark contrast to the variability amplitude ($\sim 6\%$ over monthly timescales) and red-noise pattern observed in normal AGNs. These results add to the growing observational studies that suggest population-wise, LRDs have weak variability both in optical continuum and broad-line emission. Furthermore, the distinct white-noise broad-line variability pattern suggests different production mechanisms of broad-line emission in LRDs as opposed to normal AGNs, and/or different properties of the driving ionizing flux from the central engine.
Figures


Reference graph
Works this paper leans on
-
[1]
Ai, Y. L., Yuan, W., Zhou, H. Y., et al. 2010, ApJL, 716, L31, doi: 10.1088/2041-8205/716/1/L31
-
[2]
Akins, H. B., Casey, C. M., Lambrides, E., et al. 2025, The Astrophysical Journal, 991, 37, doi: 10.3847/1538-4357/ade984
-
[3]
Ananna, T. T., Bogd´ an,´A., Kov´ acs, O. E., Natarajan, P., & Hickox, R. C. 2024, The Astrophysical Journal Letters, 969, L18, doi: 10.3847/2041-8213/ad5669
-
[4]
Asada, Y., Inayoshi, K., Fei, Q., Fujimoto, S., & Willott, C. 2026, Origins of the UV Continuum and Balmer Emission Lines in Little Red Dots: Observational Validation of Dense Gas Envelope Models Enshrouding the AGN, arXiv Astropy Collaboration, Robitaille, T. P., Tollerud, E. J., et al. 2013, A&A, 558, A33, doi: 10.1051/0004-6361/201322068 Astropy Collab...
-
[5]
Barro, G., P´ erez-Gonz´ alez, P. G., Kocevski, D. D., et al. 2024, The Astrophysical Journal, 963, 128, doi: 10.3847/1538-4357/ad167e
-
[6]
Begelman, M. C., & Dexter, J. 2026, The Astrophysical Journal, 996, 48, doi: 10.3847/1538-4357/ae274a
-
[7]
Bellm, E. C., Kulkarni, S. R., Graham, M. J., et al. 2019, PASP, 131, 018002, doi: 10.1088/1538-3873/aaecbe
-
[8]
Bentz, M. C., Denney, K. D., Grier, C. J., et al. 2013, ApJ, 767, 149, doi: 10.1088/0004-637X/767/2/149
-
[9]
Blandford, R. D., & McKee, C. F. 1982, The Astrophysical Journal, 255, 419, doi: 10.1086/159843
doi:10.1086/159843 1982
-
[10]
2023, msaexp: NIRSpec analyis tools, 0.6.17 Zenodo, doi: 10.5281/zenodo.8319596
Brammer, G. 2023, msaexp: NIRSpec analyis tools, 0.6.17 Zenodo, doi: 10.5281/zenodo.8319596
-
[11]
2026, arXiv e-prints, arXiv:2601.22214, doi: 10.48550/arXiv.2601.22214
Brazzini, M., D’Eugenio, F., Maiolino, R., et al. 2026, arXiv e-prints, arXiv:2601.22214, doi: 10.48550/arXiv.2601.22214
-
[12]
Brooks, M., Simons, R. C., Trump, J. R., et al. 2024, Here There Be (Dusty) Monsters: High Redshift AGN Are Dustier Than Their Hosts, arXiv, doi: 10.48550/arXiv.2410.07340
-
[13]
Brooks, M., Trump, J. R., Simons, R. C., et al. 2025, Beyond the Monsters: A More Complete Census of Black Hole Activity at Cosmic Dawn, arXiv, doi: 10.48550/arXiv.2511.19609
-
[14]
Burke, C. J., Shen, Y., Liu, X., et al. 2023, Monthly Notices of the Royal Astronomical Society, 518, 1880, doi: 10.1093/mnras/stac2478
-
[15]
J., Stone, Z., Shen, Y., & Jiang, Y.-F
Burke, C. J., Stone, Z., Shen, Y., & Jiang, Y.-F. 2026, ApJ, 1004, 16, doi: 10.3847/1538-4357/ae6b89
-
[16]
J., Shen, Y., Blaes, O., et al
Burke, C. J., Shen, Y., Blaes, O., et al. 2021, Science, 373, 789, doi: 10.1126/science.abg9933
-
[17]
Calzetti, D., Armus, L., Bohlin, R. C., et al. 2000, ApJ, 533, 682, doi: 10.1086/308692
doi:10.1086/308692 2000
-
[18]
Cantiello, M., Hassan, J. B., Perna, R., et al. 2025, Pulsational Instability of Quasi-Stars: Interpreting the Variability of Little Red Dots, arXiv, doi: 10.48550/arXiv.2512.17997
-
[19]
Carnall, A. C., Begley, R., McLeod, D. J., et al. 2023, Monthly Notices of the Royal Astronomical Society: Letters, 518, L45, doi: 10.1093/mnrasl/slac136
-
[20]
Casey, C. M., Akins, H. B., Finkelstein, S. L., et al. 2025, The Astrophysical Journal, 990, L61, doi: 10.3847/2041-8213/adfa91
-
[21]
A Population of Little Red Dot-like Quasars in SDSS
Casey, Q. O., Hickox, R. C., Cleri, N. J., et al. 2026, arXiv e-prints, arXiv:2606.26098, doi: 10.48550/arXiv.2606.26098 21
work page internal anchor Pith review Pith/arXiv arXiv doi:10.48550/arxiv.2606.26098 2026
-
[22]
2025, Monthly Notices of the Royal Astronomical Society, doi: 10.1093/mnras/staf2131
Chang, S.-J., Gronke, M., Matthee, J., & Mason, C. 2025, Monthly Notices of the Royal Astronomical Society, doi: 10.1093/mnras/staf2131
-
[23]
Chen, C.-H., Ho, L. C., Li, R., & Zhuang, M.-Y. 2025, The Astrophysical Journal, 983, 60, doi: 10.3847/1538-4357/ada93a
-
[24]
Chen, C.-H., Shangguan, J., Ho, L. C., et al. 2026, arXiv e-prints, arXiv:2606.04711, doi: 10.48550/arXiv.2606.04711
-
[25]
Chen, K., Li, Z., Inayoshi, K., & Ho, L. C. 2025, ApJL, 994, L42, doi: 10.3847/2041-8213/ae1955 de Graaff, A., Rix, H.-W., Carniani, S., et al. 2024, A&A, 684, A87, doi: 10.1051/0004-6361/202347755 de Graaff, A., Rix, H.-W., Naidu, R. P., et al. 2025, Astronomy & Astrophysics, 701, A168, doi: 10.1051/0004-6361/202554681 de Graaff, A., Hviding, R. E., Naid...
-
[26]
2025, A&A, 704, A313, doi: 10.1051/0004-6361/202557164 DESI Collaboration, Abdul Karim, M., Adame, A
Delvecchio, I., Daddi, E., Magnelli, B., et al. 2025, A&A, 704, A313, doi: 10.1051/0004-6361/202557164 DESI Collaboration, Abdul Karim, M., Adame, A. G., et al. 2026, AJ, 171, 285, doi: 10.3847/1538-3881/ae4c43 D’Eugenio, F., Nelson, E., Ji, X., et al. 2025, arXiv e-prints, arXiv:2510.00101, doi: 10.48550/arXiv.2510.00101 D’Eugenio, F., Juodˇ zbalis, I., ...
-
[27]
2016, ApJ, 825, 126, doi: 10.3847/0004-637X/825/2/126
Du, P., Lu, K.-X., Zhang, Z.-X., et al. 2016, ApJ, 825, 126, doi: 10.3847/0004-637X/825/2/126
-
[28]
2018, ApJ, 856, 6, doi: 10.3847/1538-4357/aaae6b
Du, P., Zhang, Z.-X., Wang, K., et al. 2018, ApJ, 856, 6, doi: 10.3847/1538-4357/aaae6b
-
[29]
Foreman-Mackey, D., Hogg, D. W., Lang, D., & Goodman, J. 2013, PASP, 125, 306, doi: 10.1086/670067
doi:10.1086/670067 2013
-
[30]
Fries, L. B., Trump, J. R., Davis, M. C., et al. 2023, ApJ, 948, 5, doi: 10.3847/1538-4357/acbfb7
-
[31]
Fujimoto, S., Wang, B., Weaver, J. R., et al. 2024, The Astrophysical Journal, 977, 250, doi: 10.3847/1538-4357/ad9027
-
[32]
J., Zitrin, A., Plat, A., et al
Furtak, L. J., Zitrin, A., Plat, A., et al. 2023, The Astrophysical Journal, 952, 142, doi: 10.3847/1538-4357/acdc9d
-
[33]
J., Labb´ e, I., Zitrin, A., et al
Furtak, L. J., Labb´ e, I., Zitrin, A., et al. 2024, Nature, 628, 57, doi: 10.1038/s41586-024-07184-8
-
[34]
Furtak, L. J., Secunda, A. R., Greene, J. E., et al. 2025, Astronomy and Astrophysics, 698, A227, doi: 10.1051/0004-6361/202554110
-
[35]
Gaskell, C. M., & Benker, A. J. 2007, arXiv e-prints, arXiv:0711.1013, doi: 10.48550/arXiv.0711.1013
-
[36]
Gordon, K. D. 2024, Journal of Open Source Software, 9, 7023, doi: 10.21105/joss.07023
-
[37]
Gordon, K. D., Clayton, G. C., Decleir, M., et al. 2023, The Astrophysical Journal, 950, 86, doi: 10.3847/1538-4357/accb59
-
[38]
Gordon, K. D., Clayton, G. C., Misselt, K. A., Landolt, A. U., & Wolff, M. J. 2003, The Astrophysical Journal, 594, 279, doi: 10.1086/376774
doi:10.1086/376774 2003
-
[39]
Gordon, K. D., Fitzpatrick, E. L., Massa, D., et al. 2024, The Astrophysical Journal, 970, 51, doi: 10.3847/1538-4357/ad4be1
-
[40]
Greene, J. E., Labbe, I., Goulding, A. D., et al. 2024, The Astrophysical Journal, 964, 39, doi: 10.3847/1538-4357/ad1e5f
-
[41]
Grier, C. J., Pancoast, A., Barth, A. J., et al. 2017, ApJ, 849, 146, doi: 10.3847/1538-4357/aa901b
-
[42]
2023, The Astrophysical Journal, 959, 39, doi: 10.3847/1538-4357/ad029e
Harikane, Y., Zhang, Y., Nakajima, K., et al. 2023, The Astrophysical Journal, 959, 39, doi: 10.3847/1538-4357/ad029e
-
[43]
Harris, C. R., Millman, K. J., van der Walt, S. J., et al. 2020, Nature, 585, 357, doi: 10.1038/s41586-020-2649-2
-
[44]
2021, ApJS, 253, 20, doi: 10.3847/1538-4365/abd774
Hu, C., Li, S.-S., Yang, S., et al. 2021, ApJS, 253, 20, doi: 10.3847/1538-4365/abd774
-
[45]
2022, ApJ, 934, 132, doi: 10.3847/1538-4357/ac75d8
Hu, H., Inayoshi, K., Haiman, Z., Quataert, E., & Kuiper, R. 2022, ApJ, 934, 132, doi: 10.3847/1538-4357/ac75d8
-
[46]
Hunter, J. D. 2007, Computing in Science & Engineering, 9, 90, doi: 10.1109/MCSE.2007.55
-
[47]
Hutchings, J. B., Crenshaw, D. M., Kraemer, S. B., et al. 2002, AJ, 124, 2543, doi: 10.1086/344080
doi:10.1086/344080 2002
-
[48]
2024, ApJL, 973, L49, doi: 10.3847/2041-8213/ad74e2
Inayoshi, K., & Ichikawa, K. 2024, ApJL, 973, L49, doi: 10.3847/2041-8213/ad74e2
-
[49]
Inayoshi, K., Kimura, S. S., & Noda, H. 2025, Publications of the Astronomical Society of Japan, 77, 811, doi: 10.1093/pasj/psaf050
-
[50]
2025, Monthly Notices of the Royal Astronomical Society, 544, 3900, doi: 10.1093/mnras/staf1867
Ji, X., Maiolino, R., ¨Ubler, H., et al. 2025, Monthly Notices of the Royal Astronomical Society, 544, 3900, doi: 10.1093/mnras/staf1867
-
[51]
2026, Monthly Notices of the Royal Astronomical Society, 545, staf2235, doi: 10.1093/mnras/staf2235
Ji, X., D’Eugenio, F., Juodˇ zbalis, I., et al. 2026, Monthly Notices of the Royal Astronomical Society, 545, staf2235, doi: 10.1093/mnras/staf2235
-
[52]
Jiang, Y.-F., Stone, J. M., & Davis, S. W. 2014, ApJ, 796, 106, doi: 10.1088/0004-637X/796/2/106 Juodˇ zbalis, I., Maiolino, R., Baker, W. M., et al. 2026, MNRAS, 546, stag086, doi: 10.1093/mnras/stag086 Juodˇ zbalis, I., Ji, X., Maiolino, R., et al. 2024, Monthly Notices of the Royal Astronomical Society, 535, 853, doi: 10.1093/mnras/stae2367 22
-
[53]
C., Bechtold, J., & Siemiginowska, A
Kelly, B. C., Bechtold, J., & Siemiginowska, A. 2009, ApJ, 698, 895, doi: 10.1088/0004-637X/698/1/895
-
[54]
Kelly, B. C., Becker, A. C., Sobolewska, M., Siemiginowska, A., & Uttley, P. 2014, ApJ, 788, 33, doi: 10.1088/0004-637X/788/1/33
-
[55]
Kido, D., Ioka, K., Hotokezaka, K., Inayoshi, K., & Irwin, C. M. 2025, Monthly Notices of the Royal Astronomical Society, 544, 3407, doi: 10.1093/mnras/staf1898
-
[56]
2010, ApJ, 724, 386, doi: 10.1088/0004-637X/724/1/386
Kim, D., Im, M., & Kim, M. 2010, ApJ, 724, 386, doi: 10.1088/0004-637X/724/1/386
-
[57]
D., Onoue, M., Inayoshi, K., et al
Kocevski, D. D., Onoue, M., Inayoshi, K., et al. 2023, The Astrophysical Journal, 954, L4, doi: 10.3847/2041-8213/ace5a0
-
[58]
Kocevski, D. D., Finkelstein, S. L., Barro, G., et al. 2025, The Astrophysical Journal, 986, 126, doi: 10.3847/1538-4357/adbc7d
-
[59]
2023, The Astrophysical Journal, 957, L7, doi: 10.3847/2041-8213/ad037a
Kokorev, V., Fujimoto, S., Labbe, I., et al. 2023, The Astrophysical Journal, 957, L7, doi: 10.3847/2041-8213/ad037a
-
[60]
Kokorev, V., Caputi, K. I., Greene, J. E., et al. 2024, The Astrophysical Journal, 968, 38, doi: 10.3847/1538-4357/ad4265
-
[61]
Kokorev, V., Chisholm, J., Naidu, R. P., et al. 2025, The Deepest GLIMPSE of a Dense Gas Cocoon Enshrouding a Little Red Dot, arXiv, doi: 10.48550/arXiv.2511.07515
-
[62]
2024, MNRAS, 529, 2131, doi: 10.1093/mnras/stae515
Kokubo, M. 2024, MNRAS, 529, 2131, doi: 10.1093/mnras/stae515
-
[63]
2025, The Astrophysical Journal, 995, 24, doi: 10.3847/1538-4357/ae119e Koz lowski, S
Kokubo, M., & Harikane, Y. 2025, The Astrophysical Journal, 995, 24, doi: 10.3847/1538-4357/ae119e Koz lowski, S. 2016, ApJ, 826, 118, doi: 10.3847/0004-637X/826/2/118
-
[64]
Kwan, J., & Krolik, J. H. 1981, ApJ, 250, 478, doi: 10.1086/159395 Labb´ e, I., van Dokkum, P., Nelson, E., et al. 2023, Nature, 616, 266, doi: 10.1038/s41586-023-05786-2
doi:10.1086/159395 1981
-
[65]
Labbe, I., Greene, J. E., Matthee, J., et al. 2024, An Unambiguous AGN and a Balmer Break in an Ultraluminous Little Red Dot at Z=4.47 from Ultradeep UNCOVER and All the Little Things Spectroscopy, arXiv, doi: 10.48550/arXiv.2412.04557
-
[66]
Labbe, I., Greene, J. E., Bezanson, R., et al. 2025, The Astrophysical Journal, 978, 92, doi: 10.3847/1538-4357/ad3551
-
[67]
Lam, S. K., Pitrou, A., & Seibert, S. 2015, in Proceedings of the Second Workshop on the LL VM Compiler Infrastructure in HPC, LL VM ’15 (New York, NY, USA: Association for Computing Machinery), 1–6, doi: 10.1145/2833157.2833162
arXiv 2015
-
[68]
Lambrides, E., Garofali, K., Larson, R., et al. 2024, The Case for Super-Eddington Accretion: Connecting Weak X-ray and UV Line Emission in JWST Broad-Line AGN During the First Gyr of Cosmic Time, arXiv, doi: 10.48550/arXiv.2409.13047
-
[69]
Lambrides, E., Hutchison, T. A., Larson, R. L., et al. 2026, arXiv e-prints, arXiv:2604.25991, doi: 10.48550/arXiv.2604.25991
-
[70]
2017, MNRAS, 467, 540, doi: 10.1093/mnras/stx055
Lamperti, I., Koss, M., Trakhtenbrot, B., et al. 2017, MNRAS, 467, 540, doi: 10.1093/mnras/stx055
-
[71]
Landt, H., Bentz, M. C., Ward, M. J., et al. 2008, ApJS, 174, 282, doi: 10.1086/522373
doi:10.1086/522373 2008
-
[72]
Larson, R. L., Finkelstein, S. L., Kocevski, D. D., et al. 2023, The Astrophysical Journal, 953, L29, doi: 10.3847/2041-8213/ace619
-
[73]
2026, ApJ, 1005, 150, doi: 10.3847/1538-4357/ae74c6
Lin, R., Zheng, Z.-Y., Wang, J., et al. 2026, ApJ, 1005, 150, doi: 10.3847/1538-4357/ae74c6
-
[74]
2026, The Astrophysical Journal, 996, 93, doi: 10.3847/1538-4357/ae1b9b
Lin, X., Fan, X., Wang, F., et al. 2026, The Astrophysical Journal, 996, 93, doi: 10.3847/1538-4357/ae1b9b
-
[75]
2026, arXiv e-prints, arXiv:2605.21574, doi: 10.48550/arXiv.2605.21574
Lin, X., Fan, X., Cai, Z., et al. 2026, arXiv e-prints, arXiv:2605.21574, doi: 10.48550/arXiv.2605.21574
-
[76]
Liu, H., Jiang, Y.-F., Quataert, E., Greene, J. E., & Ma, Y. 2025, The Astrophysical Journal, 994, 113, doi: 10.3847/1538-4357/ae0c19
-
[77]
Liu, J.-R., Feng, H., & Ho, L. C. 2026, arXiv e-prints, arXiv:2607.17448. https://arxiv.org/abs/2607.17448
Pith/arXiv arXiv 2026
-
[78]
Liu, Z., Naidu, R. P., Secunda, A., et al. 2026, arXiv e-prints, arXiv:2604.13000, doi: 10.48550/arXiv.2604.13000
-
[79]
2019, ApJ, 877, 23, doi: 10.3847/1538-4357/ab16e8
Lu, K.-X., Huang, Y.-K., Zhang, Z.-X., et al. 2019, ApJ, 877, 23, doi: 10.3847/1538-4357/ab16e8
-
[80]
Ma, Y., Greene, J. E., Setton, D. J., et al. 2025, ApJ, 981, 191, doi: 10.3847/1538-4357/ada613
This paper was first reviewed by deepseek-v4-flash on August 4, 2026.
discussion (0)
Sign in with ORCID, Apple, or X to comment. Anyone can read and Pith papers without signing in.