REVIEW 4 major objections 5 minor 136 references
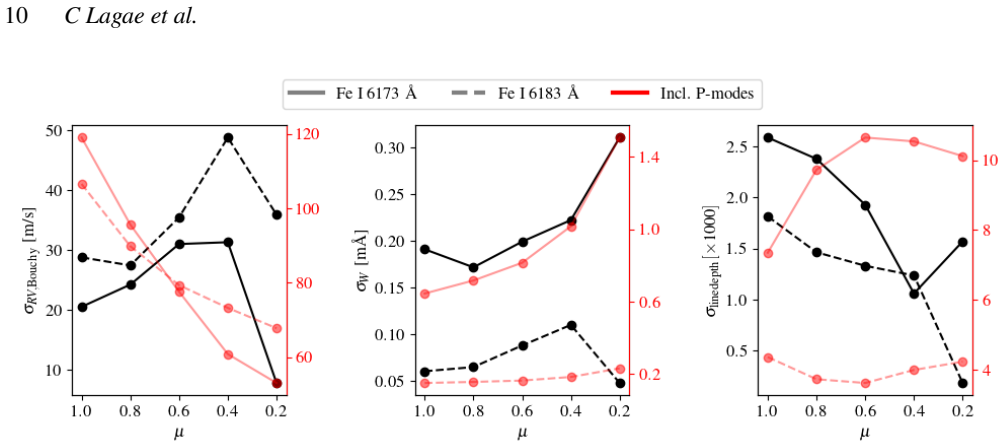
Granulation's spectral fingerprint is set by line strength: weak lines carry the largest velocity wobble (up to 40–50 m/s), strong lines the largest width changes, and width tracks velocity—a handle for removing stellar noise.
Reviewed by Pith at T0; open to challenge. T0 means a machine referee read the full paper against a public rubric. the ladder, T0–T4 →
2026-08-04 10:50 UTC pith:LQTYLOJF
load-bearing objection A careful, useful extension of the granulation parametrisation to 72 lines, but the headline RV–EW correlations are partly baked into the construction and the summary contains a direct contradiction. the 4 major comments →
Towards understanding stellar variability at the sub m/s level: granulation-induced variability across the optical spectrum
The pith
A machine-rendered reading of the paper's core claim, the machinery that carries it, and where it could break.
Core claim
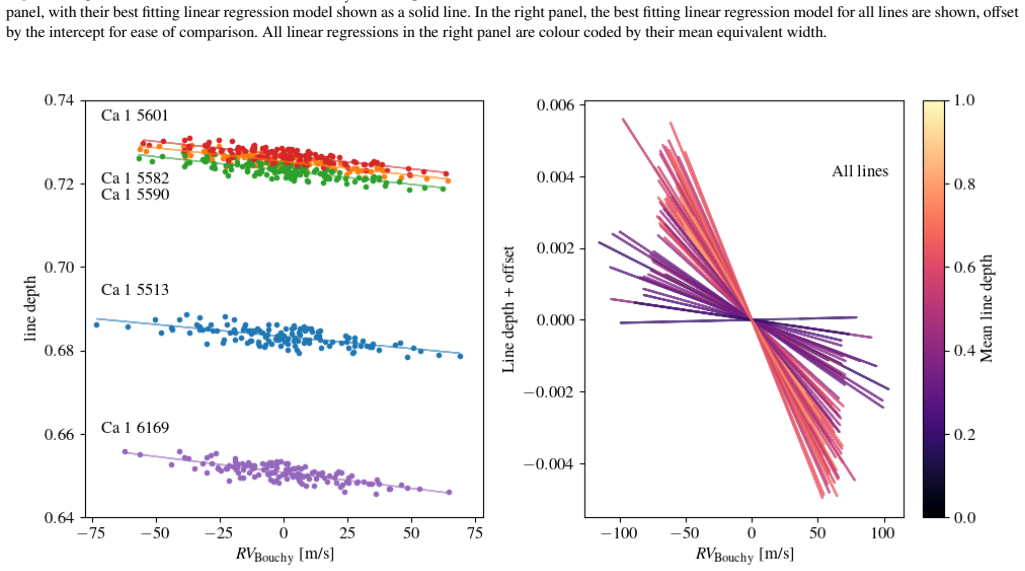
The discovery is a systematic, differential map of granulation's effect across 72 unblended lines in the 5500–5600 Å and 6100–6200 Å regions. RV scatter from granulation anti-correlates with line depth (Spearman r ≈ −0.8 at disc centre) and correlates with lower excitation potential; weak lines reach σ_RV ≈ 40 m/s at disc centre and 50 m/s at the limb. Equivalent-width scatter does the opposite, correlating with line depth (r ≈ 0.87), with strong saturated lines varying most. Instantaneously, equivalent width is linearly anti-correlated with RV for all lines (r < −0.6), and line depth joins it for strong lines (r < −0.75); these correlations strengthen toward the limb. The RV and equivalent
What carries the argument
The engine is a three-component parametrisation of the stellar surface. Each pixel is classified—via regularised logistic regression on continuum intensity, line velocity, and equivalent width—into granular tops, outer-granular regions, and intergranular lanes. Time-averaging the three template line profiles removes p-modes; the granulation signal is carried entirely by the time-varying surface filling factors. Each reconstructed line profile is the weighted sum I_recon = f_GT·I_GT + f_OGR·I_OGR + f_IgL·I_IgL, which both produces p-mode-free timeseries and, by sampling filling factors, generates new disc-integrated spectra. A Wasserstein-distance selection of similar filling-factor distribut
Load-bearing premise
The load-bearing premise is that all granulation-induced line variability is captured by the time-varying filling factors of three fixed template components—if a component's own line shape changes over time, the reconstruction and every correlation built on it miss that signal.
What would settle it
Synthesise the granulation timeseries for a weak line such as Fe I 6183 Å directly from the full 3D simulation, skipping the three-template reconstruction, and compare its RV rms and EW-RV correlation to the reconstructed values; a disagreement larger than the reported few m/s would show the fixed-template assumption loses real variability.
If this is right
- Line masks for exoplanet RV work should be depth-aware: weak lines carry the largest granulation jitter, so including them raises RV rms.
- Strong lines are the best targets for granulation mitigation via line-shape diagnostics, because their equivalent-width–RV correlation is tightest.
- Granulation moves most lines coherently, so line blends shift absolute RV and EW values without distorting the temporal granulation pattern.
- The 48 coherent Fe I and Ca I lines can be parametrised chunk-by-chunk with shared filling factors, enabling multi-line disc-integrated synthetic spectra.
- P-mode contamination changes the centre-to-limb behaviour entirely; p-mode-free reconstructions are needed to measure the granulation component alone.
Where Pith is reading between the lines
- Beyond the paper: if a few hundred strong coherent lines are co-added, equivalent-width precision could reach the sub-0.01 mÅ level needed to use EW as a live granulation monitor for RV data.
- Beyond the paper: the three limb outliers (V I, Ti I, Co I) hint that a minority of species are phase-incoherent; a line-selection step should test whether excluding them improves multi-line masks.
- Beyond the paper: the same filling-factor decomposition could be applied to magnetised simulations; if magnetic regions also produce EW–RV correlations, the method might separate granulation from spot/facula noise rather than only removing p-modes.
- Beyond the paper: the coherence result predicts line-by-line RV extraction should beat full-spectrum cross-correlation for granulation mitigation, a claim that can be tested on existing disc-resolved solar spectra.
Editorial analysis
A structured set of objections, weighed in public.
Referee Report
Summary. The paper uses a 3D MURaM hydrodynamic solar model and MPS-STOKES-ATLAS spectrum synthesis to generate 72 unblended spectral lines in two 100 Å optical windows, at five disc positions (μ=1.0 to 0.2). Building on the parametrisation framework of Frame et al. (2025), the authors classify each pixel into granular tops, outer-granular regions, and intergranular lanes, construct time-averaged component templates, and use time-dependent filling factors to reconstruct p-mode-free line-profile time series (Eq. 1). From these reconstructed time series they report: (i) weak lines have the largest granulation-induced RV rms, up to 40 m/s at disc centre and 50 m/s at the limb; (ii) strong lines have the largest equivalent-width rms; (iii) equivalent width and line depth are strongly correlated with instantaneous RV; (iv) most lines, especially Fe I and Ca I, vary coherently in time, enabling a multi-line parametrisation. The paper also compares RV measurement methods and discusses implications for exoplanet RV surveys.
Significance. If the results are robust, the paper is a valuable systematic extension of granulation-variability studies from the usual handful of Fe I lines to a diverse 72-line sample with tabulated atomic data, and it provides useful scaling relations between line strength, excitation potential, and granulation-induced RV/EW variability. The explicit treatment of RV-measurement dependencies and the cautionary noise budgets for equivalent-width observability are strengths. The validation against F25 and the IAG atlas for Fe I 6151/6173 gives confidence in the mean reconstructed line shapes. However, the central quantitative claims rest on a reconstruction ansatz whose temporal variability is validated for only one or two lines and on correlations that are partly imprinted by the classification features; no uncertainties are given for the headline numbers. These issues must be addressed before the conclusions can be taken as established.
major comments (4)
- [§3, Eq. (1); §3.2; App. B] The reconstruction assumes that all granulation-induced variability is carried by the three component filling factors, while the component templates are time-averaged. The validation in §3.2 and App. B compares temporal means, VPSD, and mean bisectors of Fe I 6151/6173, and mean bisectors of other lines; it does not test the temporal variability of the 70 non-validated lines. Since §4.1–4.3 measure all rms and correlations on the reconstructed time series, a line-depth-dependent intra-component line-shape variability would bias the central weak/strong dichotomy. Agreement with F25 does not resolve this, because F25 used the same reconstruction ansatz. Please add a direct check, e.g., reconstruct a subset of weak lines without template averaging, or quantify the fraction of variance captured by Eq. (1).
- [§3.1 and §4.3] The pixel classification uses RVcog (Eq. 2) and equivalent width as features, and Eq. (1) makes the filling factors the only time-dependent quantities. The EW–RV and depth–RV correlations in §4.3 are therefore partly constructed rather than independently measured: any decomposition built from those features will produce correlated time series. The paper should state this explicitly and test independence, e.g., by classifying on continuum intensity only, or by verifying that the correlations survive when RV and EW are computed from reconstructions with independently determined filling factors. The phrase 'opening the door to new granulation-mitigation methods' overstates the present evidence.
- [§4.1–4.3] No uncertainties are reported for the rms values (Figs 5–8), Spearman coefficients, or the F25 comparisons. The time series contain 129 snapshots from one 65-minute simulation, and the three filling-factor series are smooth, so the effective number of independent samples is small. Bootstrap or other confidence intervals are needed before the r≈0.87 and r≈−0.8 correlations and the 20–50 m/s rms values can be assessed. This is particularly important because the paper uses these numbers to recommend observing strategies and mitigation methods.
- [§7] The summary states 'Without p-modes, strong lines exhibit larger variability in both RV and equivalent width across all limb angles.' This contradicts §4.1 and Fig. 8, where weak lines have the largest RV rms at disc centre and at μ=0.4 (r=−0.8 and −0.77 with line depth), and is inconsistent with the abstract. Please correct this internal inconsistency; as written it will confuse readers about the paper's main result.
minor comments (5)
- [Abstract / §4.3] The abstract states that 'the equivalent width and line depth of a spectral line are strongly linearly correlated with its radial velocity,' but §4.3 shows that depth–RV correlations are weak for many lines with depth<0.5 at disc centre (−0.6<r<0.05). Please qualify the claim.
- [Fig. 10] The right panel shows only regression lines without scatter; given the stated wide range of Spearman coefficients for weak lines, adding shaded intervals or error bars would make the plot informative.
- [App. B] The poor bisector matches for Fe I 5503/5555/5567/6171 and Si I 6125/6155 are attributed to blends in the IAG atlas, but no synthetic test with a more complete line list is made. A sentence acknowledging this as a limitation would be appropriate.
- [§4] Eq. (5) introduces a sign convention opposite to Bouchy et al. (2001); it would help to state explicitly in the text that blueshift corresponds to negative RV.
- [§3.2] The Harvey-function fit parameters are compared with F25 values obtained with different power-law slopes (α=2 versus α=3.3). This makes the comparison difficult to interpret; please present a single consistent fit or clearly explain the change.
Circularity Check
No direct circular reduction found: Eq. 1 is a generative ansatz, and the reported RMS/CLV/correlation values are computed outputs rather than refitted inputs; the main concern is a validation-coverage gap, not circularity.
full rationale
The derivation chain is: MURaM 3D HD snapshots -> MPS-ATLAS spectrum synthesis -> pixel classification into GT/OGR/IgL -> time-averaged component templates -> Eq. 1 reconstruction -> RV/EW/depth diagnostics. No step equates the target result to an input by construction. Eq. 1 defines the reconstructed line as a linear mixture of three time-averaged templates with time-dependent filling factors; the filling factors are obtained from a classifier whose features include RV_cog and equivalent width. This creates a partial overlap between model construction and the measured diagnostics, but it is not a logical circle: the reported quantities (e.g., sigma_RV_Bouchy ~ 20-40 m/s, Spearman coefficients, CLV trends, the weak/strong dichotomy) are not set by the classifier; they emerge from the radiative-transfer templates and the actual time evolution of the filling factors. The same EW-RV anti-correlation is also independently supported by previous work (Cegla et al. 2019; Frame et al. 2026) and by the LARS/IAG comparisons for Fe I 6151/6173. The honest limitation is that the static-template ansatz is directly validated only for two Fe I lines, and the paper explicitly notes that future PoET observations 'will enable more detailed validation of our work'. That is an assumption/validation gap, not a self-consistent reduction. Self-citation of Frame et al. (2025) is load-bearing for the method, but F25 is peer-reviewed and the present paper repeats external comparisons (VPSD vs LARS, bisectors vs IAG), so it does not reduce to an unverified self-citation chain.
Axiom & Free-Parameter Ledger
free parameters (3)
- Template percentile for classification =
2% brightest, 2% faintest, 2% most uncertain pixels
- Coherent-subsample Wasserstein cutoff =
0.4 (normalised 1-Wasserstein distance)
- Harvey function parameters for granulation PSD =
A_g = (1.21 ± 0.21) × 10^-3 m^2 s^-2 Hz^-1; τ = 34 ± 9 s with α = 3.3 refit
axioms (5)
- domain assumption The non-magnetic 3D MURaM HD model (9×9×5 Mm, T_eff ≈ 5787 K, log g = 4.44) faithfully represents solar granulation for line-formation studies.
- domain assumption MPS-STOKES-ATLAS 1.5D LTE spectrum synthesis including 3D local velocity fields produces accurate Stokes-I line profiles.
- domain assumption Time-averaging the component template profiles removes p-modes while preserving granulation; all remaining temporal variability is encoded in the filling factors.
- domain assumption Using per-line RVcog, equivalent width and continuum intensity as classification features yields a physically meaningful three-component decomposition.
- domain assumption VALD atomic data and the curated unblended line list are accurate enough for the 72 lines studied.
Cite this review
Pith. "Pith review of Towards understanding stellar variability at the sub m/s level: granulation-induced variability across the optical spectrum." pith.science (2026). https://pith.science/paper/LQTYLOJF
@misc{pith2026260802240,
  author       = {Pith},
  title        = {Pith review of: Towards understanding stellar variability at the sub m/s level: granulation-induced variability across the optical spectrum},
  year         = {2026},
  howpublished = {\url{https://pith.science/paper/LQTYLOJF}},
  note         = {Machine review of arXiv:2608.02240}
}
read the original abstract
Detecting the radial velocity signal of Earth-mass exoplanets requires the characterisation and removal of granulation-induced radial velocity variability from spectroscopic observations. By coupling three-dimensional (3D) hydrodynamic (HD) simulations to a radiative transfer code, we can isolate and study the effect of granulation on stellar lines. In this study we isolated the impact of granulation on spectral line shapes and shifts for the largest and most diverse synthetic spectral line sample to date. Our aims were twofold. First, we quantified how granulation affects the temporal evolution of shapes and shifts of 72 unblended spectral lines in two wavelength regions: 5500-5600 {\AA} and 6100-6200 {\AA}, from disc centre to the stellar limb. Second, we investigated if spectral lines behave coherently in their line shape variability. We find that weak lines show the largest radial-velocity variability due to granulation, up to 40 m/s at disc centre and 50 m/s at the stellar limb. On the other hand, strong lines exhibit larger variability in equivalent width than weak lines across the stellar disc. In addition, the equivalent width and line depth of a spectral line are strongly linearly correlated with its radial velocity. While granulation affects all three of these quantities, planetary Doppler shifts only affect radial velocities, opening the door to new granulation-mitigation methods. Lastly, we find that the radial velocity and equivalent width of most spectral lines in our sample evolve coherently in time, with the Fe I and Ca I lines behaving the most similarly. Due to the coherency, line blends will not significantly affect the temporal behaviour of RV and line shape, as induced by granulation. Besides, the coherency between spectral lines offer the opportunity to create disc-integrated spectra of many lines simultaneously, which will be explored in future work.
Figures





Reference graph
Works this paper leans on
-
[1]
Stellar Surface Magneto-convection as a Source of Astrophysical Noise. I. Multi-component Parameterization of Absorption Line Profiles. , keywords =. doi:10.1088/0004-637X/763/2/95 , archivePrefix =. 1212.0236 , primaryClass =
-
[2]
Amplitudes of solar-like oscillations: a new scaling relation. , keywords =. doi:10.1051/0004-6361/201116789 , archivePrefix =. 1104.1659 , primaryClass =
-
[3]
Future Missions in Solar, Heliospheric & Space Plasma Physics , year = 1985, editor =
High-Resolution Helioseismology. Future Missions in Solar, Heliospheric & Space Plasma Physics , year = 1985, editor =
1985
-
[4]
Searching for Low-mass Exoplanets amid Stellar Variability with a Fixed Effects Linear Model of Line-by-line Shape Changes. , keywords =. doi:10.3847/1538-3881/adf29d , archivePrefix =. 2502.11930 , primaryClass =
-
[5]
IV - The Fe I curve of growth
Empirical NLTE analyses of solar spectral lines. IV - The Fe I curve of growth. , keywords =
-
[6]
MPS-ATLAS: A fast all-in-one code for synthesising stellar spectra. , keywords =. doi:10.1051/0004-6361/202140275 , archivePrefix =. 2105.13611 , primaryClass =
-
[7]
Small-scale dynamo in cool stars. II. The effect of metallicity. , keywords =. doi:10.1051/0004-6361/202244771 , archivePrefix =. 2211.02722 , primaryClass =
-
[8]
Three-dimensional simulations of near-surface convection in main-sequence stars. IV. Effect of small-scale magnetic flux concentrations on centre-to-limb variation and spectral lines. , keywords =. doi:10.1051/0004-6361/201525874 , archivePrefix =. 1505.04744 , primaryClass =
-
[9]
Equations, methods, and results of the MURaM code
Simulations of magneto-convection in the solar photosphere. Equations, methods, and results of the MURaM code. , keywords =. doi:10.1051/0004-6361:20041507 , adsurl =
-
[10]
Towards understanding stellar variability at the sub m/s level: isolating granulation signals in synthetic spectral lines. , keywords =. doi:10.1093/mnras/staf639 , archivePrefix =. 2504.17011 , primaryClass =
-
[11]
Characterizing Solar Center-to-limb Radial-velocity Variability with SDO. , keywords =. doi:10.3847/1538-4357/ad445a , archivePrefix =. 2404.16747 , primaryClass =
-
[12]
Stellar Surface Magneto-convection as a Source of Astrophysical Noise. II. Center-to-limb Parameterization of Absorption Line Profiles and Comparison to Observations. , keywords =. doi:10.3847/1538-4357/aaddfc , archivePrefix =. 1807.11423 , primaryClass =
-
[13]
Stellar Surface Magnetoconvection as a Source of Astrophysical Noise. III. Sun-as-a-Star Simulations and Optimal Noise Diagnostics. , keywords =. doi:10.3847/1538-4357/ab16d3 , archivePrefix =. 1903.08446 , primaryClass =
Pith/arXiv arXiv 1903
-
[14]
High-accuracy observations of spectral lines in the visible , author=
Convective blueshifts in the solar atmosphere-III. High-accuracy observations of spectral lines in the visible , author=. , volume=. 2019 , publisher=
2019
-
[15]
Testing MURaM and MPS-ATLAS against the quiet solar spectrum. , keywords =. doi:10.1051/0004-6361/202346099 , archivePrefix =. 2310.05652 , primaryClass =
-
[16]
Numerical Simulations of Quiet Sun Magnetism: On the Contribution from a Small-scale Dynamo. , keywords =. doi:10.1088/0004-637X/789/2/132 , archivePrefix =. 1405.6814 , primaryClass =
-
[17]
ASP Conf. Ser. Vol. 411, Astronomical Data Analysis Software and Systems XVIII , author=. 2009 , publisher=
2009
-
[18]
Using the Sun to estimate Earth-like planets detection capabilities . II. Impact of plages. , keywords =. doi:10.1051/0004-6361/200913551 , archivePrefix =. 1001.1638 , primaryClass =
-
[19]
Ground-based and airborne instrumentation for astronomy vi , volume=
EXPRES: a next generation RV spectrograph in the search for earth-like worlds , author=. Ground-based and airborne instrumentation for astronomy vi , volume=. 2016 , organization=
2016
-
[20]
The Messenger , year = 2013, month = sep, volume =
ESPRESSO An Echelle SPectrograph for Rocky Exoplanets Search and Stable Spectroscopic Observations. The Messenger , year = 2013, month = sep, volume =
2013
-
[21]
Identifying Exoplanets with Deep Learning. IV. Removing Stellar Activity Signals from Radial Velocity Measurements Using Neural Networks. , keywords =. doi:10.3847/1538-3881/ac738e , archivePrefix =. 2011.00003 , primaryClass =
Pith/arXiv arXiv 2011
-
[22]
State of the Field in Disentangling Photospheric Velocities
The EXPRES Stellar Signals Project II. State of the Field in Disentangling Photospheric Velocities. , keywords =. doi:10.3847/1538-3881/ac5176 , archivePrefix =. 2201.10639 , primaryClass =
-
[23]
The Impact of Stellar Surface Magnetoconvection and Oscillations on the Detection of Temperate, Earth-Mass Planets Around Sun-Like Stars. Geosciences , keywords =. doi:10.3390/geosciences9030114 , archivePrefix =. 1904.03200 , primaryClass =
Pith/arXiv arXiv 1904
-
[24]
, volume=
Variations of the solar granulation motions with height using the GOLF/SoHO experiment , author=. , volume=. 2008 , publisher=
2008
- [25]
-
[26]
A Gaussian process framework for modelling stellar activity signals in radial velocity data. , keywords =. doi:10.1093/mnras/stv1428 , archivePrefix =. 1506.07304 , primaryClass =
-
[27]
Improving Exoplanet Detection Power: Multivariate Gaussian Process Models for Stellar Activity
Improving Exoplanet Detection Power: Multivariate Gaussian Process Models for Stellar Activity. arXiv e-prints , keywords =. doi:10.48550/arXiv.1711.01318 , archivePrefix =. 1711.01318 , primaryClass =
work page internal anchor Pith review Pith/arXiv arXiv doi:10.48550/arxiv.1711.01318
-
[28]
Planetary detection limits taking into account stellar noise. I. Observational strategies to reduce stellar oscillation and granulation effects. , keywords =. doi:10.1051/0004-6361/201014097 , archivePrefix =. 1010.2616 , primaryClass =
-
[29]
Synthetic disc-integrated absorption lines isolating stellar granulation for high-precision RV studies. , keywords =. doi:10.1093/mnras/stag418 , archivePrefix =. 2603.04382 , primaryClass =
-
[30]
Granulation in K-type dwarf stars. I. Spectroscopic observations. , keywords =. doi:10.1051/0004-6361:200810901 , archivePrefix =. 0810.5247 , primaryClass =
-
[31]
Fe i line shifts in the optical spectrum of the Sun. , keywords =. doi:10.1051/aas:1998173 , archivePrefix =. astro-ph/9710066 , primaryClass =
-
[32]
Three years of HARPS-N high-resolution spectroscopy and precise radial velocity data for the Sun. , keywords =. doi:10.1051/0004-6361/202039350 , archivePrefix =. 2009.01945 , primaryClass =
Pith/arXiv arXiv 2009
-
[33]
Journal of Machine Learning Research , volume =
Scikit-learn: Machine Learning in Python , author =. Journal of Machine Learning Research , volume =
-
[34]
The chemical make-up of the Sun: A 2020 vision. , keywords =. doi:10.1051/0004-6361/202140445 , archivePrefix =. 2105.01661 , primaryClass =
Pith/arXiv arXiv 2020
-
[35]
Stellar signal components seen in HARPS and HARPS-N solar radial velocities. , keywords =. doi:10.1051/0004-6361/202244663 , archivePrefix =. 2211.04251 , primaryClass =
-
[36]
Modelling stochastic and quasi-periodic behaviour in stellar time-series: Gaussian process regression versus power-spectrum fitting. , keywords =. doi:10.1093/mnras/stae1059 , archivePrefix =. 2404.11662 , primaryClass =
-
[37]
The Third Signature of Stellar Granulation. , keywords =. doi:10.1088/0004-637X/697/2/1032 , adsurl =
-
[38]
Spectral Line Depth Variability in Radial Velocity Spectra. , keywords =. doi:10.3847/1538-4357/ac649b , archivePrefix =. 2203.15161 , primaryClass =
-
[39]
GRASS: Distinguishing Planet-induced Doppler Signatures from Granulation with a Synthetic Spectra Generator. , keywords =. doi:10.3847/1538-3881/ac32c2 , archivePrefix =. 2110.11839 , primaryClass =
-
[40]
GRASS. II. Simulations of Potential Granulation Noise Mitigation Methods. , keywords =. doi:10.3847/1538-3881/ad4c6d , archivePrefix =. 2405.07945 , primaryClass =
-
[41]
Line-by-line sensitivity to activity in M dwarfs
The CARMENES search for exoplanets around M dwarfs. Line-by-line sensitivity to activity in M dwarfs. , keywords =. doi:10.1051/0004-6361/202245602 , archivePrefix =. 2302.07916 , primaryClass =
-
[42]
Measuring precise radial velocities on individual spectral lines. III. Dependence of stellar activity signal on line formation temperature. , keywords =. doi:10.1051/0004-6361/202243276 , archivePrefix =. 2205.07047 , primaryClass =
-
[43]
Dumusque, X. , year=. Measuring precise radial velocities on individual spectral lines: I. Validation of the method and application to mitigate stellar activity, , volume=. doi:10.1051/0004-6361/201833795 , journal=
-
[44]
NICOLE: NLTE Stokes Synthesis/Inversion Code
-
[45]
An open-source, massively parallel code for non-LTE synthesis and inversion of spectral lines and Zeeman-induced Stokes profiles. , keywords =. doi:10.1051/0004-6361/201424860 , archivePrefix =. 1408.6101 , primaryClass =
-
[46]
Does the radial-tangential macroturbulence model adequately describe the spectral line broadening of solar-type stars?*. , keywords =. doi:10.1093/pasj/psx022 , archivePrefix =. 1703.02233 , primaryClass =
-
[47]
Why One-dimensional Models Fail in the Diagnosis of Average Spectra from Inhomogeneous Stellar Atmospheres. , keywords =. doi:10.1088/0004-637X/736/1/69 , archivePrefix =. 1101.2643 , primaryClass =
-
[48]
doi:10.1051/aas:2000167 , Journal =
-
[49]
, keywords =
Solar granulation - Influence of convection on spectral line asymmetries and wavelength shifts. , keywords =
-
[50]
Stellar granulation. VI. Four-component models and non-solar-type stars. , volume =
-
[51]
Cambridge Astrophysics Series
Solar and stellar magnetic activity. Cambridge Astrophysics Series. Cambridge Astrophysics Series , keywords =
-
[52]
Convective blueshifts in the solar atmosphere. I. Absolute measurements with LARS of the spectral lines at 6302 A. , keywords =. doi:10.1051/0004-6361/201732107 , archivePrefix =. 1712.07059 , primaryClass =
-
[53]
Sensitivity of Spectral Lines to Granulation: The Sun. , keywords =. doi:10.3847/1538-4357/ae6102 , archivePrefix =. 2509.09824 , primaryClass =
-
[54]
Experimental Astronomy , keywords =
The PLATO 2.0 mission. Experimental Astronomy , keywords =. doi:10.1007/s10686-014-9383-4 , archivePrefix =. 1310.0696 , primaryClass =
-
[55]
Experimental Astronomy , keywords =
The PLATO mission. Experimental Astronomy , keywords =. doi:10.1007/s10686-025-09985-9 , archivePrefix =. 2406.05447 , primaryClass =
-
[56]
The PLATO Mission. arXiv e-prints , keywords =. doi:10.48550/arXiv.2406.05447 , archivePrefix =. 2406.05447 , primaryClass =
-
[57]
Width cross-sections for collisional broadening of s-p and p-s transitions by atomic hydrogen. , keywords =. doi:10.1093/mnras/276.3.859 , adsurl =
-
[58]
The broadening of p-d and d-p transitions by collisions with neutral hydrogen atoms. , keywords =. doi:10.1093/mnras/290.1.102 , adsurl =
-
[59]
Line formation in solar granulation. I. Fe line shapes, shifts and asymmetries. , keywords =. doi:10.48550/arXiv.astro-ph/0005320 , archivePrefix =. astro-ph/0005320 , primaryClass =
-
[60]
The Messenger , year = 2025, month = mar, volume =
PoET: the Paranal solar ESPRESSO Telescope. The Messenger , year = 2025, month = mar, volume =. doi:10.18727/0722-6691/5381 , adsurl =
-
[61]
3D magneto-hydrodynamical simulations of stellar convective noise for improved exoplanet detection. I. Case of regularly sampled radial velocity observations. , keywords =. doi:10.1051/0004-6361/201937105 , archivePrefix =. 2002.07457 , primaryClass =
Pith/arXiv arXiv 2002
-
[62]
Performance Verification of the EXtreme PREcision Spectrograph. , keywords =. doi:10.3847/1538-3881/ab811d , archivePrefix =. 2003.08852 , primaryClass =
Pith/arXiv arXiv 2003
-
[63]
Oxygen lines in solar granulation. I. Testing 3D models against new observations with high spatial and spectral resolution. , keywords =. doi:10.1051/0004-6361/200912829 , archivePrefix =. 0909.2307 , primaryClass =
-
[64]
The IAG spectral atlas of the spatially resolved Sun: Centre-to-limb observations. , keywords =. doi:10.1051/0004-6361/202245612 , archivePrefix =. 2303.08205 , primaryClass =
-
[65]
Convective blueshift strengths of 810 F to M solar-type stars. , keywords =. doi:10.1051/0004-6361/202039607 , archivePrefix =. 2108.03859 , primaryClass =
-
[66]
Convective blueshift strengths for 242 evolved stars. , keywords =. doi:10.1051/0004-6361/202244394 , archivePrefix =. 2303.04556 , primaryClass =
-
[67]
Fe line shapes, shifts and asymmetries
The Stagger-grid: A grid of 3D stellar atmosphere models - V. Fe line shapes, shifts and asymmetries. arXiv e-prints , keywords =. doi:10.48550/arXiv.1403.6245 , archivePrefix =. 1403.6245 , primaryClass =
-
[68]
Convective characteristics of Fe I lines across the solar disc. , keywords =. doi:10.1051/0004-6361/202347615 , archivePrefix =. 2310.15782 , primaryClass =
-
[69]
Upgrade from a prototype to a turn-key system
LARS: An Absolute Reference Spectrograph for solar observations. Upgrade from a prototype to a turn-key system. , keywords =. doi:10.1051/0004-6361/201731164 , archivePrefix =. 1707.01573 , primaryClass =
-
[70]
A convective correction to measured solar wavelengths. , keywords =. doi:10.1086/156375 , adsurl =
-
[71]
Photospheric line asymmetries and wavelength shifts
``Ultimate'' information content in solar and stellar spectra. Photospheric line asymmetries and wavelength shifts. , keywords =. doi:10.1051/0004-6361:200810481 , archivePrefix =. 0810.2533 , primaryClass =
-
[72]
Solar photospheric spectrum microvariability. I. Theoretical searches for proxies of radial-velocity jittering. , keywords =. doi:10.1051/0004-6361/202347142 , archivePrefix =. 2308.10937 , primaryClass =
-
[73]
Measuring precise radial velocities on individual spectral lines. II. Dependance of stellar activity signal on line depth. , keywords =. doi:10.1051/0004-6361/201936548 , archivePrefix =. 1912.05192 , primaryClass =
Pith/arXiv arXiv 1912
-
[74]
, year = 1994, month = aug, volume =
Solar Seismology - the Velocity Continuum Spectrum. , year = 1994, month = aug, volume =. doi:10.1093/mnras/269.3.529 , adsurl =
-
[75]
Predicting convective blueshift and radial-velocity dispersion due to granulation for FGK stars. , keywords =. doi:10.1093/mnras/stad2393 , archivePrefix =. 2307.06986 , primaryClass =
-
[76]
The magnetically quiet solar surface dominates HARPS-N solar RVs during low activity. , keywords =. doi:10.1093/mnras/stad3723 , archivePrefix =. 2311.16076 , primaryClass =
-
[77]
Fundamental photon noise limit to radial velocity measurements. , keywords =. doi:10.1051/0004-6361:20010730 , adsurl =
-
[78]
Spectral signatures as a function of line-formation temperature
Granulation on a quiet K dwarf: HD 166620 I. Spectral signatures as a function of line-formation temperature. , keywords =. doi:10.1093/mnras/staf1523 , archivePrefix =. 2509.04573 , primaryClass =
-
[79]
Three years of Sun-as-a-star radial-velocity observations on the approach to solar minimum. , keywords =. doi:10.1093/mnras/stz1215 , archivePrefix =. 1904.12186 , primaryClass =
Pith/arXiv arXiv 1904
-
[80]
Separating planetary reflex Doppler shifts from stellar variability in the wavelength domain. , keywords =. doi:10.1093/mnras/stab1323 , archivePrefix =. 2011.00018 , primaryClass =
Pith/arXiv arXiv 2011
This paper was first reviewed by deepseek-v4-flash on August 4, 2026.
discussion (0)
Sign in with ORCID, Apple, or X to comment. Anyone can read and Pith papers without signing in.