REVIEW 3 major objections 5 minor 55 references
Temporal Tracking of Reeb-Space Sheets
T0 review · 3 major / 5 minor · reviewed 2026-08-07 · deepseek-v4-flash
Pith's one-line read The paper claims that Reeb-space sheets—the two-dimensional cells of a bivariate field's fiber-connectivity quotient—are trackable across time using range-footprint overlap plus domain support, demonstrated on a torus and…
desk verdict First Reeb-space-sheet tracking workflow, honestly presented but qualitatively evaluated and coordinate-dependent. read the letter →
The pith
A machine-rendered reading of the paper's core claim, the machinery that carries it, and where it could break.
The reading
What carries the argument
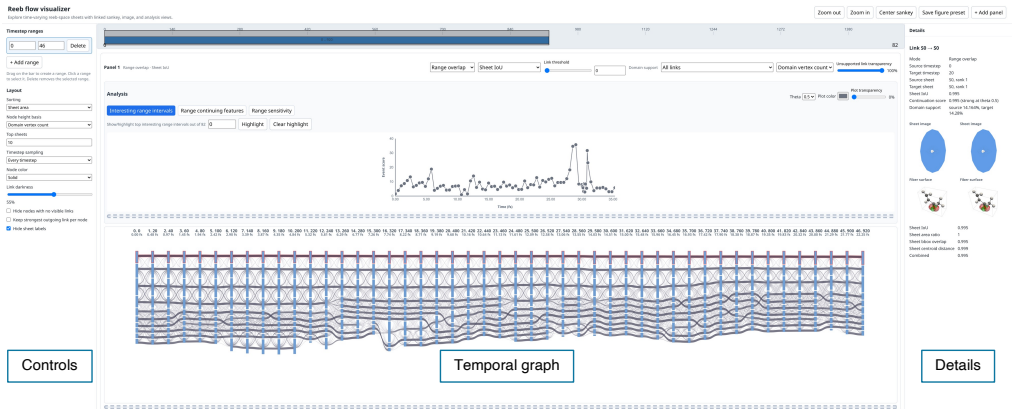
The central object is the Reeb space sheet: a two-dimensional cell of the quotient space $R_F = M/{\sim}$ obtained by collapsing each connected component of every fiber $F^{-1}(a,b)$ to a point. Each sheet is stored as a polygonal footprint in the bivariate range, along with its range-space area and the set of regular domain vertices that support it. The argument is carried by a pairwise correspondence mechanism between consecutive timesteps: range-space intersection-over-union overlap serves as the active similarity score, raw domain vertex overlap serves as auxiliary support for filtering ambiguous matches, and an event score $E_i(\theta)$ counts weak best continuations plus potential split and merge configurations to rank intervals of temporal change. A greedy lifetime diagnostic then follows the best above-threshold continuation from each sheet, producing the continuing-feature lists shown in the temporal graph.
What would settle it
Take a controlled sequence where a single known sheet moves in the bivariate range by more than its own width between consecutive frames while its spatial support stays intact: the range overlap score is zero, so the greedy track stops even though the feature persists. Running this with the torus pipeline by increasing the deformation between frames would show the exact sampling density at which sheet tracking fails, testing the paper's core assumption directly.
Extended reading notes
Core claim
The paper's central claim is that Reeb space sheets can serve as trackable topological structures in time-varying bivariate fields. The authors compute the Reeb space of each bivariate field $F=(f,g)$ at every timestep, rank sheets by their range-space area, and retain the top $N$. Sheets in adjacent timesteps are then compared by the range-footprint overlap $q_R(S,S') = |S \cap S'|/|S \cup S'|$, supplemented by the raw overlap of their associated domain vertex sets $O(S,S')=|\Omega_S \cap \Omega_{S'}|$. Because a sheet can split, merge, appear, disappear, and overlap many possible targets, the method keeps multiple candidate correspondences instead of forcing a one-to-one matching. The authors show that on the torus sequence the temporal graph is nearly symmetric and the event-score plot highlights the known central transition and the merge/split intervals, and that on MVK and cis-stilbene the flagged intervals coincide with chemically relevant periods reported in earlier work.
Load-bearing premise
The method assumes that consecutive timesteps are sampled densely enough that a persistent sheet keeps roughly the same footprint in the bivariate range; if the field changes too quickly between frames, the overlap score falls below threshold and the track breaks, so the entire tracking result rests on temporal sampling density.
Editorial extensions
If this is right
- Reeb space sheets can be linked across long sequences: on MVK three sheets persist through all 83 timesteps and correspond to interpretable molecular regions near the oxygen atom, the C1–C2 bond, and C3.
- Event-score peaks single out transition intervals such as torus intervals 18–19 and 81–82, and the cis-stilbene interval 288.21–288.33 fs that coincides with a pronounced rotation of the Reeb space in the range.
- Because correspondences are pairwise and non-conserved, the temporal graph can represent splits, merges, appearances, disappearances, and geometric changes without imposing a one-to-one matching.
- Domain overlap disambiguates range-space look-alikes: in the torus interval 18–19, sheets with nearly identical range footprints are resolved into the correct spatial continuations using shared domain vertices.
- Event-score rankings are stable across tested thresholds for the main highlighted intervals, supporting their use as an entry point for exploring long sequences such as the 704-timestep cis-stilbene dataset.
Reading between the lines
- The same range-footprint overlap plus domain-support recipe could be applied to any sheet-like cell complex derived from a bivariate map—not only exact Reeb spaces but also coarser summaries—since only footprints and vertex supports are needed; the paper does not make this generalization.
- Because event scores are cheap once correspondences are built, they could serve as a pre-filter that selects where to spend expensive Reeb-space computation or finer temporal sampling in a longer simulation; the paper uses them for visual ranking rather than for steering computation.
- Replacing the greedy lifetime diagnostic with a jointly optimized assignment across all timesteps would turn persistent-sheet status from a local heuristic into a globally defined track; comparing the two on the torus ground truth would show how often greedy choices diverge.
- The cis-stilbene domain-support drift suggests that range-space identity and spatial support can decouple; quantifying that decoupling per track could provide a new diagnostic for physical or chemical reorganization that the paper leaves for future work.
Editorial analysis
A structured set of objections, weighed in public.
Referee Report
Summary. The paper proposes a framework for temporally tracking Reeb-space sheets in time-varying bivariate fields. At each timestep, Reeb spaces are computed and prominent sheets are selected by range-space area. Correspondences between consecutive timesteps are established with a range-space Jaccard (intersection-over-union) score, supplemented by raw domain-vertex overlap as supporting evidence. The resulting weighted temporal graph is visualized with a Sankey-style layout, and heuristic event scores are defined to highlight intervals of weak or ambiguous correspondence. The method is evaluated qualitatively on a synthetic bivariate torus sequence, on two MVK excited-state trajectories, and on a cis-stilbene trajectory, with an accompanying interactive prototype. The central claim is that Reeb-space sheets can serve as trackable topological structures for visual analysis.
Significance. If the claim holds, the paper fills a genuine gap: no existing method explicitly tracks Reeb-space sheets over time, and the proposed workflow is concrete, clearly described, and accompanied by a usable prototype and precomputed artifacts. The authors are also unusually explicit about the heuristic nature of their correspondence measure and about the method's limitations, which is commendable. The main significance, however, is conditioned on the range-space IoU score being a meaningful and sufficiently stable notion of sheet identity. Because that score is not invariant under monotone reparameterization of the individual scalar fields, the paper's stronger 'topological tracking' claim is currently overstated. The evaluation is entirely qualitative, which is acceptable for a visualization paper but does not by itself establish quantitative tracking reliability.
major comments (3)
- [Section 4.3, Eq. (1)] The range-space correspondence score q_R(S,S') = |S∩S'|/|S∪S'| is not invariant under monotone reparameterizations of the individual scalar coordinates. A strictly increasing map h applied to g leaves the Reeb space quotient R_F unchanged as a topological object, but transforms sheet footprints in the range by (a,b) -> (a,h(b)). Areas, intersections, and unions then change non-uniformly, so q_R, the top-N sheet selection by range-space area (Section 4.2), the event score E_i(θ) (Section 4.4), and the reported event intervals (e.g., 18–19, 50–51, 81–82 for the torus) all become functions of the chosen coordinate system. The paper does not discuss this dependence, even though the molecular datasets use NTO fields whose units and scaling are convention-dependent. This is load-bearing for the abstract claim that sheets are 'trackable topological structures'. Please either adopt coordinate-invariant descriptors, explicitly frame the results as conditional on a fixed range-space coordinate convention and demonstrate robustness under monotone rescaling, or soften the 'topological' language to 'range-space-geometric' tracking.
- [Section 5] The evaluation is entirely qualitative. The torus experiment demonstrates face validity by recovering expected symmetry and the merge/split at intervals 18–19 and 81–82, but no quantitative ground-truth comparison is provided: there are no tracking accuracy scores, no precision/recall for detected event intervals, no error bars, and no comparison against a baseline (e.g., domain-overlap-only tracking, centroid-based matching, or optimal-transport matching). The central claim that the method 'can track Reeb space sheets meaningfully over long sequences' (Section 7) rests on visual inspection of Figures 1, 3–9 and on agreement with previously reported chemical intervals. I ask for at least one quantitative sanity check on the torus dataset, where the expected event intervals are known, and ideally a small baseline comparison on the same dataset.
- [Section 4.4 and Supplement Table 1] The threshold sensitivity statement in the main text is stronger than the data support. The supplement's Table 1 shows that the top event interval for MVK state 2 shifts from 28.06–28.54 fs at θ=0.3 and 0.4 to 27.58–28.06 fs at θ=0.5–0.7, and for cis-stilbene the top interval changes from 243.82–244.31 fs at θ=0.3 to 288.21–288.33 fs at θ≥0.4. The text in Section 5.2 says the 27–30 fs interval is 'robustly highlighted,' and Section 5.3 calls the 288.21–288.33 fs interval 'stable under threshold variation.' These claims should be qualified with the observed shifts, and the main paper should summarize the sensitivity table rather than only placing it in the supplement.
minor comments (5)
- [Figure 1 caption] The caption reads 'the100timestep sequence' with a missing space; should be 'the 100 timestep sequence'.
- [Section 5.3 and Figure 9] The local graph in Figure 9 uses a link threshold of 0.41 for range-space similarity, but the choice of 0.41 is not explained. Please state how this value was selected and whether the conclusions are sensitive to it.
- [Section 3] The definition of a generic bivariate field is given, but the paper never states whether all tested datasets satisfy genericity or how the Reeb-space computation handles violations (e.g., degenerate vertices). A brief remark would help reproducibility.
- [References] Reference [9] is incomplete: it gives the title and authors but no publication venue, page numbers, or DOI. Reference [20] also lacks a venue; please complete the bibliographic entries.
- [Section 7, limitations] The fourth limitation states that the continuing feature diagnostic is greedy and local, and the fifth notes the lack of evaluation on large-scale data. These are appropriate caveats, but consider moving the sensitivity caveat from the supplement into this section as well, since it directly affects the interpretation of the reported event intervals.
Circularity Check
No significant circularity: the tracking scores, event summaries, and validation are computed from independently defined sheet geometry and domain support, with no fitted quantity disguised as a prediction.
full rationale
The paper is a heuristic visualization and tracking framework, not a derivation of a predicted quantity from fitted inputs. The range-space score q_R(S,S') = |S∩S'|/|S∪S'| is defined directly on sheet footprints, and the domain overlap O(S,S') is defined directly on associated vertex sets; neither quantity is defined in terms of the event scores or tracks it is used to produce. The event score E_i(θ) is a transparent aggregation of weak-outgoing, weak-incoming, split, and merge counts computed from q_R, and the paper explicitly labels it and the correspondence measure as heuristics rather than theoretical guarantees. The torus validation uses a known ground truth (symmetry about timestep 50, merge at 18–19, split at 81–82) and does not fit parameters to those known events; the reported intervals are outputs of the pre-specified scoring rule. The molecular case studies reference prior analyses by overlapping authors [40,52] for qualitative agreement, but those citations are corroborative rather than load-bearing: the temporal graph, event scores, and sheet renderings are computed independently by the paper's own pipeline. Reeb-space computation cites the authors' earlier algorithms [19,20] as implementation machinery, not as evidence for the central tracking claim. The skeptic's coordinate-dependence concern about range-space IoU is a legitimate robustness limitation and an unstated convention issue, but it is not circularity: a non-invariant similarity measure is still a measure of the paper's chosen representation, not an input that has been renamed as an output. No step in the derivation chain reduces, by construction, to its own input, so the circularity score is 0.
Assumptions & free parameters
free parameters (3)
- Top sheet count N =
20
- Threshold theta =
0.5
- Raster grid resolution for range-space IoU
assumptions (4)
- standard math Generic PL bivariate maps: no three vertices collinear, no three edges concurrent
- domain assumption Field pairs are consistently defined across the sequence, so scalar quantities are comparable over time
- domain assumption Adjacent timesteps are sampled densely enough that persistent sheets retain similar range-space footprints
- domain assumption Range-space area is an appropriate proxy for feature significance, analogous to persistence
Cite this review
Pith. "Pith review of Temporal Tracking of Reeb-Space Sheets." pith.science (2026). https://pith.science/paper/OKBK2PLL
@misc{pith2026260805837,
  author       = {Pith},
  title        = {Pith review of: Temporal Tracking of Reeb-Space Sheets},
  year         = {2026},
  howpublished = {\url{https://pith.science/paper/OKBK2PLL}},
  note         = {Machine review of arXiv:2608.05837}
}
read the original abstract
Time-varying bivariate fields arise in many scientific applications, where the relationship between two scalar quantities evolves over time. While topological methods such as merge trees provide an effective framework for identifying and tracking features in univariate data, analogous approaches for bivariate fields remain comparatively underexplored. Reeb spaces extend topological analysis to multivariate data by representing fiber connectivity through a collection of interconnected sheets, making these sheets natural candidates for describing bivariate structures. However, establishing temporal correspondences between sheets is challenging due to the structural complexity of Reeb spaces, sensitivity to noise, and the difficulty of defining meaningful similarity measures across timesteps. We present a framework for tracking Reeb space sheets in time-varying bivariate fields. The method establishes correspondences between sheets in consecutive timesteps using complementary similarity measures defined in the spatial domain and the range space. We evaluate the method on a synthetic torus dataset and two time-varying molecular electronic structure datasets. The results show that Reeb space sheet tracking reveals persistent structures and highlights interesting intervals of temporal change. Overall, the results demonstrate that Reeb space sheets can serve as trackable topological structures and provide a foundation for the visual analysis of time-varying bivariate data.
Figures


Figures from the paper (10 more)




Reference graph
Works this paper leans on
-
[2]
T. M. Athawale, C. R. Johnson, S. Sane, and D. Pugmire. Fiber uncer- tainty visualization for bivariate data with parametric and nonparamet- ric noise models.IEEE Transactions on Visualization and Computer Graphics, 29(1):613–623, 2023. doi: 10.1109/TVCG.2022.3209424 2
arXiv 2023
-
[3]
S. Bachthaler and D. Weiskopf. Continuous scatterplots.IEEE Trans- actions on Visualization and Computer Graphics (Proceedings Visu- alization 2008), 14(6):1428–1436, 2008. 1
work page 2008
- [4]
-
[5]
A. Brown, O. Bobrowski, E. Munch, and B. Wang. Probabilistic con- vergence and stability of random mapper graphs.Journal of Applied and Computational Topology, 5(99):140, 2021. doi: 10.1007/s41468 -020-00063-x 2
doi:10.1007/s41468 2021
-
[6]
H. Carr and D. Duke. Joint contour nets.IEEE Transactions On Visualization And Computer Graphics, 20(8):1100–13, 2014. 2
work page 2014
-
[7]
H. Carr, Z. Geng, J. Tierny, A. Chattopadhyay, and A. Knoll. Fiber surfaces: Generalizing isosurfaces to bivariate data.Computer Graph- ics Forum, 34(3):241–250, 2015. 3
work page 2015
-
[8]
A. Chattopadhyay, H. Carr, D. Duke, and Z. Geng. Extracting Ja- cobi Structures in Reeb Spaces. In N. Elmqvist, M. Hlawitschka, and J. Kennedy, eds.,EuroVis - Short Papers. The Eurographics Associa- tion, 2014. doi: 10.2312/eurovisshort.20141156 3
-
[9]
A. Chattopadhyay, Y . Ramamurthi, and O. Saeki. An Algorithm for Fast and Correct Computation of Reeb Spaces for PL Bivariate Fields. 2
Show all 55 references
-
[10]
Cohen-Steiner, H
D. Cohen-Steiner, H. Edelsbrunner, J. Harer, and Y . Mileyko. Lips- chitz functions havel p-stable persistence.Foundations of Computa- tional Mathematics, 10(2):127–139, 2010. 2
2010
-
[11]
S. Das, R. Sridharamurthy, and V . Natarajan. Time-varying extremum graphs.Computer Graphics Forum, 43(6), 2024. doi: 10.1111/cgf. 15162 2
2024 doi
-
[12]
T. K. Dey, F. M ´emoli, and Y . Wang. Mutiscale mapper: A framework for topological summarization of data and maps. InProceedings of the 27th annual ACM-SIAM symposium on Discrete algorithms, pp. 997–1013, 2016. 2
2016
-
[13]
Dobler and M
A. Dobler and M. N ¨ollenburg. Improving temporal treemaps by min- imizing crossings.Computer Graphics Forum, 43(3):e15087, 2024. doi: 10.1111/cgf.15087 3
2024 doi
-
[14]
Edelsbrunner and J
H. Edelsbrunner and J. Harer. Jacobi sets of multiple Morse func- tions. In F. Cucker, R. DeV ore, P. Olver, and E. Sueli, eds.,Founda- tions of Computational Mathematics, Minneapolis 2002, pp. 37–57. Cambridge Universtiy Press, 2004. 2
2002
-
[15]
Edelsbrunner, J
H. Edelsbrunner, J. Harer, and A. K. Patel. Reeb spaces of piece- wise linear mappings. InProceedings of the Twenty-Fourth Annual Symposium on Computational Geometry, SCG ’08, pp. 242–250. As- sociation for Computing Machinery, New York, NY , USA, 2008. doi: 10.1145/1377676.13...
2008
-
[16]
Engelke, T
W. Engelke, T. B. Masood, J. Beran, R. Caballero, and I. Hotz. Topology-Based Feature Design and Tracking for Multi-Center Cy- clones. In I. Hotz, T. B. Masood, F. Sadlo, and J. Tierny, eds.,Topo- logical Methods in Data Analysis and Visualization VI: Theory, Appli- cations an...
2021 doi
-
[17]
Evers, A
M. Evers, A. Naseer, T. G. Murthy, V . Natarajan, T. B. Masood, D. Weiskopf, and I. Hotz. Uncertainty-aware visual analysis of force networks in 2d granular materials.Computer Graphics Forum, 45(3),
-
[18]
Hristov, I
P. Hristov, I. Hotz, and T. B. Masood. Robust geometric predicates for bivariate computational topology. In2025 Topological Data Analysis and Visualization (TopoInVis), 2025. doi: 10.1109/TopoInVis68599. 2025.00011 2, 3
2025
-
[19]
Hristov, I
P. Hristov, I. Hotz, and T. B. Masood. Singular Arrange and Tra- verse Algorithm for Computing Reeb Spaces of Bivariate PL Maps. In H.-K. Ahn, M. Hoffmann, and A. Nayyeri, eds.,42nd International Symposium on Computational Geometry (SoCG 2026), vol. 367 of Leibniz Internationa...
2026 doi
-
[20]
Hristov, D
P. Hristov, D. Sakurai, H. Carr, I. Hotz, and T. B. Masood. Arrange and traverse algorithm for computation of reeb spaces of piecewise linear maps. doi: 10.1111/cgf.70206 2, 3, 8
-
[21]
P. G. Hristov.Hypersweeps, Convective Clouds and Reeb Spaces. PhD thesis, University of Leeds, June 2022. 3
2022
-
[22]
K ¨opp and T
W. K ¨opp and T. Weinkauf. Temporal treemaps: Static visualization of evolving trees.IEEE Transactions on Visualization and Computer Graphics, 25(1):534–543, 2019. doi: 10.1109/TVCG.2018.2865265 3
2019
-
[23]
M. Li, C. Storm, A. Y . Li, T. Needham, and B. Wang. Comparing morse complexes using optimal transport: An experimental study. In IEEE Visualization Conference (IEEE VIS) Short Paper, 2023. doi: 10 .48550/arXiv.2309.04681 2
2023 arXiv
-
[24]
M. Li, X. Yan, L. Yan, T. Needham, and B. Wang. Flexible and probabilistic topology tracking with partial optimal transport. IEEE Transactions on Visualization and Computer Graphics (TVCG), 31(10):7951–7969, 2025. doi: 10.1109/TVCG.2025.3561300 2
2025
-
[25]
Lukasczyk, G
J. Lukasczyk, G. Weber, R. Maciejewski, C. Garth, and H. Leitte. Nested tracking graphs. InComputer Graphics Forum, vol. 36, pp. 12–22. Wiley Online Library, 2017. 2
2017
-
[26]
R. L. Martin. Natural transition orbitals.The Journal of Chemical Physics, 118(11):4775–4777, 02 2003. doi: 10.1063/1.1558471 7
2003 doi
-
[28]
Nilsson, J
E. Nilsson, J. Lukasczyk, T. B. Masood, C. Garth, and I. Hotz. Prob- abilistic gradient-based extrema tracking. In2023 Topological Data Analysis and Visualization (TopoInVis), pp. 72–81. IEEE, 2023. doi: 10.1109/TopoInVis60193.2023.00014 2
2023
-
[29]
F. H. Post. The state of the art in flow visualization: Feature extraction and tracking.Computer Graphics Forum, 22(4):775–792, 2003. 2
2003
-
[30]
Ramamurthi, T
Y . Ramamurthi, T. Agarwal, and A. Chattopadhyay. A topological similarity measure between multi-resolution reeb spaces.IEEE Trans- actions on Visualization and Computer Graphics, 28(12):4360–4374, Dec. 2022. doi: 10.1109/tvcg.2021.3087273 2
2022
-
[31]
Ramamurthi and A
Y . Ramamurthi and A. Chattopadhyay. A topological distance between multi-fields based on multi-dimensional persistence dia- grams.IEEE Transactions on Visualization and Computer Graphics, 30(9):5939–5952, 2024. doi: 10.1109/tvcg.2023.3314763 2
2024
-
[32]
Rasheed, D
F. Rasheed, D. J ¨onsson, E. Nilsson, T. B. Masood, and I. Hotz. Subject-specific brain activity analysis in fmri data using merge trees. InTopological Methods in Visualization, IEEE workshop, 2022. doi: 10.1109/TopoInVis57755.2022.00018 2
2022
- [33]
-
[34]
Reininghaus, N
J. Reininghaus, N. Kotava, D. G ¨unther, J. Kasten, H. Hagen, and I. Hotz. A Scale Space Based Persistence Measure for Critical Points in 2D Scalar Fields.IEEE Transaction on Visualization and Computer Graphics, 17(12):2045–2052, 2011. 2
2011
-
[35]
Saikia and T
H. Saikia and T. Weinkauf. Global feature tracking and similarity es- timation in time-dependent scalar fields.Computer Graphics Forum, 36(3):1–11, 2017. doi: 10.1111/cgf.13163 2
2017 doi
-
[36]
Samtaney, D
R. Samtaney, D. Silver, N. Zabusky, and J. Cao. Visualizing Features and Tracking their Evolution.Computer, 27:20–27, 1994. 2
1994
-
[37]
S. Sane, T. M. Athawale, and C. R. Johnson. Visualization of Uncer- tain Multivariate Data via Feature Confidence Level-Sets. In M. Agus, C. Garth, and A. Kerren, eds.,EuroVis 2021 - Short Papers. The Eu- rographics Association, 2021. doi: 10.2312/evs.20211053 2
2021 doi
-
[38]
Schneider, A
D. Schneider, A. Wiebel, H. Carr, M. Hlawitschka, and G. Scheuer- mann. Interactive comparison of scalar fields based on largest con- tours with applications to flow visualization.IEEE Transactions on Visualization and Computer Graphics, 14(6):1475–1482, 2008. doi: 10.1109/TVC...
2008 doi
-
[39]
Schnorr, D
A. Schnorr, D. N. Helmrich, D. Denker, T. W. Kuhlen, and B. Hentschesol. Feature tracking by two-step optimization.IEEE Transactions on Visualization and Computer Graphics (TVCG), 26(6),
-
[40]
Sharma, T
M. Sharma, T. B. Masood, N. H. List, I. Hotz, and V . Natarajan. Con- tinuous scatterplot and image moments for time-varying bivariate field analysis of electronic structure evolution.IEEE Transactions on Vi- sualization and Computer Graphics, pp. 1–14, 2025. doi: 10.1109/ TVC...
2025
-
[41]
Sharma, T
M. Sharma, T. B. Masood, S. S. Thygesen, M. Linares, I. Hotz, and V . Natarajan. Segmentation driven peeling for visual analysis of elec- tronic transitions. In2021 IEEE Visualization Conference (VIS), pp. 96–100, 2021. doi: 10.1109/VIS49827.2021.9623300 1
2021
-
[42]
Silver and X
D. Silver and X. Wang. Tracking scalar features in unstructured data sets. InProceedings Visualization’98 (Cat. No. 98CB36276), pp. 79–
-
[43]
Soler, M
M. Soler, M. Plainchault, B. Conche, and J. Tierny. Lifted wasserstein matcher for fast and robust topology tracking. InIEEE 8th Sympo- sium on Large Data Analysis and Visualization (LDAV), 2018. doi: 10 .1109/LDA V.2018.8739196. 2
2018
-
[44]
Sridharamurthy, T
R. Sridharamurthy, T. B. Masood, A. Kamakshidasan, and V . Natara- jan. Edit distance between merge trees.IEEE Transactions on Visu- alization and Computer Graphics (TVCG), 26(3):1518–1531, 2020. doi: 10.1109/TVCG.2018.2873612 2
2020
-
[45]
Tierny and H
J. Tierny and H. Carr. Jacobi fiber surfaces for bivariate reeb space computation.IEEE Transactions on Visualization and Computer Graphics, 23(1):960–969, 2017. 2
2017
-
[46]
Tierny and H
J. Tierny and H. Carr. Jacobi fiber surfaces for bivariate reeb space computation.IEEE Transactions on Visualization and Computer Graphics (TVCG), 23(1):960–969, 2017. 3
2017
-
[47]
A. A. Valsangkar, J. M. Monteiro, V . Narayanan, I. Hotz, and V . Natarajan. An exploratory framework for cyclone identification and tracking.IEEE Transaction on Visualization and Computer Graphics, 25(3):1460–1473, 2019. 2
2019
-
[48]
Weber, P.-T
G. Weber, P.-T. Bremer, M. S. Day, J. B. Bell, and V . Pascucci. Fea- ture tracking using reeb graphs. InTopological Methods in Data Analysis and Visualization. Theory, Algorithms, and Applications. (TopoInVis’09), 2011. 2
2011
-
[49]
Weinkauf, H
T. Weinkauf, H. Theisel, A. Van Gelder, and A. Pang. Stable fea- ture flow fields.IEEE Transactions on Visualization and Computer Graphics, 17(6):770–780, 2011. 2
2011
-
[50]
Wetzels, H
F. Wetzels, H. Leitte, and C. Garth. Branch decomposition- independent edit distances for merge trees.Computer Graphics Fo- rum, 2022. doi: doi.org/10.1111/cgf.14547 2
2022 doi
-
[51]
Wetzels, T
F. Wetzels, T. B. Masood, N. H. List, I. Hotz, and C. Garth. Exploring Electron Density Evolution using Merge Tree Mappings. In C. Tomin- ski, M. Waldner, and B. Wang, eds.,EuroVis 2024 - Short Papers. The Eurographics Association, 2024. doi: 10.2312/evs.20241069 2
2024 doi
-
[52]
Wetzels, T
F. Wetzels, T. B. Masood, N. H. List, I. Hotz, and C. Garth. Exploring electron density evolution using merge tree mappings. In C. Tomin- ski, M. Waldner, and B. Wang, eds.,26th Eurographics Conference on Visualization, EuroVis 2024 - Short Papers, Odense, Denmark, May 27-31, ...
2024 doi
-
[53]
Wetzels, M
F. Wetzels, M. Pont, J. Tierny, and C. Garth. Merge tree geodesics and barycenters with path mappings.IEEE Transactions on Visualiza- tion and Computer Graphics, 30(1):1095–1105, 2024. doi: 10.1109/ TVCG.2023.3326601 2
2024
-
[54]
Widanagamaachchi, C
W. Widanagamaachchi, C. Christensen, V . Pascucci, and P.-T. Bremer. Interactive exploration of large-scale time-varying data using dynamic tracking graphs. InIEEE Symposium on Large Data Analysis and Visualization (LDAV’12), pp. 9–17, 2012. 2
2012
-
[55]
L. Yan, T. Bin Masood, F. Rasheed, I. Hotz, and B. Wang. Geometry aware merge tree comparisons for time-varying data with interleaving distances.IEEE Transactions on Visualization and Computer Graph- ics, pp. 1–1, 2022. doi: 10.1109/TVCG.2022.3163349 2
2022
-
[56]
L. Yan, T. B. Masood, R. Sridharamurthy, F. Rasheed, V . Natara- jan, I. Hotz, and B. Wang. Scalar field comparison with topologi- cal descriptors: Properties and applications for scientific visualization. Computer Graphics Forum, 40(3):599–633, 2021. doi: 10.1111/cgf. 14331 2...
2021
-
[2020]
doi: 10.1109/TVCG.2018.2883630 2
2018
Reviewed August 7, 2026 · model on record in the stance chip above.
Discussion (0). Continue with ORCID to comment.