REVIEW 3 major objections 5 minor 52 references
SwissCrop25: A National Multi-Year Benchmark for Operational Crop Mapping
T0 review · 3 major / 5 minor · reviewed 2026-08-11 · deepseek-v4-flash
Pith's one-line read Seven-year national crop benchmark shows a 12-point model gap
desk verdict SwissCrop25 is a genuinely new and well-built benchmark; the headline model gap is real but likely inflated by test-set configuration selection, so treat the rankings as provisional. read the letter →
The pith
A machine-rendered reading of the paper's core claim, the machinery that carries it, and where it could break.
The reading
What carries the argument
The central object is the SwissCrop25 benchmark itself, with its leave-one-year-out (LOYO) protocol: five folds, each holding out one complete growing season for testing, using the immediately preceding year for validation, and training on the remaining years. The label space pairs a 73-class crop taxonomy with five non-crop land-cover classes rasterised at 10 m by fractional coverage. The distinctive mechanism for temporal generalisation is cumulative growing degree days (GDD), heat accumulated above 0 °C from 1 January, which supports two interventions: T3S, which re-samples observations into equal thermal-time bins, and thermal positional encoding (TPE), which replaces calendar-day positions with a sinusoidal function of GDD. These align equivalent phenological stages across years and let the authors attribute part of the cross-year error to weather-driven phenological shifts.
What would settle it
Take a random sample of SwissCrop25 parcels and compare each declared label with the crop actually harvested or observed on the ground; if the disagreement rate, especially for silage versus grain maize and the meadow management classes, is large enough to shift per-class IoU by more than a few points, the reported rankings and rare-class findings would need revision.
Extended reading notes
Core claim
The paper's discovery is that evaluation design changes which crop-mapping model looks best. On SwissCrop25, all three architectures score within about five percentage points on coarse three-class land-use categories and on overall accuracy, but the ranking opens sharply as the taxonomy deepens: at the 65-class leaf level TSViT leads U-TAE by 12.3 percentage points macro-mIoU and by 15 points macro-F1. Joint cropland delineation shows all models miss 8–11% of agricultural area, a systematic shortfall hidden by benchmarks that assume a perfect cropland mask. The 2024 split, with an anomalously warm winter, is hardest for every model, and re-indexing the time series by cumulative growing degree days plus thermal positional encoding recovers minority winter cereals such as Triticale and Rye. In-season evaluation shows a timing trade-off: U-TAE is stronger early in the season, while TSViT overtakes later through rare-class discrimination.
Load-bearing premise
Every conclusion in the benchmark rests on treating farmers' annual declared land-use intentions as true end-of-season crop labels at 10 m resolution, which the paper does not verify against field checks or harvest records.
Editorial extensions
If this is right
- Operational crop-mapping systems evaluated on SwissCrop25's leave-one-year-out splits get a realistic estimate of how they will perform on a future growing season, including weather-driven distribution shifts.
- Rankings produced by single-year benchmarks or benchmarks that assume a predefined cropland mask are unreliable indicators of operational performance.
- Adding temperature-derived phenological information improves cross-year robustness for spatio-temporal transformer models, including recovery of minority winter cereals in anomalously warm years.
- In-season deployment should match the model to the deadline: U-TAE is preferable early in the season, while TSViT is preferable later when rare-class accuracy matters.
- Earth-observation foundation models, at least at the evaluated scale, are not competitive with domain-specific crop mapping models on this benchmark even after fine-tuning.
Reading between the lines
- The administrative labels the authors flag as noisy could be reused as a known-noise testbed: errors such as grain-versus-silage maize are partly declared-intent mistakes, so a model's confusion pattern on those classes quantifies label noise rather than pure spectral similarity.
- The crop-agnostic base temperature of 0 °C for GDD may blunt phenological alignment for warm-season crops; using crop-group-specific thermal time could widen the robustness gains the paper observes.
- A natural next benchmark variant would hold out a geographic region as well as a year, testing whether temperature-based alignment transfers to landscapes the model has never seen.
- The early-season/late-season trade-off suggests a deployment system could switch from U-TAE to TSViT as the season progresses, though the authors do not test such a hybrid.
Editorial analysis
A structured set of objections, weighed in public.
Referee Report
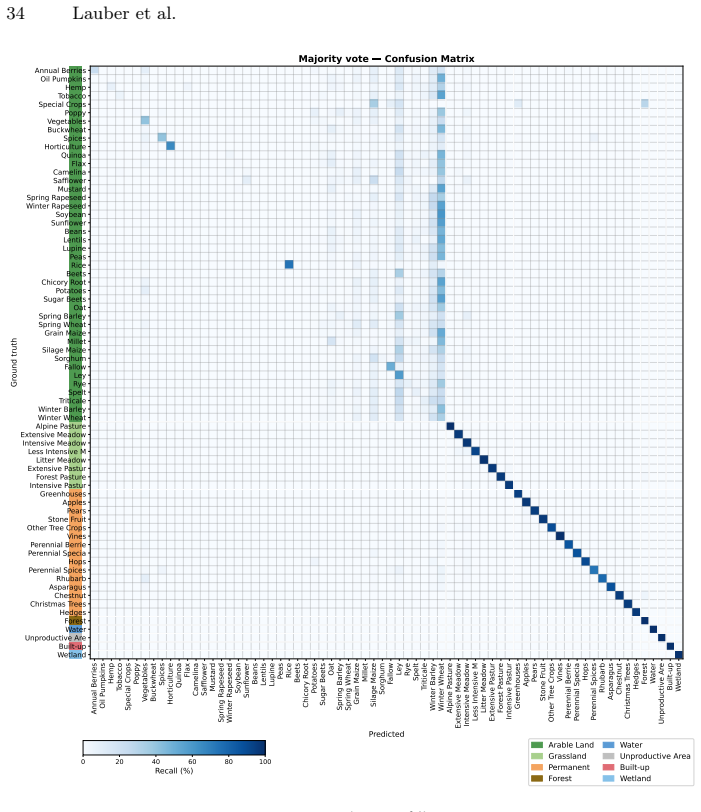
Summary. This paper introduces SwissCrop25, a national-scale crop mapping benchmark for Switzerland covering the 2019–2025 growing seasons, with Sentinel-2 time series, daily temperature/GDD data, a label space of 73 agricultural classes plus 5 non-crop land-cover classes, and a leave-one-year-out (LOYO) evaluation protocol that jointly evaluates cropland delineation and fine-grained crop classification. The authors benchmark U-TAE, TSViT, and Galileo (nano/base, fine-tuned and frozen), with and without thermal-time sampling (T3S) and thermal positional encoding (TPE). The headline results are that TSViT reaches 48.1% macro-mIoU versus 35.8% for U-TAE and 30.4% for Galileo-nano; that TPE improves TSViT substantially (+10.7pp mIoU) but U-TAE only marginally (+1.2pp); and that U-TAE leads early in the season while TSViT gains a late-season advantage on rare classes. The dataset and code are publicly released.
Significance. SwissCrop25 is potentially a valuable community resource: it is, to my knowledge, the first pixel-level multi-year national crop mapping dataset with a strict LOYO protocol, explicit non-crop classes derived from independent land-cover data, fine-grained grassland management types, and accompanying temperature data. The paper's strengths include the public data release, the reproducible preprocessing pipeline, per-class results and confusion matrices in the supplement, naive temporal baselines that contextualize the LOYO protocol, and the in-season evaluation framework. The central scientific claims, however, rest on two points that need further support: the configuration-selection protocol behind the headline numbers, and the unquantified label noise of the administrative ground truth. If those points are addressed, the benchmark and its evaluation would be a solid contribution to operational crop mapping.
major comments (3)
- [Section 4, Tables 3 and 4] The headline results in Table 3 use the best-performing configuration per architecture, selected on the LOYO test years (T3S+TPE for U-TAE and TSViT, T3S alone for Galileo-nano). Because Table 4 shows that TPE improves TSViT by +10.7pp mIoU but only +1.2pp for U-TAE, the reported 12.3pp TSViT–U-TAE gap (48.1 vs 35.8) is at least partly a consequence of a configuration choice made after seeing test-set outcomes, rather than a property of the architectures alone. This also inflates the claim that temperature-derived phenological information improves robustness. I ask the authors to report the comparison under a common configuration (e.g., the DOY baseline or T3S alone for all models) and, if TPE is retained in the headline, to select it using only the validation year in each LOYO split and to state that selection rule explicitly.
- [Section 3.1 and Supp. Tab. 10] The LNF labels record declared planting intent, not verified end-of-season crop type, and the paper acknowledges this but does not quantify the resulting label noise. Since the benchmark's distinctive claims concern fine-grained and rare classes (e.g., Sorghum 30.9 vs 4.8, Hemp 17.7 vs 0.0, Rye 67.6 vs 55.4 in Supp. Tab. 10), unquantified and possibly non-random administrative errors could drive part of the observed per-class differences. Please provide at least one of the following: (a) a validation subset compared against field inspections or harvest records, (b) a label-noise sensitivity analysis that perturbs the administrative labels and re-runs the benchmark, or (c) an explicit per-class noise model with reasonable bounds. Without this, the central claim that the benchmark reveals differences in crop mapping skill is not fully established.
- [Section 4.2, Table 4] The asymmetric effect of thermal positional encoding is surprisingly large and model-specific: TPE adds +10.7pp mIoU for TSViT but only +1.2pp for U-TAE. This asymmetry is load-bearing for the temporal-generalisation claim, but the paper does not analyse what TPE actually changes (e.g., whether the effect interacts with T3S sampling, with the variable-length sequence handling, or with the class-token attention). Please add an ablation that separates the effect of TPE from the effect of T3S, and report the per-split behaviour in the main text rather than only in the supplement, so readers can judge whether the benefit is a genuine phenological alignment effect or a configuration-dependent interaction.
minor comments (5)
- [Abstract and Section 3.1] The abstract states a '73 crop taxonomy' while Section 3.1 defines 78 labels (73 agricultural + 5 non-crop), and the experiments use 70 modelled classes (65 crops + 5 non-crop). Please use a single consistent set of class counts throughout.
- [Section 4.2, Table 4] The caption says Galileo-nano cannot use Thermal PE because its pretrained positional encoding is month-based, but the main text does not explain this constraint before presenting the results; please introduce it in the setup paragraph for clarity.
- [Section 4.4] The AUC in the in-season analysis is described as the area under the in-season performance curve across twelve monthly cutoffs, but the integration rule (trapezoidal, step, or other) is not specified; please state it.
- [Section 4, Setup] All models are trained with a fixed seed (7777) and no seed variance is reported. A sentence acknowledging that all numbers are single-seed estimates and pointing to the seed in the released code would improve the reproducibility statement.
- [Supp. Tab. 3] The mask evaluation claims that errors are predominantly false negatives, but the per-split mask precision/recall are only given in the supplement; consider reporting per-split mask IoU or recall in the main paper to support this claim.
Circularity Check
No significant circularity: the SwissCrop25 benchmark, LOYO protocol, and model comparisons are derived from external data and open evaluation, with the only self-citation (T3S) ablated against external methods.
full rationale
The paper's central claims are benchmark observations, not derivations from fitted quantities. The labels come from the external LNF/FOAG administrative register and swissTLM3D; the imagery and temperature data are independent external sources; the LOYO splits are calendar-year holdouts with the preceding year used only for validation. No reported mIoU or ranking is used to define the benchmark or to fit a parameter. The only self-citation is T3S [46], which is evaluated as one of two temperature-based temporal representation strategies; it is compared against a day-of-year baseline and against the external TPE method, and the largest TSViT gain is attributed to TPE rather than T3S, so the self-citation is not load-bearing. The disclosed LNF label-noise limitation (Section 3.1) is a ground-truth fidelity caveat, not a circular step, because the benchmark does not assume the labels are correct in order to derive its own conclusions. Therefore the central derivation chain is self-contained and no circularity is present.
Assumptions & free parameters
free parameters (4)
- GDD base temperature T_base =
0 °C
- Number of temporal samples in baseline and T3S binning =
24
- Class-balanced loss effective-number beta =
0.99999
- Canton coverage threshold for partial years =
90% of maximum LNF extent
assumptions (5)
- domain assumption LNF administrative declarations reflect realized crop cover at 10m pixel level
- domain assumption swissTLM3D provides accurate non-crop land cover labels
- ad hoc to paper Cumulative GDD with base temperature 0°C aligns phenology across all crop classes
- domain assumption Reusing the same spatial locations across years gives valid temporal generalization estimates
- domain assumption Single-seed training is sufficient to compare models
Cite this review
Pith. "Pith review of SwissCrop25: A National Multi-Year Benchmark for Operational Crop Mapping." pith.science (2026). https://pith.science/paper/CQDIR2KT
@misc{pith2026260809497,
  author       = {Pith},
  title        = {Pith review of: SwissCrop25: A National Multi-Year Benchmark for Operational Crop Mapping},
  year         = {2026},
  howpublished = {\url{https://pith.science/paper/CQDIR2KT}},
  note         = {Machine review of arXiv:2608.09497}
}
read the original abstract
Operational crop mapping requires models that generalise across years, resolve fine-grained crop taxonomies, and distinguish cropland from surrounding landscapes. However, existing crop mapping datasets enable evaluation of these requirements only in isolation. We therefore introduce SwissCrop25, a national-scale crop mapping benchmark dataset spanning seven growing seasons (2019-2025). SwissCrop25 combines Sentinel-2 time series, daily temperature observations, a fine-grained 73 crop taxonomy including grassland management types, and 5 explicit non-crop land cover classes. To evaluate realistic deployment conditions, we define a leave-one-year-out protocol with joint cropland delineation and crop classification for benchmarking representative crop mapping architectures. Evaluating U-TAE (convolutional temporal-attention model), TSViT (transformer-based spatio-temporal model), and Galileo (EO foundation model) reveals differences between architectures hidden by conventional benchmarks. In this setting, domain-specific models outperform Galileo, with TSViT achieving the best overall performance and a 12 pp macro-mIoU advantage over U-TAE. SwissCrop25 also exposes substantial interannual distribution shifts and shows that incorporating temperature-derived phenological information improves robustness. Finally, in-season evaluation reveals a trade-off between models, with U-TAE performing better early in the season and TSViT gaining an advantage later through improved rare-class discrimination. SwissCrop25 provides a challenging testbed for evaluating crop mapping systems under realistic operational conditions and is publicly released at https://huggingface.co/datasets/EOA-team/SwissCrop25 .
Figures


Figures from the paper (10 more)




Reference graph
Works this paper leans on
-
[1]
Remote Sensing14(13), 2981 (Jan 2022).https://doi.org/10.3390/rs14132981
Asam, S., Gessner, U., Almengor González, R., Wenzl, M., Kriese, J., Kuenzer, C.: Mapping Crop Types of Germany by Combining Temporal Statistical Metrics of Sentinel-1 and Sentinel-2 Time Series with LPIS Data. Remote Sensing14(13), 2981 (Jan 2022).https://doi.org/10.3390/rs14132981
-
[2]
Remote Sensing5(2), 949–981 (Feb 2013).https://doi.org/10.3390/rs5020949
Atzberger, C.: Advances in Remote Sensing of Agriculture: Context Description, Existing Operational Monitoring Systems and Major Information Needs. Remote Sensing5(2), 949–981 (Feb 2013).https://doi.org/10.3390/rs5020949
-
[3]
Data in Brief56, 110852 (Oct 2024).https: //doi.org/10.1016/j.dib.2024.110852
Aybar, C., Bautista, L., Montero, D., Contreras, J., Ayala, D., Prudencio, F., Loja, J., Ysuhuaylas, L., Herrera, F., Gonzales, K., Valladares, J., Flores, L.A., Mamani, E., Quiñonez, M., Fajardo, R., Espinoza, W., Limas, A., Yali, R., Alcántara, A., Leyva, M., Loayza-Muro, R., Willems, B., Mateo-García, G., Gómez-Chova, L.: CloudSEN12+: The largest datas...
-
[4]
Remote Sensing of Environment305, 114110 (May 2024).https://doi.org/10.1 016/j.rse.2024.114110
Barriere, V., Claverie, M., Schneider, M., Lemoine, G., d’Andrimont, R.: Boosting crop classification by hierarchically fusing satellite, rotational, and contextual data. Remote Sensing of Environment305, 114110 (May 2024).https://doi.org/10.1 016/j.rse.2024.114110
-
[5]
Baston, D.: Exactextractr: Fast Extraction from Raster Datasets Using Polygons (2024).https://doi.org/10.32614/CRAN.package.exactextractr
-
[6]
Scientific Data10(1), 172 (Mar 2023).https://doi.org/10.1038/s41597-023- 02047-9
Becker-Reshef, I., Barker, B., Whitcraft, A., Oliva, P., Mobley, K., Justice, C., Sahajpal, R.: Crop Type Maps for Operational Global Agricultural Monitoring. Scientific Data10(1), 172 (Mar 2023).https://doi.org/10.1038/s41597-023- 02047-9
-
[7]
Boryan, C., Yang, Z., Mueller, R., Craig, M.: Monitoring US agriculture: The US Department of Agriculture, National Agricultural Statistics Service, Cropland Data Layer Program. Geocarto International26(5), 341–358 (Aug 2011).https: //doi.org/10.1080/10106049.2011.562309 16 Lauber et al
arXiv 2011
-
[8]
Earth System Science Data18(6), 4075–4095 (Jun 2026).https://doi.org/10.5194/es sd-18-4075-2026
Claverie, M., Chan, A., See, L., Ramos, H., Koeble, R., Yordanov, M., Skøien, J.O., Urbano, F., d’Andrimont, R., Schneider, M., Körner, M., Van der Velde, M.: EuroCrops v2.0: Multi-annual harmonized parcel level crop type data linked to European Union-wide survey, statistical, and Earth Observation products. Earth System Science Data18(6), 4075–4095 (Jun ...
work page doi:10.5194/es 2026
Show all 52 references
-
[9]
Copernicus Land Monitoring Service: High Resolution Layer Croplands (2025),ht tps://land.copernicus.eu/en/products/high-resolution-layer-croplands
2025
-
[10]
In: 2019 IEEE/CVF Conference on Computer Vision and Pattern Recognition (CVPR)
Cui, Y., Jia, M., Lin, T.Y., Song, Y., Belongie, S.: Class-Balanced Loss Based on Effective Number of Samples. In: 2019 IEEE/CVF Conference on Computer Vision and Pattern Recognition (CVPR). pp. 9260–9269 (Jun 2019).https://doi.org/ 10.1109/CVPR.2019.00949
2019
-
[11]
de Abelleyra, D., Iturralde Elortegui, M.d.R., Zelaya, K., Portillo, J., Melilli, M., Volante, J., Franzoni, A., López Morillo, CS., Goytía, Y., Murray, F., Santillán, J., Berriolo, J., Lanceta Pereyra, M., Scavone, A., Continelli, N., Gerlero, G., Salas, D., Reinaldi, J., Lop...
2024
-
[12]
Remote Sensing of Environment120, 25–36 (May 2012).https://doi.org/10.1016/j.rse.2011.11.026
Drusch, M., Del Bello, U., Carlier, S., Colin, O., Fernandez, V., Gascon, F., Ho- ersch, B., Isola, C., Laberinti, P., Martimort, P., Meygret, A., Spoto, F., Sy, O., Marchese, F., Bargellini, P.: Sentinel-2: ESA’s Optical High-Resolution Mission for GMES Operational Services. ...
2012 doi
-
[13]
European Space Agency (ESA): Sen4CAP - Sentinels for Common Agricultural Policy: Validation Report. Tech. rep., European Space Agency (ESA) (2021),ht tps://www.esa-sen4cap.org/wp-content/uploads/files/14_Sen4CAP_VR_v1.2 .pdf
2021
-
[14]
Federal Office for Agriculture (FOAG): Landwirtschaftliche Kulturflächen (2024), https://www.blw.admin.ch/de/landwirtschaftliche-kulturflaechen
2024
-
[15]
Federal Office of Topography swisstopo: swissTLM3D: The large-scale topographic landscape model of Switzerland (2026),https://www.swisstopo.admin.ch/en/ landscape-model-swisstlm3d
2026
-
[16]
In: 2014 IEEE Geoscience and Remote Sensing Symposium
Fisette, T., Davidson, A., Daneshfar, B., Rollin, P., Aly, Z., Campbell, L.: Annual space-based crop inventory for Canada: 2009–2014. In: 2014 IEEE Geoscience and Remote Sensing Symposium. pp. 5095–5098 (Jul 2014).https://doi.org/10.110 9/IGARSS.2014.6947643
2009
-
[17]
In: 2013 Second International Conference on Agro-Geoinformatics (Agro-Geoinformatics)
Fisette, T., Rollin, P., Aly, Z., Campbell, L., Daneshfar, B., Filyer, P., Smith, A., Davidson, A., Shang, J., Jarvis, I.: AAFC annual crop inventory. In: 2013 Second International Conference on Agro-Geoinformatics (Agro-Geoinformatics). pp. 270– 274(Aug2013).https://doi.org/1...
2013
-
[18]
ISPRS Journal of Photogram- SwissCrop25 17 metry and Remote Sensing237, 271–300 (Jul 2026).https://doi.org/10.1016/ j.isprsjprs.2026.04.017
Garioud, A., Giordano, S., David, N., Gonthier, N.: FLAIR-HUB: Large-scale mul- timodal dataset for land cover and crop mapping. ISPRS Journal of Photogram- SwissCrop25 17 metry and Remote Sensing237, 271–300 (Jul 2026).https://doi.org/10.1016/ j.isprsjprs.2026.04.017
2026
-
[19]
In: 2021 IEEE/CVF In- ternational Conference on Computer Vision (ICCV)
Garnot, V.S.F., Landrieu, L.: Panoptic Segmentation of Satellite Image Time Se- ries with Convolutional Temporal Attention Networks. In: 2021 IEEE/CVF In- ternational Conference on Computer Vision (ICCV). pp. 4852–4861 (Oct 2021). https://doi.org/10.1109/ICCV48922.2021.00483
2021
- [20]
-
[21]
geodienste.ch: Nutzungsflächen,https://geodienste.ch/services/lwb_nutzung sflaechen
-
[22]
Scientific Data11(1), 1048 (Sep 2024).https: //doi.org/10.1038/s41597-024-03884-y
Ghassemi, B., Izquierdo-Verdiguier, E., Verhegghen, A., Yordanov, M., Lemoine, G., Moreno Martínez, Á., De Marchi, D., van der Velde, M., Vuolo, F., d’Andrimont, R.: European Union crop map 2022: Earth observation’s 10-meter dive into Europe’s crop tapestry. Scientific Data11(...
2022 doi
-
[23]
Environmental Research Letters15(8), 084035 (Aug 2020).https://doi.org/10.1088/1748-9326/ab8f60
Holland, A., Bennett, D., Secchi, S.: Complying with conservation compliance? An assessment of recent evidence in the US Corn Belt. Environmental Research Letters15(8), 084035 (Aug 2020).https://doi.org/10.1088/1748-9326/ab8f60
2020 doi
-
[24]
Intergovernmental Panel on Climate Change (IPCC): 2006 IPCC Guidelines for National Greenhouse Gas Inventories: Volume 4: Agriculture, Forestry and Other Land Use. Tech. rep., Institute for Global Environmental Strategies (IGES), Hayama, Kanagawa, Japan (2006),https://www.ipcc...
2006
-
[25]
Kondmann, L., Toker, A., Russwurm, M., Camero, A., Peressuti, D., Milcinski, G., Longépé, N., Mathieu, P.P., Davis, T., Marchisio, G., Leal-Taixé, L., Zhu, X.X.: DENETHOR: The DynamicEarthNET dataset for Harmonized, inter-Operable, analysis-Ready, daily crop monitoring from sp...
2021
-
[26]
Scientific Data13(1), 750 (Mar 2026).https://doi.org/10.1038/s415 97-026-07099-1
Li, H., Di, L., Zhang, C., Guo, L., Yu, E.G., Shao, B., Liu, Z., Li, H.: Automated 10-m Resolution In-season Crop-type Data Layer Mapping for Contiguous United States. Scientific Data13(1), 750 (Mar 2026).https://doi.org/10.1038/s415 97-026-07099-1
2026 doi
-
[27]
MeteoSwiss: Documentation of MeteoSwiss Grid-Data Products: Daily Mean, Min- imum and Maximum Temperature: TabsD, TminD, TmaxD. Tech. rep., Federal Office of Meteorology and Climatology MeteoSwiss, Zürich, Switzerland (2021), https://www.meteoschweiz.admin.ch/dam/jcr:818a4d17-...
2021
-
[28]
Zenodo (Oct 2022).https://doi
Microsoft Open Source, McFarland, M., Emanuele, R., Morris, D., Augspurger, T.: Microsoft/PlanetaryComputer: October 2022. Zenodo (Oct 2022).https://doi. org/10.5281/ZENODO.7261897
2022 doi
-
[29]
Montero, D., Mahecha, M.D., Aybar, C., Mosig, C., Wieneke, S.: Facilitating ad- vanced Sentinel-2 analysis through a simplified computation of Nadir BRDF Ad- justed Reflectance. The International Archives of the Photogrammetry, Remote Sensing and Spatial Information SciencesXL...
2024 doi
- [30]
-
[31]
ISPRS Journal of Photogrammetry and Remote Sensing188, 301–313 (Jun 2022).https://doi.org/10.1016/j.is prsjprs.2022.04.018
Nyborg, J., Pelletier, C., Lefèvre, S., Assent, I.: TimeMatch: Unsupervised cross- region adaptation by temporal shift estimation. ISPRS Journal of Photogrammetry and Remote Sensing188, 301–313 (Jun 2022).https://doi.org/10.1016/j.is prsjprs.2022.04.018
2022 doi
-
[32]
Remote Sensing11(5), 523 (Jan 2019).https://doi.org/10.3390/rs11050523
Pelletier, C., Webb, G.I., Petitjean, F.: Temporal Convolutional Neural Network for the Classification of Satellite Image Time Series. Remote Sensing11(5), 523 (Jan 2019).https://doi.org/10.3390/rs11050523
2019 doi
-
[33]
International Journal of Applied Earth Observation and Geoinformation129, 103867 (May 2024).https://doi.org/10.1016/j.jag
Pham, V.D., Tetteh, G., Thiel, F., Erasmi, S., Schwieder, M., Frantz, D., van der Linden, S.: Temporally transferable crop mapping with temporal encoding and deep learning augmentations. International Journal of Applied Earth Observation and Geoinformation129, 103867 (May 2024...
2024
-
[34]
Sci- entific Data12(1), 664 (Apr 2025).https://doi.org/10.1038/s41597-025- 04952-7
Reuss, J., Macdonald, J., Becker, S., Richter, L., Körner, M.: The EuroCropsML time series benchmark dataset for few-shot crop type classification in Europe. Sci- entific Data12(1), 664 (Apr 2025).https://doi.org/10.1038/s41597-025- 04952-7
2025 doi
-
[35]
ISPRS International Journal of Geo-Information7(4), 129 (Apr 2018).https://doi.org/10.3390/ijgi7040129
Rußwurm,M.,Körner,M.:Multi-TemporalLandCoverClassificationwithSequen- tial Recurrent Encoders. ISPRS International Journal of Geo-Information7(4), 129 (Apr 2018).https://doi.org/10.3390/ijgi7040129
2018 doi
-
[36]
ISPRS Journal of Photogrammetry and Remote Sensing169, 421– 435 (Nov 2020).https://doi.org/10.1016/j.isprsjprs.2020.06.006
Rußwurm, M., Körner, M.: Self-attention for raw optical Satellite Time Series Classification. ISPRS Journal of Photogrammetry and Remote Sensing169, 421– 435 (Nov 2020).https://doi.org/10.1016/j.isprsjprs.2020.06.006
2020 doi
- [37]
-
[38]
Scientific Data10(1), 612 (Sep 2023).https://doi.org/10.1038/s41597-023-02517-0
Schneider, M., Schelte, T., Schmitz, F., Körner, M.: EuroCrops: The Largest Har- monized Open Crop Dataset Across the European Union. Scientific Data10(1), 612 (Sep 2023).https://doi.org/10.1038/s41597-023-02517-0
2023 doi
-
[39]
In: IGARSS 2024 - 2024 IEEE International Geoscience and Remote Sensing Symposium
Senaras, C., Holden, P., Davis, T., Wania, A., Rana, A.S., Grady, M., De Jeu, R.: Early-Season Crop Classification with Planet Fusion. In: IGARSS 2024 - 2024 IEEE International Geoscience and Remote Sensing Symposium. pp. 4145–4149 (Jul 2024).https://doi.org/10.1109/IGARSS5347...
2024
-
[40]
IEEE Journal of Selected Topics in Applied Earth Observations and Re- mote Sensing15, 3323–3339 (2022).https://doi.org/10.1109/JSTARS.2022.31 64771
Sykas, D., Sdraka, M., Zografakis, D., Papoutsis, I.: A Sentinel-2 Multiyear, Multi- country Benchmark Dataset for Crop Classification and Segmentation With Deep Learning. IEEE Journal of Selected Topics in Applied Earth Observations and Re- mote Sensing15, 3323–3339 (2022).ht...
2022 doi
-
[41]
Tarasiou, M., Chavez, E., Zafeiriou, S.: ViTs for SITS: Vision Transformers for Satellite Image Time Series (Apr 2023).https://doi.org/10.48550/arXiv.230 1.04944
2023 doi
-
[42]
Tetteh, G.O., Schwieder, M., Blickensdörfer, L., Gocht, A., Erasmi, S.: Agricultural land use (raster): National-scale crop type maps for Germany from combined time series of Sentinel-2 and Landsat data (2025) (Sep 2025).https://doi.org/10.5 281/zenodo.17181502
2025
- [43]
-
[44]
In: Singh, A., Fazel, M., Hsu, D., Lacoste- Julien, S., Berkenkamp, F., Maharaj, T., Wagstaff, K., Zhu, J
Tseng, G., Fuller, A., Reil, M., Herzog, H., Beukema, P., Bastani, F., Green, J.R., Shelhamer, E., Kerner, H., Rolnick, D.: Galileo: Learning Global & Local Features of Many Remote Sensing Modalities. In: Singh, A., Fazel, M., Hsu, D., Lacoste- Julien, S., Berkenkamp, F., Maha...
2025
-
[45]
Remote Sensing of Environment264, 112603 (Oct 2021)
Turkoglu, M.O., D’Aronco, S., Perich, G., Liebisch, F., Streit, C., Schindler, K., Wegner, J.D.: Crop mapping from image time series: Deep learning with multi- scale label hierarchies. Remote Sensing of Environment264, 112603 (Oct 2021). https://doi.org/10.1016/j.rse.2021.112603
2021
- [46]
-
[47]
Earth System Science Data15(12), 5491–5515 (Dec 2023).https://doi.org/10.5194/essd-15-5491-2023
Van Tricht, K., Degerickx, J., Gilliams, S., Zanaga, D., Battude, M., Grosu, A., Brombacher, J., Lesiv, M., Bayas, J.C.L., Karanam, S., Fritz, S., Becker-Reshef, I., Franch, B., Mollà-Bononad, B., Boogaard, H., Pratihast, A.K., Koetz, B., Szantoi, Z.: WorldCereal: A dynamic op...
2023 doi
- [48]
-
[49]
IEEE Journal of Selected Topics in Applied Earth Observations and Remote Sensing14, 4699–4708 (Apr 2021).https://doi.org/10.1109/JSTARS.2021.3073965
Weikmann, G., Paris, C., Bruzzone, L.: TimeSen2Crop: A Million Labeled Sam- ples Dataset of Sentinel 2 Image Time Series for Crop-Type Classification. IEEE Journal of Selected Topics in Applied Earth Observations and Remote Sensing14, 4699–4708 (Apr 2021).https://doi.org/10.11...
2021
-
[50]
ISPRS Journal of Photogrammetry and Remote Sensing213, 72–86 (Jul 2024)
Wijesingha, J., Dzene, I., Wachendorf, M.: Evaluating the spatial–temporal trans- ferability of models for agricultural land cover mapping using Landsat archive. ISPRS Journal of Photogrammetry and Remote Sensing213, 72–86 (Jul 2024). https://doi.org/10.1016/j.isprsjprs.2024.05.020
2024 doi
-
[51]
National Science Review10(4), nwac290 (Apr 2023)
Wu, B., Zhang, M., Zeng, H., Tian, F., Potgieter, A.B., Qin, X., Yan, N., Chang, S., Zhao, Y., Dong, Q., Boken, V., Plotnikov, D., Guo, H., Wu, F., Zhao, H., Deronde, B., Tits, L., Loupian, E.: Challenges and opportunities in remote sensing-based crop monitoring: A review. Nat...
2023 doi
-
[52]
IEEE Journal of Selected Topics in Applied Earth Observations and Remote Sensing18, 5172–5188 (2025).https://doi.org/10.1109/JSTARS.2 025.3527017 20 Lauber et al
Yuan, Y., Lin, L., Xin, Q., Zhou, Z.G., Liu, Q.: An Empirical Study on Data Augmentation for Pixelwise Satellite Image Time-Series Classification and Cross- Year Adaptation. IEEE Journal of Selected Topics in Applied Earth Observations and Remote Sensing18, 5172–5188 (2025).ht...
2025 doi
Reviewed August 11, 2026 · model on record in the stance chip above.
Discussion (0). Continue with ORCID to comment.