REVIEW 4 major objections 6 minor 29 references
STCAD: Scalable Trajectory Clustering and Anomaly Detection on Terabyte-Scale AIS Data
T0 review · 4 major / 6 minor · reviewed 2026-08-14 · deepseek-v4-flash
Pith's one-line read A year of Danish AIS traffic clusters into stable shipping routes, unsupervised.
desk verdict Genuine engineering at terabyte scale, but the anomaly-detection separation claim rests on a post-hoc tuned RCR=1.5 with no uncertainty or held-out evaluation. read the letter →
The pith
A machine-rendered reading of the paper's core claim, the machinery that carries it, and where it could break.
The reading
What carries the argument
The argument rests on three linked components. The first is a BERT-style encoder: a four-layer, four-head Transformer with hidden size 256, trained with 15% masked token modeling on tokenized AIS features (latitude, longitude, speed, course), whose final [CLS] hidden state is the fixed-size trajectory embedding. The second is CURE (Clustering Using REpresentatives), which builds the hierarchy on a 1000-voyage sample and then assigns every other voyage to the nearest set of cluster representative points, reducing the cost of fitting to roughly linear in the number of trajectories. The third is the reconstruction contrast ratio, the ratio of the mean reconstruction error of noise-labeled voyages to cluster-member voyages, together with the assignment threshold that decides which points are noise; this ratio is the paper's quantitative separator between normal and anomalous behavior.
What would settle it
Hold out a second year of Danish AIS data, run the pipeline with the same hyperparameters, and check whether the same route clusters and the 1.4% noise / RCR 1.5 operating point recur; if the noise rate or RCR drifts substantially, or known anomalous voyages such as deliberate off-route transits are assigned to clusters instead of noise, the claimed separation is not stable.
Extended reading notes
Core claim
The central claim is that masked-token-modeled trajectory embeddings plus representative-based hierarchical clustering give a stable decomposition of real AIS traffic, and that anomalies can be found intrinsically from reconstruction error. The authors train a four-layer Transformer with a [CLS] embedding on 80% of nearly half a million voyages, L2-normalize the embeddings, and run CURE on a sample of 1000 voyages, assigning all remaining voyages to the nearest cluster representatives. They report that Ward-linkage agglomerative clustering on the sample produces stable partitions at k=3 and k=5, that those partitions are spatially and demographically interpretable, and that pushing to 12 clusters with an assignment threshold of 0.22 labels 1.4% of voyages as noise, with the mean reconstruction error of noise voyages 1.5 times that of cluster members. That reconstruction contrast ratio is the paper's quantitative evidence for clear separation between nominal and anomalous behavior.
Load-bearing premise
The entire cluster hierarchy, noise threshold, and reported separation rest on the assumption that the 1,000-voyage sample used to build the CURE tree is representative of all 453,712 voyages in the archive.
Editorial extensions
If this is right
- Maritime monitoring centers could apply the pipeline year-round to national AIS feeds without labels, using cluster membership as a route and behavior profile and reconstruction error as an anomaly score.
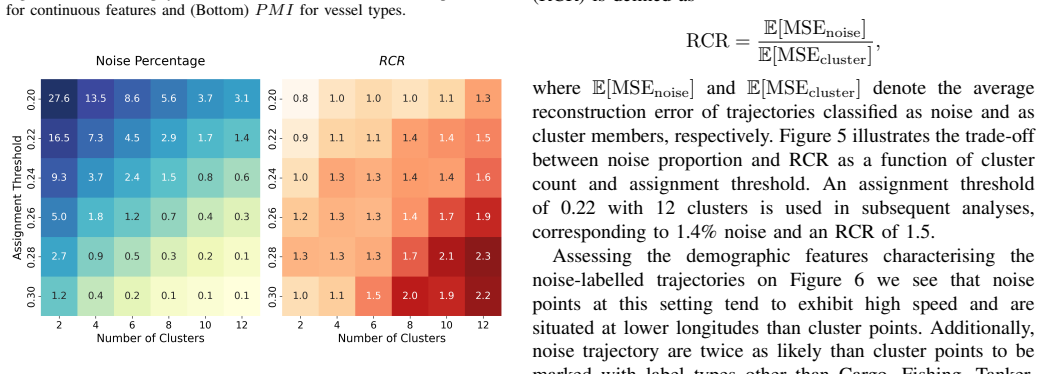
- The reported operating point gives a concrete setting: 12 clusters and an assignment threshold of 0.22 flag about 1.4% of voyages as noise, and flagged voyages have on average 1.5 times the reconstruction error of cluster members.
- Because clustering does not require a preset number of clusters, operators can choose the resolution from the dendrogram, for example k=3 or k=5, to match the desired spatial detail.
- The distributed preprocessing pipeline reduces a 1.2 TB raw AIS archive to a workable set of 453,712 voyages in roughly 80 minutes, suggesting the approach scales to a full national year of data.
Reading between the lines
- The recipe is not maritime-specific: any trajectory source with position and kinematic features, such as road GPS or flight tracks, could be encoded with masked token modeling and clustered with CURE, so the framework may transfer to other domains without architectural changes.
- RCR compares noise to cluster members, so it measures internal contrast rather than agreement with ground truth; a natural next test is to inject labeled anomalous voyages and see whether they fall into the noise bin.
- Because the encoder is trained on frequent patterns, genuinely rare but lawful routes may be flagged as anomalies, so high reconstruction error is best read as 'unusual for this archive' rather than 'violating a regulation'.
- The reported operating point depends on the 1000-voyage sample; resampling and rerunning would show how much the noise threshold and RCR drift, which would turn the qualitative claim into a stability statement.
Signed reviews
Editorial analysis
A structured set of objections, weighed in public.
Referee Report
Summary. The paper presents STCAD, a scalable unsupervised framework for trajectory clustering and anomaly detection on terabyte-scale AIS data. Variable-length voyages are encoded with a BERT-style Transformer trained via masked token modeling, and the resulting embeddings are clustered with CURE hierarchical clustering that also assigns noise labels to points far from cluster representatives. The framework is demonstrated on a one-year national AIS dataset of approximately 6.89 billion messages, producing physically interpretable clusters and an anomaly detection result reported as a Reconstruction Contrast Ratio (RCR) of 1.5 at 1.4% noise. The central claim is that the method yields stable trajectory clusters and a clear separation between nominal and anomalous vessel behavior.
Significance. If the claims are substantiated, STCAD would be a meaningful engineering contribution: it addresses real scalability challenges in maritime AIS analytics, processes 1.2 TB of raw data, and provides a publicly available implementation. The combination of a BERT-style encoder with CURE clustering is a reasonable design choice, and the interpretable cluster descriptors are a strength. However, the key evidentiary claim of a 'clear separation' between nominal and anomalous behavior rests on a single point estimate (RCR=1.5) without uncertainty quantification or external validation, and the anomaly detection pipeline is self-referential. The paper's significance therefore depends on whether the anomaly detection evidence can be strengthened with appropriate statistical and validation procedures.
major comments (4)
- [§IV-A, Fig. 5] The central quantitative support for 'clear separation' is the RCR of 1.5 at 1.4% noise, but this value is obtained by selecting the number of clusters (12) and the assignment threshold (0.22) after inspecting Figure 5 on the same dataset used to compute the reported RCR. This is a post hoc selection on a tuning curve, not a principled or statistically validated result. No confidence intervals, significance test, or held-out evaluation is provided for the ratio of means, and with only 1.4% of trajectories in the noise set, the numerator is estimated from a small sample. I request uncertainty quantification (e.g., bootstrap or subsampling), a significance test for the difference in reconstruction error distributions, and an evaluation on a held-out temporal or spatial subset. Additionally, k=12 is not among the stable cluster counts {2,3,5,8} identified from the dendrogram in §III-B, so the cluster structure used for anomaly detection is not justified by the paper's own stability analysis.
- [§III-B, §IV-A] CURE clustering is fit on a sample of N=1000 trajectories, and the remaining 452,712 voyages are assigned to the nearest representative set. The representativeness of this sample is assumed but not assessed. If the sample misses a major route or over-represents a particular region, the cluster representatives, the noise assignment threshold, and the reported RCR could all be miscalibrated for the full dataset. The paper should quantify sampling variability, for example by repeating the CURE fitting on multiple bootstrap samples of size 1000 and reporting the stability of cluster assignments and noise labels, or by comparing the characteristics of the sample with the full dataset on trajectory-level descriptors.
- [§IV-A, §II-A] The anomaly detection is intrinsically self-referential: the same encoder that produces the embeddings is also used to compute reconstruction errors, and it is trained on the entire processed dataset including the points that are eventually labelled as noise. This does not make the method circular in a logical sense, but it means the reported separation could partly reflect the model's lower reconstruction accuracy for rare or atypical inputs that happen to be far from cluster representatives, rather than a genuine behavioral anomaly signal. To strengthen the claim, the authors should compare against a model trained after removing noise-labelled trajectories or using a cross-validation procedure, and should demonstrate that the high reconstruction errors of noise points are not merely an artifact of input rarity.
- [§IV-A, §I] The paper claims a 'clear separation' between nominal and anomalous behavior but provides no comparison against existing AIS anomaly detection baselines, such as DBSCAN or HDBSCAN trajectory clustering, or other deep-learning methods referenced in the introduction. Without a baseline, the reader cannot judge whether the 1.5 RCR is a strong or weak separation for this problem. I also note that no external validation is performed, such as checking whether the noise-labelled trajectories correspond to known incidents or unusual navigation that domain experts would flag. Adding at least one baseline and a qualitative inspection of the detected anomalies would substantially strengthen the central claim.
minor comments (6)
- [§II-A] The sentence 'these often exhibit significant sparsity, particularly among smaller vessel classes, and were therefore excluded them' contains a grammatical error ('excluded them' should be 'excluded these features' or similar).
- [§II-A] In the text, 'V oyages exceeding 20 hours' has an extra space; please fix the typo.
- [§IV, Fig. 5] The color scale in Figure 5 is described as log10-normalized, but the caption does not explain the normalization procedure or what the raw values are before normalization; please clarify.
- [§IV] Figures 4 and 6 show Z-scores and PMI values without any indication of sampling uncertainty; adding error bars or confidence intervals would help the reader assess the reliability of the demographic characterizations.
- [§V] The statement 'All code used in this study is available here' does not include a URL or repository identifier; please provide a persistent link or DOI.
- [§III-B] The choice of CURE parameters (compression factor 0.6, 20 representative points) is described as based on 'preliminary experiments' but no details are given; a brief description of the search space or sensitivity analysis would improve reproducibility.
Circularity Check
Reported 'clear separation' rests on an RCR obtained after tuning cluster count and assignment threshold on the same dataset, making the metric a selected operating point rather than an independent prediction.
-
fitted input called prediction
[Section IV-A, Anomaly detection (Figure 5 paragraph)]
"Figure 5 illustrates the trade-off between noise proportion and RCR as a function of cluster count and assignment threshold. An assignment threshold of 0.22 with 12 clusters is used in subsequent analyses, corresponding to 1.4% noise and an RCR of 1.5."
The cluster count (12) and assignment threshold (0.22) are selected by inspecting Figure 5, which plots RCR and noise proportion on the same full dataset. The reported RCR of 1.5 is thus not an independent measure of separation; it is the value at a point chosen on that same data to yield low noise and high contrast. No held-out data or uncertainty estimate is provided. The claim of 'clear separation between nominal and anomalous vessel behavior' therefore reduces to a self-selected operating point on an in-sample tuning curve, not an out-of-sample prediction. This is a fitted parameter (the threshold) being presented as evidence for the method's effectiveness, i.e., a fitted input called a prediction.
full rationale
The paper's clustering pipeline is self-contained: it trains a BERT encoder on 80% of the data, clusters a 1000-sample subset with CURE, and assigns all points to nearest representatives. No self-citation chains or imported uniqueness theorems are load-bearing. However, the central anomaly-detection claim—'clear separation between nominal and anomalous vessel behavior'—is quantitatively supported only by the RCR of 1.5 at 1.4% noise. That operating point (k=12, threshold=0.22) is selected by inspecting the same dataset's RCR-vs-noise trade-off (Figure 5). Thus the reported separation is an artifact of tuning the anomaly-detection hyperparameters on the evaluation data, rather than a validated, out-of-sample result. This constitutes a fitted input being presented as a prediction, meriting a score of 6. The paper provides no confidence intervals, significance tests, or held-out evaluation for the RCR, further reinforcing the in-sample nature of the claimed separation.
Assumptions & free parameters
free parameters (5)
- anomaly assignment threshold =
0.22 (with 12 clusters)
- cluster count (anomaly setting) =
12
- CURE sample size =
1000
- voyage segmentation thresholds =
gap < 2h, duration 4-20h, min 20 messages, speed cutoff 40 knots, 5-min interpolation
- CURE compression factor and representatives =
compression 0.6, reps 20
assumptions (3)
- domain assumption A BERT encoder trained with masked token modeling on [lat, lon, SOG, COG] sequences produces embeddings where Euclidean distance (after L2 normalization) reflects trajectory similarity.
- domain assumption The 1000-voyage sample used to fit CURE is representative of all 453,712 processed voyages.
- domain assumption Reconstruction error from the MTM-trained encoder is a valid anomaly score for trajectories.
Cite this review
Pith. "Pith review of STCAD: Scalable Trajectory Clustering and Anomaly Detection on Terabyte-Scale AIS Data." pith.science (2026). https://pith.science/paper/HRPVUG3X
@misc{pith2026260810249,
  author       = {Pith},
  title        = {Pith review of: STCAD: Scalable Trajectory Clustering and Anomaly Detection on Terabyte-Scale AIS Data},
  year         = {2026},
  howpublished = {\url{https://pith.science/paper/HRPVUG3X}},
  note         = {Machine review of arXiv:2608.10249}
}
read the original abstract
We present a scalable framework for unsupervised clustering of maritime trajectories derived from terabyte-scale Automatic Identification System (AIS) archives. Variable-length trajectories are encoded with a custom BERT-based model trained via masked token modeling and clustered using CURE hierarchical clustering, producing physically interpretable trajectory groups without requiring a predefined number of clusters. An intrinsic unsupervised anomaly detection method based on reconstruction loss and clustering noise assignment identifies irregular navigation patterns. The framework is demonstrated on a national-scale AIS dataset comprising billions of messages spanning one year, yielding stable trajectory clusters and a clear separation between nominal and anomalous vessel behavior.
Figures


Figures from the paper (2 more)

Reference graph
Works this paper leans on
- [1]
-
[2]
Vessel pattern knowledge discovery from ais data: A framework for anomaly detection and route prediction,
G. Pallotta, M. Vespe, and K. Bryan, “Vessel pattern knowledge discovery from ais data: A framework for anomaly detection and route prediction,”Entropy, vol. 15, no. 6, pp. 2218–2245, 2013
2013
-
[3]
Modeling vessel behaviours by clustering ais data using optimized dbscan,
X. Han, C. Armenakis, and M. Jadidi, “Modeling vessel behaviours by clustering ais data using optimized dbscan,” Sustainability, vol. 13, no. 15, p. 8162, 2021
work page 2021
-
[4]
Ship ais trajectory clustering: An hdbscan-based approach,
L. Wang, P. Chen, L. Chen, and J. Mou, “Ship ais trajectory clustering: An hdbscan-based approach,”Journal of Marine Science and Engineering, vol. 9, no. 6, p. 566, 2021
work page 2021
-
[5]
S.-M. Wang, W.-R. Yang, Q.-Y . Zhuang, W.-H. Lin, M.-Y . Tian, T.-J. Su, and J.-C. Cheng, “Application of three-dimensional hierarchical density-based spatial clustering of applications with noise in ship automatic identification system trajectory-cluster analysis,”Applied Sciences, vol. 15, no. 5, p. 2621, 2025
work page 2025
-
[6]
A novel ship trajectory clustering analysis and anomaly detection method based on ais data,
C. Zhang, S. Liu, M. Guo, and Y . Liu, “A novel ship trajectory clustering analysis and anomaly detection method based on ais data,”Ocean Engineering, vol. 288, p. 116082, 2023
work page 2023
-
[7]
A. Vaswani, N. Shazeer, N. Parmar, J. Uszkoreit, L. Jones, A. N. Gomez, L. Kaiser, and I. Polosukhin, “Attention is all you need,”CoRR, vol. abs/1706.03762, 2017. [Online]. Available: http://arxiv.org/abs/1706.03762
arXiv 2017
-
[8]
N. P. Juan, V . N. Valdecantos, and P. Troch, “Advancing artificial intelligence in ocean and maritime engineering: Trends, progress, and future directions,”Ocean Engineering, vol. 339, p. 122077, 2025
work page 2025
Show all 29 references
-
[9]
Harnessing the power of machine learning for ais data-driven maritime research: A comprehensive review,
Y . Yang, Y . Liu, G. Li, Z. Zhang, and Y . Liu, “Harnessing the power of machine learning for ais data-driven maritime research: A comprehensive review,”Transportation research part E: logistics and transportation review, vol. 183, p. 103426, 2024
2024
-
[11]
Multi-path long- term vessel trajectories forecasting with probabilistic feature fusion for problem shifting,
G. Spadon, J. Kumar, D. Eden, J. van Berkel, T. Foster, A. Soares, R. Fablet, S. Matwin, and R. Pelot, “Multi-path long- term vessel trajectories forecasting with probabilistic feature fusion for problem shifting,”Ocean Engineering, vol. 312, p. 119138, 2024
2024
-
[12]
Probabilistic maritime trajectory prediction in complex scenarios using deep learning,
K. A. Sørensen, P. Heiselberg, and H. Heiselberg, “Probabilistic maritime trajectory prediction in complex scenarios using deep learning,”Sensors, vol. 22, no. 5, p. 2058, 2022
2022
-
[13]
BERT: pre-training of deep bidirectional transformers for language understanding,
J. Devlin, M. Chang, K. Lee, and K. Toutanova, “BERT: pre-training of deep bidirectional transformers for language understanding,”CoRR, vol. abs/1810.04805, 2018. [Online]. Available: http://arxiv.org/abs/1810.04805
2018 arXiv
-
[14]
Roberta: A robustly optimized BERT pretraining approach,
Y . Liu, M. Ott, N. Goyal, J. Du, M. Joshi, D. Chen, O. Levy, M. Lewis, L. Zettlemoyer, and V . Stoyanov, “Roberta: A robustly optimized BERT pretraining approach,” CoRR, vol. abs/1907.11692, 2019. [Online]. Available: http: //arxiv.org/abs/1907.11692
1907 arXiv
-
[15]
Trajectory pattern extraction and anomaly detection for maritime vessels,
G. B. Karatas ¸, P. Karagoz, and O. Ayran, “Trajectory pattern extraction and anomaly detection for maritime vessels,”Internet of Things, vol. 16, p. 100436, 2021
2021
-
[16]
Navigation pattern extraction from ais trajectory big data via topic model,
I. Fujino and C. Claramunt, “Navigation pattern extraction from ais trajectory big data via topic model,”The Journal of Navigation, vol. 76, no. 4-5, pp. 506–524, 2023
2023
-
[17]
Unsupervised maritime anomaly detection for intelligent situational awareness using ais data,
M. Liang, L. Weng, R. Gao, Y . Li, and L. Du, “Unsupervised maritime anomaly detection for intelligent situational awareness using ais data,”Knowledge-Based Systems, vol. 284, p. 111313, 2024
2024
-
[18]
Cure: An efficient clustering algorithm for large databases,
S. Guha, R. Rastogi, and K. Shim, “Cure: An efficient clustering algorithm for large databases,”ACM Sigmod record, vol. 27, no. 2, pp. 73–84, 1998
1998
-
[19]
Array programming with NumPy,
C. R. Harris, K. J. Millman, S. J. van der Waltet al., “Array programming with NumPy,”Nature, vol. 585, no. 7825, pp. 357–362, 2020
2020
-
[20]
Data structures for statistical computing in Python,
W. McKinneyet al., “Data structures for statistical computing in Python,” inProceedings of the 9th Python in Science Con- ference, vol. 445. Austin, TX, 2010, pp. 51–56
2010
-
[21]
Pytorch: An imperative style, high-performance deep learning library,
A. Paszke, S. Gross, F. Massa, A. Lerer, J. Bradbury, G. Chanan, T. Killeen, Z. Lin, N. Gimelshein, L. Antiga, A. Desmaison, A. Kopf, E. Yang, Z. DeVito, M. Raison, A. Tejani, S. Chil- amkurthy, B. Steiner, L. Fang, J. Bai, and S. Chintala, “Pytorch: An imperative style, high-...
2019
-
[22]
Umap: Uniform man- ifold approximation and projection for dimension reduction,
L. McInnes, J. Healy, and J. Melville, “Umap: Uniform man- ifold approximation and projection for dimension reduction,” arXiv preprint arXiv:1802.03426, 2018
2018 arXiv
-
[23]
Transformers: State-of-the-art natural language processing,
T. Wolf, L. Debut, V . Sanh, J. Chaumond, C. Delangue, A. Moi, P. Cistac, T. Rault, R. Louf, M. Funtowicz, J. Davison, S. Shleifer, P. von Platen, C. Ma, Y . Jernite, J. Plu, C. Xu, T. Le Scao, S. Gugger, M. Drame, Q. Lhoest, and A. Rush, “Transformers: State-of-the-art natura...
2020
-
[24]
Polars: Dataframe library for rust and python,
R. Vinket al., “Polars: Dataframe library for rust and python,” 2020. [Online]. Available: https://doi.org/10.5281/ zenodo.11182668
2020
-
[25]
Dtu computing center resources,
D. C. Center, “Dtu computing center resources,” 2025. [Online]. Available: https://doi.org/10.48714/DTU.HPC.0001
2025 doi
-
[26]
Decoupled weight decay regular- ization,
I. Loshchilov and F. Hutter, “Decoupled weight decay regular- ization,”arXiv preprint arXiv:1711.05101, 2017
2017 arXiv
-
[27]
Slink: an optimally efficient algorithm for the single-link cluster method,
R. Sibson, “Slink: an optimally efficient algorithm for the single-link cluster method,”The computer journal, vol. 16, no. 1, pp. 30–34, 1973
1973
-
[28]
Single linkage versus average linkage clus- tering in machine cells formation applications,
H. K. Seifoddini, “Single linkage versus average linkage clus- tering in machine cells formation applications,”Computers & Industrial Engineering, vol. 16, no. 3, pp. 419–426, 1989
1989
-
[29]
Hierarchical grouping to optimize an objec- tive function,
J. H. Ward Jr, “Hierarchical grouping to optimize an objec- tive function,”Journal of the American statistical association, vol. 58, no. 301, pp. 236–244, 1963
1963
-
[2021]
Available: https://arxiv.org/abs/2109.03958
[Online]. Available: https://arxiv.org/abs/2109.03958
Reviewed August 14, 2026 · model on record in the stance chip above.
Discussion (0). Continue with ORCID to comment.