REVIEW 3 major objections 6 minor 88 references
CosMAP: Contrastive Manifold Approximation and Projection for Dimensionality Reduction of Omics and Genealogical Data
T0 review · 3 major / 6 minor · reviewed 2026-08-15 · deepseek-v4-flash
Pith's one-line read The paper claims that CosMAP, a cosine-graph dimensionality-reduction method with a two-phase refinement, produces more coherent and neighborhood-faithful embeddings than existing methods on omics and genealogical data.
desk verdict A solid, well-documented new DR method, but the headline claim of improved neighborhood preservation is asserted, not directly measured. read the letter →
The pith
A machine-rendered reading of the paper's core claim, the machinery that carries it, and where it could break.
The reading
What carries the argument
The central object is a temperature-normalized cosine affinity graph combined with a two-phase refinement pipeline. For each point, CosMAP computes a conditional distribution over its k nearest neighbors, P_{j|i}=exp(sim(x_i,x_j)/τ) normalized over N_k(i), symmetrized to p_ij, and then matched in the embedding by a heavy-tailed kernel q_ij=1/(1+a||y_i-y_j||^{2b}) through a binary cross-entropy loss with negative sampling. Definition 1 formalizes the two-phase refinement: an intermediate 30-D CosMAP embedding is used to reconstruct a more reliable graph, and a coordinate projection initializes the final 2-D optimization. This mechanism is what carries the claim that noisy high-dimensional edges can be corrected before final visualization.
What would settle it
Compute a dataset with known ground-truth neighborhoods (for example, points on a low-dimensional manifold with added sparse noise), count the precision and recall of edges in the cosine k-NN graph and in the rebuilt graph from the 30-D intermediate embedding against the true edges, and compare downstream NMI after clustering the 2-D embeddings. If the rebuilt graph has no higher edge fidelity than the raw cosine graph, or if CosMAP's NMI advantage disappears when UMAP's Euclidean graph is given matched preprocessing, the central claim fails.
Extended reading notes
Core claim
The paper's central claim is that CosMAP produces more faithful and interpretable low-dimensional embeddings than existing neighbor-embedding methods for omics and genealogical data. The method uses a k-nearest-neighbor graph under cosine similarity, converts edge strengths into a temperature-scaled conditional distribution with τ=0.5, symmetrizes it, and optimizes a binary cross-entropy attraction–repulsion objective with negative sampling. The distinctive step is a two-phase refinement: it first learns an intermediate r-dimensional embedding with r=30 by default, rebuilds the k-NN graph from that embedding, and only then optimizes the final 2-D projection, initialized by projecting the first two coordinates of the intermediate embedding. The reported results place CosMAP ahead of UMAP, t-SNE, PaCMAP, LocalMAP, PHATE, TriMAP, NCVis, h-NNE, and contrastive t-SNE variants on cluster coherence and neighborhood preservation, with LocalMAP as the closest competitor.
Load-bearing premise
The whole advantage rests on the premise that a k-nearest-neighbor graph built from cosine similarities with a fixed temperature τ=0.5, and then rebuilt from a 30-dimensional intermediate embedding, is more faithful to true structure than the adaptive-bandwidth Euclidean graph used by UMAP.
Editorial extensions
If this is right
- If CosMAP's graph construction is more faithful, exploratory single-cell analyses should see fewer spurious cell clusters and cleaner separation of rare populations without any labeled training data.
- The two-phase refinement implies a general recipe: any neighbor-embedding method can be improved by first projecting to a moderate dimension, rebuilding its graph, and then projecting to 2-D, which is what the paper's ablation-style comparison suggests for CosMAP.
- For genealogical kinship matrices, CosMAP's embedding recovers regional founder-effect structure directly from pairwise relatedness, so the method could replace hand-tuned visualization pipelines in population genetics.
- Because CosMAP uses negative sampling and batching, it scales to data sizes used in current single-cell studies, making the claimed improvements available on datasets of tens of thousands of cells.
- The observed over-splitting on the small Cortex dataset implies that the refinement should be used selectively; the paper itself flags that one-phase optimization can be more coherent for small datasets.
Reading between the lines
- A natural test the paper does not run is to feed the rebuilt intermediate graph back into UMAP's own optimizer; if CosMAP's gains come mainly from graph refinement rather than the cosine affinities, UMAP would match CosMAP with the same two-phase graph.
- The temperature τ=0.5 is fixed rather than learned; an adaptive temperature per point might remove the remaining over-splitting seen on Cortex, since small datasets with subtle boundaries appear to need a sharper or smoother distribution.
- The same two-phase recipe could be applied to other input types, such as spatial transcriptomics or scATAC-seq, where the initial feature space is even sparser and cosine affinities may behave differently.
- Because the kinship matrix itself is the input rather than a feature matrix, CosMAP effectively treats genealogical relatedness as a manifold; if useful, this suggests extending the method to arbitrary precomputed similarity matrices with explicit handling of non-metric affinities.
Signed reviews
Editorial analysis
A structured set of objections, weighed in public.
Referee Report
Summary. CosMAP is a graph-based dimensionality-reduction method that extends UMAP by building k-NN graphs with cosine similarity, defining a temperature-scaled local affinity distribution (Eq. 4), and optimizing a binary cross-entropy objective with negative sampling (Eqs. 7–9, Algorithm 1). Its main methodological novelty is a two-phase refinement procedure (Definition 1 and Algorithm 3): a r-dimensional intermediate embedding is first learned, then a new k-NN graph is reconstructed from that embedding, and the final 2D embedding is optimized from this refined graph. The authors evaluate CosMAP on MNIST and USPS, two scRNA-seq datasets (mouse retina and cortex), and a BALSAC–CARTaGENE kinship matrix, comparing against t-SNE, UMAP, PaCMAP, LocalMAP, and other methods. The abstract claims that CosMAP 'produces more coherent visual representations, improves neighbourhood preservation, and provides clearer global organization' of the data.
Significance. If substantiated, CosMAP would provide a practical tool for exploratory visualization of sparse high-dimensional omics and genealogical data, and its two-phase graph-refinement idea could inform future neighbor-embedding designs. The paper has clear strengths: the method is described in algorithmic detail, the implementation is publicly available, scRNA-seq preprocessing is standardized, and a metric-oriented ablation is included. However, the central empirical claim of improved neighbourhood preservation is not directly measured anywhere in the manuscript; the only quantitative evidence is NMI between k-means clusters and annotated labels, which is not a neighbourhood-preservation metric. In addition, the two-phase refinement—the paper's main novelty—is not ablated on real datasets. These gaps currently leave the headline claims under-supported.
major comments (3)
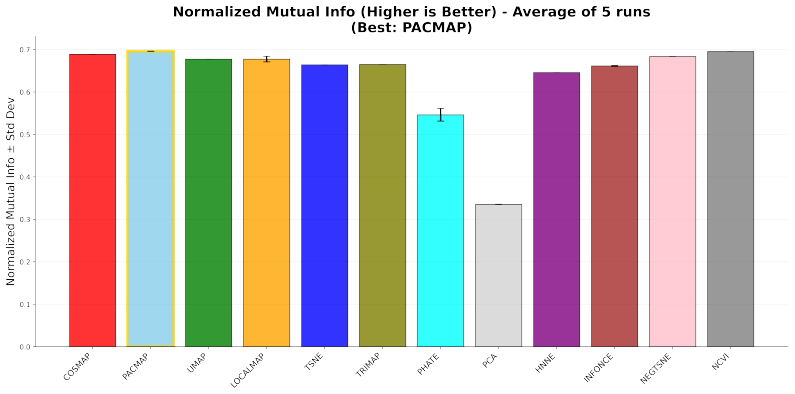
- [Section 4, Eqs. (13)–(14)] The abstract's claim that CosMAP 'improves neighbourhood preservation' is not supported by any direct neighbourhood-preservation metric. The only quantitative evaluation reported is NMI between ground-truth labels and k-means clusters of the 2D embeddings (Eq. 14). NMI measures cluster-label agreement, not local neighbourhood fidelity; a method that aggressively separates classes or fragments a coherent population can achieve high NMI while destroying local geometry. The Cortex result in Section 4.3 is a concrete example: CosMAP splits the endothelial-mural population into two subclusters, and PaCMAP obtains the highest NMI. To support the stated claim, the authors should report neighbourhood-preservation metrics (e.g., trustworthiness, continuity, co-k-nearest-neighbour agreement, or mean relative rank error) on at least MNIST, Retina, and Cortex, or temper the abstract's wording to reflect the evidence actually provided.
- [Section 4.4, Genealogical dataset] The per-method tuning protocol for the kinship dataset weakens the quantitative comparison. The text states that 'a per-method hyperparameter search' was performed and that Euclidean distance was fixed as the working metric because it is supported by all methods. As a result, the reported NMI advantage of CosMAP (Fig. 12) reflects tuned configurations, not a clean comparison of default settings. Furthermore, because the input is a pairwise kinship matrix, it is not specified whether the methods treat each individual as a feature vector (rows of the matrix) or use a precomputed dissimilarity structure; the construction of the k-NN graph for this dataset must be clarified. Without a controlled protocol (e.g., identical hyperparameter budgets or a sensitivity analysis over k), the claim that CosMAP provides 'clearer global organization' of genealogical patterns is not established.
- [Section 5 and Algorithm 3] The two-phase refinement is the central methodological contribution, but its benefit is not validated on real data. The paper itself states in Section 5 that the full refinement 'does not always provide a clear advantage' and can over-separate small datasets, as observed on Cortex in Section 4.3. The only quantitative ablation in Appendix 7.1 uses a synthetic make_blobs dataset and varies the metric and temperature; it does not compare the one-phase and two-phase versions. A head-to-head comparison of CosMAP with and without the second phase on MNIST, Retina, and Cortex would directly test whether reconstructing the k-NN graph from the intermediate embedding actually improves local and global structure. This is a load-bearing component of the contribution and should be addressed.
minor comments (6)
- [Throughout] There are several typographical issues: 'dimesional' in Section 2, 'V AEs' with unwanted spaces, 'InfoCE-t-SNE' instead of 'InfoNCE-t-SNE', inconsistent 'Cartagène'/'CARTaGENE', and 'the our experiments' in Appendix 7.2. These should be corrected in a revision.
- [Section 3.1, Eq. (4)] The term 'NT-Xent' is potentially misleading because Eq. (4) normalizes over the k-neighbourhood only, whereas the original NT-Xent loss normalizes over all samples in a batch. Suggest calling this a temperature-scaled local softmax to avoid conflating the two.
- [Section 4.1] For MNIST the text states that no normalization or standardization was applied, but the preprocessing for USPS is not described. Please state explicitly whether the same raw-feature treatment was used for USPS.
- [Section 4.4] The phrase 'the single choice supported by all methods' is ambiguous: should be clarified as Euclidean distance computed on rows of the kinship matrix, or on a transformed dissimilarity, so that readers understand what input each method actually receives.
- [Section 4.2, Retina discussion] The statement that 'BC3A/BC3B-related structure becomes partially visible' is vague; it would benefit from a quantitative measure or a more precise description of which cells are separated and under what conditions.
- [Appendix C] The Heart Cell Atlas, PBMC, and COIL-20 results appear only in an appendix and are not mentioned in the abstract or conclusion. Either integrate them into the main evaluation or explicitly state why they are excluded from the summary claims.
Circularity Check
No circular derivation: CosMAP's claims rest on fixed hyperparameters and post-hoc evaluation, with only non-load-bearing self-citation for genealogy preprocessing.
full rationale
Walking the derivation chain, Eq. (4) defines high-dimensional affinities from cosine k-NN with fixed temperature tau = 0.5; Eq. (6) defines low-dimensional similarities; Eq. (7) gives the BCE objective; Definition 1 and Algorithm 3 compose two CosMAP runs. No quantity used in the objective is fitted to the class labels or to the NMI scores that support the empirical claims; labels enter only after the embeddings are produced (Sections 4.1-4.4). Hyperparameters tau = 0.5, k = 15, and r = 30 are fixed in advance or chosen from a synthetic ablation in Appendix B, not from the evaluation datasets. The two-phase refinement is a compositional algorithm, not a tautology. The only author self-citation is [66] for GeneaKit kinship preprocessing and regional interpretation; it is not load-bearing for CosMAP's methodological derivation, so under Rule 4 it does not count as circularity. The abstract's claim that CosMAP 'improves neighbourhood preservation' is not directly measured—NMI measures k-means cluster-label agreement (Eq. 14), not neighbourhood preservation—but that is an evidence gap, not circularity, because the claim is not defined as the metric and no fitted parameter is renamed as a prediction.
Assumptions & free parameters
free parameters (7)
- temperature tau =
0.5
- neighborhood size k =
15
- intermediate embedding dimension r =
30
- negative_sample_rate m =
not stated in text
- repulsion weight gamma =
not stated in text
- low-dimensional kernel parameters a and b =
calibrated from UMAP min_dist and spread
- optimization schedule (epochs T, batch size B, initial learning rate alpha0, gradient clipping c) =
not stated
assumptions (4)
- domain assumption High-dimensional data approximately lie on a low-dimensional manifold, so a local neighborhood graph can capture intrinsic structure.
- domain assumption Cosine similarity on log-normalized counts is a better cell-cell similarity than Euclidean distance for sparse omics data.
- standard math The sampled BCE objective with negative sampling approximates the full repulsive sum well enough for faithful embeddings.
- ad hoc to paper Rebuilding the k-NN graph from an intermediate 30-dimensional embedding removes spurious edges rather than amplifying noise.
Cite this review
Pith. "Pith review of CosMAP: Contrastive Manifold Approximation and Projection for Dimensionality Reduction of Omics and Genealogical Data." pith.science (2026). https://pith.science/paper/ZM3MXL6K
@misc{pith2026260811269,
  author       = {Pith},
  title        = {Pith review of: CosMAP: Contrastive Manifold Approximation and Projection for Dimensionality Reduction of Omics and Genealogical Data},
  year         = {2026},
  howpublished = {\url{https://pith.science/paper/ZM3MXL6K}},
  note         = {Machine review of arXiv:2608.11269}
}
read the original abstract
Omics datasets, particularly single-cell RNA sequencing data, are high-dimensional, sparse, noisy, and dominated by zero values, making faithful low-dimensional representation challenging. Existing dimensionality-reduction methods may distort local neighbourhoods, global organization, or the cohesion of meaningful populations, with similar limitations arising in genealogical data. We introduce Contrastive Manifold Approximation and Projection (CosMAP), a graph-based unsupervised dimensionality-reduction method for producing faithful and interpretable embeddings. CosMAP extends the graph-based framework of UMAP by combining cosine-similarity neighbourhoods with temperature-normalized contrastive affinities, which are optimized in the embedding space using an attractive--repulsive objective. It further employs a two-phase refinement strategy: an intermediate higher-dimensional representation is first learned and then used to reconstruct the neighbourhood graph and initialize the final low-dimensional embedding. We evaluate CosMAP on MNIST and USPS handwritten-digit datasets, mouse retina and cortex single-cell RNA-sequencing datasets, and a large genealogical kinship dataset derived from BALSAC-CARTaGENE. Compared with state-of-the-art dimensionality-reduction methods, CosMAP produces more coherent visual representations, improves neighbourhood preservation, and provides clearer global organization of digit classes, biological cell populations, and regional genealogical patterns. These results indicate that CosMAP offers a robust framework for exploratory analysis of complex, sparse, high-dimensional data. The implementation is publicly available at https://github.com/FenosoaRandrianjatovo/CosMAP-dr.
Figures


Figures from the paper (15 more)




Reference graph
Works this paper leans on
-
[1]
Olsen, Benedict Paten, and Mark Akeson
Miten Jain, Hugh E. Olsen, Benedict Paten, and Mark Akeson. The Oxford Nanopore MinION: delivery of nanopore sequencing to the genomics community.Genome Biology, 17(1):239, November 2016
2016
-
[2]
Model-based dimensionality reduction for single-cell RNA-seq using generalized bilinear models.Biostatistics, 26(1):kxaf024, January 2025
Phillip B Nicol and Jeffrey W Miller. Model-based dimensionality reduction for single-cell RNA-seq using generalized bilinear models.Biostatistics, 26(1):kxaf024, January 2025
2025
-
[3]
Luecken and Fabian J
Malte D. Luecken and Fabian J. Theis. Current best practices in single-cell RNA-seq analysis: a tutorial.Molecular Systems Biology, 15(6):MSB188746, June 2019
2019
-
[4]
Spatial transcriptomics reveals substan- tial heterogeneity in triple-negative breast cancer with potential clinical implications.Nature Communications, 15(1):10232, November 2024
Xiaoxiao Wang, David Venet, Frédéric Lifrange, Denis Larsimont, Mattia Rediti, Linnea Stenbeck, Floriane Dupont, Ghizlane Rouas, Andrea Joaquin Garcia, Ligia Craciun, Lau- rence Buisseret, Michail Ignatiadis, Marcela Carausu, Nayanika Bhalla, Yuvarani Masarapu, Eva Gracia Villacampa, Lovisa Franzén, Sami Saarenpää, Linda Kvastad, Kim Thrane, Joakim 21 Lun...
2024
-
[5]
Carlo De Donno, Soroor Hediyeh-Zadeh, Amir Ali Moinfar, Marco Wagenstetter, Luke Zappia, Mohammad Lotfollahi, and Fabian J. Theis. Population-level integration of single-cell datasets enables multi-scale analysis across samples.Nature Methods, 20(11):1683–1692, November 2023
2023
-
[6]
Yahui Long, Kok Siong Ang, Raman Sethi, Sha Liao, Yang Heng, Lynn van Olst, Shuchen Ye, Chengwei Zhong, Hang Xu, Di Zhang, Immanuel Kwok, Nazihah Husna, Min Jian, Lai Guan Ng, Ao Chen, Nicholas R. J. Gascoigne, David Gate, Rong Fan, Xun Xu, and Jinmiao Chen. Deciphering spatial domains from spatial multi-omics with SpatialGlue.Nature Methods, 21(9):1658–1...
2024
-
[7]
Lecun, L
Y . Lecun, L. Bottou, Y . Bengio, and P. Haffner. Gradient-based learning applied to document recognition.Proceedings of the IEEE, 86(11):2278–2324, November 1998
1998
-
[8]
A Simple Framework for Contrastive Learning of Visual Representations
Ting Chen, Simon Kornblith, Mohammad Norouzi, and Geoffrey Hinton. A Simple Framework for Contrastive Learning of Visual Representations. InProceedings of the 37th International Conference on Machine Learning, pages 1597–1607. PMLR, November 2020
2020
Show all 88 references
-
[9]
Gomez, Lukasz Kaiser, and Illia Polosukhin
Ashish Vaswani, Noam Shazeer, Niki Parmar, Jakob Uszkoreit, Llion Jones, Aidan N. Gomez, Lukasz Kaiser, and Illia Polosukhin. Attention Is All You Need, August 2023. arXiv:1706.03762 [cs]
2023 arXiv
-
[10]
Dimension Reduction with Locally Adjusted Graphs, December 2024
Yingfan Wang, Yiyang Sun, Haiyang Huang, and Cynthia Rudin. Dimension Reduction with Locally Adjusted Graphs, December 2024. arXiv:2412.15426 [cs]
2024
-
[11]
Haiyang Huang, Yingfan Wang, Cynthia Rudin, and Edward P. Browne. Towards a com- prehensive evaluation of dimension reduction methods for transcriptomic data visualization. Communications Biology, 5(1):719, July 2022
2022
-
[12]
Fleischer
Mohammad Tariqul Islam and Jason W. Fleischer. The Shape of Attraction in UMAP: Exploring the Embedding Forces in Dimensionality Reduction, March 2025. arXiv:2503.09101 [cs]
2025 arXiv
-
[13]
Ebony Rose Watson, Ariane Mora, Atefeh Taherian Fard, and Jessica Cara Mar. How does the structure of data impact cell–cell similarity? Evaluating how structural properties influence the performance of proximity metrics in single cell RNA-seq data.Briefings in Bioinformatics, ...
2022
-
[14]
A mathematical theory of adaptive control processes
Richard Bellman and Robert Kalaba. A mathematical theory of adaptive control processes. Proceedings of the National Academy of Sciences, 45(8):1288–1290, August 1959
1959
-
[15]
Jaskowiak, Ricardo J
Pablo A. Jaskowiak, Ricardo J. G. B. Campello, and Ivan G. Costa. On the selection of appropriate distances for gene expression data clustering.BMC bioinformatics, 15 Suppl 2(Suppl 2):S2, 2014
2014
-
[16]
Manifold Learning-based Methods for Analyzing Single-Cell RNA-Sequencing Data.Current Opinion in Systems Biology, 7, December 2017
Kevin Moon, Jay Stanley, Daniel Burkhardt, David Dijk, Guy Wolf, and Smita Krishnaswamy. Manifold Learning-based Methods for Analyzing Single-Cell RNA-Sequencing Data.Current Opinion in Systems Biology, 7, December 2017
2017
-
[17]
Hadsell, S
R. Hadsell, S. Chopra, and Y . LeCun. Dimensionality Reduction by Learning an Invariant Mapping. In2006 IEEE Computer Society Conference on Computer Vision and Pattern Recognition (CVPR’06), volume 2, pages 1735–1742, June 2006. ISSN: 1063-6919
2006
-
[18]
Distributed Repre- sentations of Words and Phrases and their Compositionality, October 2013
Tomas Mikolov, Ilya Sutskever, Kai Chen, Greg Corrado, and Jeffrey Dean. Distributed Repre- sentations of Words and Phrases and their Compositionality, October 2013. arXiv:1310.4546 [cs]
2013 arXiv
-
[19]
Surpassing Cosine Similarity for Multidimensional Comparisons: Dimension Insensitive Euclidean Metric, March 2025
Federico Tessari, Kunpeng Yao, and Neville Hogan. Surpassing Cosine Similarity for Multidimensional Comparisons: Dimension Insensitive Euclidean Metric, March 2025. arXiv:2407.08623 [cs] version: 4. 22
2025 arXiv
-
[20]
Karl Pearson. LIII. On lines and planes of closest fit to systems of points in space.The London, Edinburgh, and Dublin Philosophical Magazine and Journal of Science, 2(11):559– 572, November 1901. _eprint: https://doi.org/10.1080/14786440109462720
1901 doi
-
[21]
Ian. T. Jolliffe.Principal Component Analysis. Springer Series in Statistics, New York, NY , USA, 2 edition, 2002
2002
-
[22]
Jolliffe and Jorge Cadima
Ian T. Jolliffe and Jorge Cadima. Principal component analysis: a review and recent devel- opments.Philosophical Transactions. Series A, Mathematical, Physical, and Engineering Sciences, 374(2065):20150202, April 2016
2016
-
[23]
Torgerson.Theory and methods of scaling
Warren S. Torgerson.Theory and methods of scaling. Theory and methods of scaling. Wiley, Oxford, England, 1958. Pages: xiii, 460
1958
-
[25]
William Townes, Stephanie C
F. William Townes, Stephanie C. Hicks, Martin J. Aryee, and Rafael A. Irizarry. Feature selection and dimension reduction for single-cell RNA-Seq based on a multinomial model. Genome Biology, 20(1):295, December 2019
2019
-
[26]
C. O. S. Sorzano, J. Vargas, and A. Pascual Montano. A survey of dimensionality reduction techniques, March 2014. arXiv:1403.2877 [stat]
2014 arXiv
-
[27]
J. B. Kruskal. Multidimensional scaling by optimizing goodness of fit to a nonmetric hypothesis. Psychometrika, 29(1):1–27, March 1964
1964
-
[28]
Roweis and Lawrence K
Sam T. Roweis and Lawrence K. Saul. Nonlinear Dimensionality Reduction by Locally Linear Embedding.Science, 290(5500):2323–2326, December 2000
2000
-
[29]
Laplacian Eigenmaps for dimensionality reduction and data representation.Neural Comput., 15(6):1373–1396, June 2003
Mikhail Belkin and Partha Niyogi. Laplacian Eigenmaps for dimensionality reduction and data representation.Neural Comput., 15(6):1373–1396, June 2003
2003
-
[30]
Coifman and Stéphane Lafon
Ronald R. Coifman and Stéphane Lafon. Diffusion maps.Applied and Computational Harmonic Analysis, 21(1):5–30, July 2006
2006
-
[31]
Stochastic Neighbor Embedding
Geoffrey E Hinton and Sam Roweis. Stochastic Neighbor Embedding. InAdvances in Neural Information Processing Systems, volume 15. MIT Press, 2002
2002
-
[32]
Visualizing Data using t-SNE.Journal of Machine Learning Research, 9(86):2579–2605, 2008
Laurens van der Maaten and Geoffrey Hinton. Visualizing Data using t-SNE.Journal of Machine Learning Research, 9(86):2579–2605, 2008
2008
-
[33]
Visualizing Large-scale and High- dimensional Data
Jian Tang, Jingzhou Liu, Ming Zhang, and Qiaozhu Mei. Visualizing Large-scale and High- dimensional Data. InProceedings of the 25th International Conference on World Wide Web, pages 287–297, April 2016. arXiv:1602.00370 [cs]
2016 arXiv
-
[34]
Ehsan Amid and Manfred K. Warmuth. TriMap: Large-scale Dimensionality Reduction Using Triplets, March 2022. arXiv:1910.00204 [cs]
2022 arXiv
-
[35]
UMAP: Uniform Manifold Approximation and Projection for Dimension Reduction, September 2020
Leland McInnes, John Healy, and James Melville. UMAP: Uniform Manifold Approximation and Projection for Dimension Reduction, September 2020. arXiv:1802.03426 [stat]
2020 arXiv
-
[36]
Hamprecht, and Dmitry Kobak
Sebastian Damrich, Jan Niklas Böhm, Fred A. Hamprecht, and Dmitry Kobak. From $t$-SNE to UMAP with contrastive learning, February 2023. arXiv:2206.01816 [cs.LG]
2023 arXiv
-
[37]
Understanding How Dimension Reduction Tools Work: An Empirical Approach to Deciphering t-SNE, UMAP, TriMAP, and PaCMAP for Data Visualization, August 2021
Yingfan Wang, Haiyang Huang, Cynthia Rudin, and Yaron Shaposhnik. Understanding How Dimension Reduction Tools Work: An Empirical Approach to Deciphering t-SNE, UMAP, TriMAP, and PaCMAP for Data Visualization, August 2021. arXiv:2012.04456 [cs]
2021 arXiv
-
[38]
Kingma and Max Welling
Diederik P. Kingma and Max Welling. Auto-Encoding Variational Bayes, December 2022. arXiv:1312.6114 [stat]
2022 arXiv
-
[39]
Cole, Michael I
Romain Lopez, Jeffrey Regier, Michael B. Cole, Michael I. Jordan, and Nir Yosef. Deep generative modeling for single-cell transcriptomics.Nature Methods, 15(12):1053–1058, December 2018. 23
2018
-
[40]
Theis, Aaron Streets, Michael I
Adam Gayoso, Romain Lopez, Galen Xing, Pierre Boyeau, Katherine Wu, Michael Jayasuriya, Edouard Melhman, Maxime Langevin, Yining Liu, Jules Samaran, Gabriel Misrachi, Achille Nazaret, Oscar Clivio, Chenling Xu, Tal Ashuach, Mohammad Lotfollahi, Valentine Svensson, Eduardo da V...
2021
-
[41]
Similarity-assisted variational autoencoder for nonlinear dimension reduction with application to single-cell RNA sequencing data.BMC Bioinformatics, 24(1):432, November 2023
Gwangwoo Kim and Hyonho Chun. Similarity-assisted variational autoencoder for nonlinear dimension reduction with application to single-cell RNA sequencing data.BMC Bioinformatics, 24(1):432, November 2023
2023
-
[42]
Graving and Iain D
Jacob M. Graving and Iain D. Couzin. V AE-SNE: a deep generative model for simultaneous dimensionality reduction and clustering, July 2020. Pages: 2020.07.17.207993 Section: New Results
2020
-
[43]
A deep generative model for multi-view profiling of single-cell RNA-seq and ATAC-seq data.Genome Biology, 23(1):20, January 2022
Gaoyang Li, Shaliu Fu, Shuguang Wang, Chenyu Zhu, Bin Duan, Chen Tang, Xiaohan Chen, Guohui Chuai, Ping Wang, and Qi Liu. A deep generative model for multi-view profiling of single-cell RNA-seq and ATAC-seq data.Genome Biology, 23(1):20, January 2022
2022
-
[44]
Dean, Jerome Anthony E
Scott N. Dean, Jerome Anthony E. Alvarez, Dan Zabetakis, Scott A. Walper, and Anthony P. Malanoski. PepV AE: Variational Autoencoder Framework for Antimicrobial Peptide Generation and Activity Prediction.Frontiers in Microbiology, 12, September 2021
2021
-
[45]
Contrastive Learning with Similarity Enhancement for Dimensionality Reduction.Engineering Applications of Artificial Intelligence, 161:112266, December 2025
Qi Yang, Changpeng Wang, Linlin Feng, Lizhen Ji, and Jiangshe Zhang. Contrastive Learning with Similarity Enhancement for Dimensionality Reduction.Engineering Applications of Artificial Intelligence, 161:112266, December 2025
2025
-
[46]
NCVis: Noise Contrastive Approach for Scalable Visualization, January 2020
Aleksandr Artemenkov and Maxim Panov. NCVis: Noise Contrastive Approach for Scalable Visualization, January 2020. arXiv:2001.11411 [stat]
2020 arXiv
-
[47]
Node Embeddings via Neighbor Embeddings, November 2025
Jan Niklas Böhm, Marius Keute, Alica Guzmán, Sebastian Damrich, Andrew Draganov, and Dmitry Kobak. Node Embeddings via Neighbor Embeddings, November 2025. arXiv:2503.23822 [cs]
2025 arXiv
-
[48]
Scikit-learn: Machine Learning in Python, June 2018
Fabian Pedregosa, Gaël Varoquaux, Alexandre Gramfort, Vincent Michel, Bertrand Thirion, Olivier Grisel, Mathieu Blondel, Andreas Müller, Joel Nothman, Gilles Louppe, Peter Pretten- hofer, Ron Weiss, Vincent Dubourg, Jake Vanderplas, Alexandre Passos, David Cournapeau, Matthieu...
2018 arXiv
-
[49]
Aggarwal, Alexander Hinneburg, and Daniel A
Charu C. Aggarwal, Alexander Hinneburg, and Daniel A. Keim. On the Surprising Behavior of Distance Metrics in High Dimensional Space. In Gerhard Goos, Juris Hartmanis, Jan Van Leeuwen, Jan Van Den Bussche, and Victor Vianu, editors,Database Theory — ICDT 2001, volume 1973, pag...
2001
-
[50]
Unsupervised visualization of image datasets using contrastive learning, February 2023
Jan Niklas Böhm, Philipp Berens, and Dmitry Kobak. Unsupervised visualization of image datasets using contrastive learning, February 2023. arXiv:2210.09879 [cs]
2023 arXiv
-
[51]
Laplacian eigenmaps and spectral techniques for embedding and clustering
Mikhail Belkin and Partha Niyogi. Laplacian eigenmaps and spectral techniques for embedding and clustering. InProceedings of the 15th International Conference on Neural Information Processing Systems: Natural and Synthetic, NIPS’01, pages 585–591, Cambridge, MA, USA, January 2...
2001
-
[52]
Moon, David van Dijk, Zheng Wang, Scott Gigante, Daniel B
Kevin R. Moon, David van Dijk, Zheng Wang, Scott Gigante, Daniel B. Burkhardt, William S. Chen, Kristina Yim, Antonia van den Elzen, Matthew J. Hirn, Ronald R. Coifman, Natalia B. Ivanova, Guy Wolf, and Smita Krishnaswamy. Visualizing structure and transitions in high- dimensi...
2019
-
[53]
Saquib Sarfraz, Marios Koulakis, Constantin Seibold, and Rainer Stiefelhagen
M. Saquib Sarfraz, Marios Koulakis, Constantin Seibold, and Rainer Stiefelhagen. Hierarchi- cal Nearest Neighbor Graph Embedding for Efficient Dimensionality Reduction, May 2022. arXiv:2203.12997 [cs]. 24
2022 arXiv
-
[54]
J.J. Hull. A database for handwritten text recognition research.IEEE Transactions on Pattern Analysis and Machine Intelligence, 16(5):550–554, May 1994
1994
-
[55]
Alexander Wolf, Philipp Angerer, and Fabian J
F. Alexander Wolf, Philipp Angerer, and Fabian J. Theis. SCANPY: large-scale single-cell gene expression data analysis.Genome Biology, 19(1):15, February 2018
2018
-
[56]
Mauck, Yuhan Hao, Marlon Stoeckius, Peter Smibert, and Rahul Satija
Tim Stuart, Andrew Butler, Paul Hoffman, Christoph Hafemeister, Efthymia Papalexi, William M. Mauck, Yuhan Hao, Marlon Stoeckius, Peter Smibert, and Rahul Satija. Compre- hensive Integration of Single-Cell Data.Cell, 177(7):1888–1902.e21, June 2019
1902
-
[57]
Jiarui Ding, Anne Condon, and Sohrab P. Shah. Interpretable dimensionality reduction of single cell transcriptome data with deep generative models.Nature Communications, 9(1):2002, May 2018
2002
-
[58]
Garcia, Emma R
Ryoji Amamoto, Mauricio D. Garcia, Emma R. West, Jiho Choi, Sylvain W. Lapan, Elizabeth A. Lane, Norbert Perrimon, and Constance L. Cepko. Probe-Seq enables transcriptional profiling of specific cell types from heterogeneous tissue by RNA-based isolation.eLife, 8:e51452, December 2019
2019
-
[59]
Classification of Mouse Retinal Bipolar Cells: Type- Specific Connectivity with Special Reference to Rod-Driven AII Amacrine Pathways.Frontiers in Neuroanatomy, 11:92, 2017
Yoshihiko Tsukamoto and Naoko Omi. Classification of Mouse Retinal Bipolar Cells: Type- Specific Connectivity with Special Reference to Rod-Driven AII Amacrine Pathways.Frontiers in Neuroanatomy, 11:92, 2017
2017
-
[60]
Simon, Maria Mircea, Nikola S
Gökcen Eraslan, Lukas M. Simon, Maria Mircea, Nikola S. Mueller, and Fabian J. Theis. Single- cell RNA-seq denoising using a deep count autoencoder.Nature Communications, 10(1):390, January 2019
2019
-
[61]
Cluster Ensembles - A Knowledge Reuse Framework for Combining Multiple Partitions.Journal of Machine Learning Research, 3:583–617, January 2002
Alexander Strehl and Joydeep Ghosh. Cluster Ensembles - A Knowledge Reuse Framework for Combining Multiple Partitions.Journal of Machine Learning Research, 3:583–617, January 2002
2002
-
[62]
Dimensionality Reduction for Clustering of Nonlinear Industrial Data: A Tutorial.Korean Journal of Chemical Engineering, 42(5):987–1001, May 2025
Hae Rang Roh, Chae Sun Kim, Yongseok Lee, and Jong Min Lee. Dimensionality Reduction for Clustering of Nonlinear Industrial Data: A Tutorial.Korean Journal of Chemical Engineering, 42(5):987–1001, May 2025
2025
-
[63]
Amit Zeisel, Ana B. Muñoz-Manchado, Simone Codeluppi, Peter Lönnerberg, Gioele La Manno, Anna Juréus, Sueli Marques, Hermany Munguba, Liqun He, Christer Betsholtz, Charlotte Rolny, Gonçalo Castelo-Branco, Jens Hjerling-Leffler, and Sten Linnarsson. Brain structure. Cell types ...
2015
-
[64]
Hélène Vézina, Marc St-Hilaire, Jean-Sébastien Bournival, and Claude Bellavance. The Linkage of Microcensus Data and Vital Records: an Assessment of Results on Quebec Historical Popula- tion Data (1852–1911).Historical Methods: A Journal of Quantitative and Interdisciplinary H...
1911
-
[65]
Efficient computation of the kinship coefficients.Bioinformatics, 35(6):1002–1008, March 2019
Brent Kirkpatrick, Shufei Ge, and Liangliang Wang. Efficient computation of the kinship coefficients.Bioinformatics, 35(6):1002–1008, March 2019
2019
-
[66]
Gilles-Philippe Morin, Claudia Moreau, Amadou Barry, and Simon L. Girard. Fine-scale struc- ture of a whole regional population through genetics and genealogies.Nature Communications, 17(1):3342, March 2026
2026
-
[67]
GENLIB: an R package for the analysis of genealogical data.BMC Bioinformatics, 16:160, May 2015
Héloïse Gauvin, Jean-François Lefebvre, Claudia Moreau, Eve-Marie Lavoie, Damian Labuda, Hélène Vézina, and Marie-Hélène Roy-Gagnon. GENLIB: an R package for the analysis of genealogical data.BMC Bioinformatics, 16:160, May 2015
2015
-
[68]
On the genes, genealogies, and geographies of Quebec.Science, 380(6647):849–855, May 2023
Luke Anderson-Trocmé, Dominic Nelson, Shadi Zabad, Alex Diaz-Papkovich, Ivan Kryukov, Nikolas Baya, Mathilde Touvier, Ben Jeffery, Christian Dina, Hélène Vézina, Jerome Kelle- her, and Simon Gravel. On the genes, genealogies, and geographies of Quebec.Science, 380(6647):849–85...
2023
-
[69]
PyTorch: An Imperative Style, High-Performance Deep Learning Library, December 2019
Adam Paszke, Sam Gross, Francisco Massa, Adam Lerer, James Bradbury, Gregory Chanan, Trevor Killeen, Zeming Lin, Natalia Gimelshein, Luca Antiga, Alban Desmaison, Andreas Köpf, Edward Yang, Zach DeVito, Martin Raison, Alykhan Tejani, Sasank Chilamkurthy, Benoit Steiner, Lu Fan...
2019 arXiv
-
[70]
Harris, K
Charles R. Harris, K. Jarrod Millman, Stéfan J. van der Walt, Ralf Gommers, Pauli Virtanen, David Cournapeau, Eric Wieser, Julian Taylor, Sebastian Berg, Nathaniel J. Smith, Robert Kern, Matti Picus, Stephan Hoyer, Marten H. van Kerkwijk, Matthew Brett, Allan Haldane, Jaime Fe...
2020 arXiv
-
[71]
The Faiss library, October
Matthijs Douze, Alexandr Guzhva, Chengqi Deng, Jeff Johnson, Gergely Szilvasy, Pierre- Emmanuel Mazaré, Maria Lomeli, Lucas Hosseini, and Hervé Jégou. The Faiss library, October
-
[72]
Efficient k-nearest neighbor graph construction for generic similarity measures | Proceedings of the 20th international conference on World wide web
-
[73]
Numba: a LLVM-based Python JIT compiler
Siu Kwan Lam, Antoine Pitrou, and Stanley Seibert. Numba: a LLVM-based Python JIT compiler. InProceedings of the Second Workshop on the LLVM Compiler Infrastructure in HPC, pages 1–6, Austin Texas, November 2015. ACM
2015
-
[74]
Oliphant, Matt Haberland, Tyler Reddy, David Cournapeau, Evgeni Burovski, Pearu Peterson, Warren Weckesser, Jonathan Bright, Stéfan J
Pauli Virtanen, Ralf Gommers, Travis E. Oliphant, Matt Haberland, Tyler Reddy, David Cournapeau, Evgeni Burovski, Pearu Peterson, Warren Weckesser, Jonathan Bright, Stéfan J. van der Walt, Matthew Brett, Joshua Wilson, K. Jarrod Millman, Nikolay Mayorov, Andrew R. J. Nelson, E...
2020
-
[75]
HowUMAPWorks/HowUMAPWorks.ipynb at master · NikolayOskolkov/HowUMAPWorks
-
[76]
pandas: a Foundational Python Library for Data Analysis and Statistics.Python High Performance Science Computer, January 2011
Wes Mckinney. pandas: a Foundational Python Library for Data Analysis and Statistics.Python High Performance Science Computer, January 2011
2011
-
[77]
John D. Hunter. Matplotlib: A 2D Graphics Environment.Computing in Science & Engineering, 9(3):90–95, May 2007
2007
-
[78]
Moon, David van Dijk, Zheng Wang, Scott Gigante, Daniel B
Kevin R. Moon, David van Dijk, Zheng Wang, Scott Gigante, Daniel B. Burkhardt, William S. Chen, Kristina Yim, Antonia van den Elzen, Matthew J. Hirn, Ronald R. Coifman, Natalia B. Ivanova, Guy Wolf, and Smita Krishnaswamy. Visualizing Structure and Transitions for Biological D...
2019
-
[79]
Hamprecht
Sebastian Damrich and Fred A. Hamprecht. On UMAP’s true loss function, April 2021. arXiv:2103.14608 [cs.LG]
2021 arXiv
-
[80]
How UMAP Works — umap 0.5.8 documentation
-
[81]
Worth, Eric L
Monika Litvi ˇnuková, Carlos Talavera-López, Henrike Maatz, Daniel Reichart, Catherine L. Worth, Eric L. Lindberg, Masatoshi Kanda, Krzysztof Polanski, Matthias Heinig, Michael Lee, Emily R. Nadelmann, Kenny Roberts, Liz Tuck, Eirini S. Fasouli, Daniel M. DeLaughter, Bar- bara...
2020
-
[83]
InitializeYusing PCA, spectral embedding, random initialization, or a user-provided array
-
[84]
Construct thek-nearest-neighbor graph fromXby using the user-provided metric
-
[85]
Compute the symmetric affinity weightsp ij according to Equation 5
-
[86]
Return:Y
OptimizeYby minimizing the sampled binary cross-entropy objective defined in Equation 16 using the Algorithm 1. Return:Y. 6.2 CosMAP refinement pipeline Algorithm Algorithm 3:CosMAP refinement pipeline Input:data matrix X, number of neighborsk, embedding dimensiond, intermedia...
-
[87]
Apply Algorithm 2 toXwith embedding dimensionr, using PCA, spectral initialization, random initialization, or a user-provided array: X dim=r −−−−−→ CosMAP Yr
-
[88]
Initialize the second phase with the firstdcoordinates ofY r: Y(d) =Y r[:,1 :d]
-
[89]
Return:Y final
Apply Algorithm 2 again, usingY r as input andY (d) as initialization: Yr dim=d,init=Y (d) −−−−−−−−−−−→ CosMAP Yfinal. Return:Y final. In practice,r is chosen larger than the final visualization dimension, for exampler= 30 orr= 50 , whiled= 2for planar visualization. 29 Append...
-
[2025]
arXiv:2401.08281 [cs.LG]
Reviewed August 15, 2026 · model on record in the stance chip above.
Discussion (0). Continue with ORCID to comment.