REVIEW 3 major objections 4 minor 15 references
Intra-day Equity Price Prediction using Deep Learning as a Measure of Market Efficiency
T0 review · 3 major / 4 minor · reviewed 2026-08-14 · deepseek-v4-flash
Pith's one-line read The paper argues that the profitability of simple machine-learning trading strategies is a valid objective measure of weak-form market efficiency, and that this profitability disappeared around October 2008, coinciding with the peak of…
desk verdict A clear, honest study that proposes ML strategy profitability as a weak-form efficiency meter and documents a real decline in gross predictability around 2008, but the zero-cost backtest leaves the central 'profitable before 2009' claim unestablished. read the letter →
The pith
A machine-rendered reading of the paper's core claim, the machinery that carries it, and where it could break.
The reading
What carries the argument
The key objects are the two reference trading systems — a fully connected feedforward neural network with two hidden layers (180 and 20 units, ReLU, Adam, early stopping) and an L2-regularized logistic regressor — each split into a long model and a short model trained on universe-relative cumulative returns ending one minute before the trade, with a monthly hyperparameter grid search over entry minute (end x ∈ {−5, −10, −30}) and movement threshold (bps ∈ {2, 5, 10, 25}) optimizing trade precision on a validation month. A random classifier trained and evaluated identically serves as the control. The mechanism these systems carry is the measurement: their daily returns, evaluated in a long/short balanced portfolio on the top-500-by-dollar-volume universe, are read as a direct probe of weak-form efficiency, with higher profitability indicating lower efficiency.
What would settle it
Re-run the same rolling monthly training and evaluation procedure on minute-bar data while charging a realistic round-trip transaction cost of at least five basis points per trade and a one-minute execution delay; if the early-period daily returns drop to zero or below, the profitability-based efficiency measure loses its empirical support.
Extended reading notes
Core claim
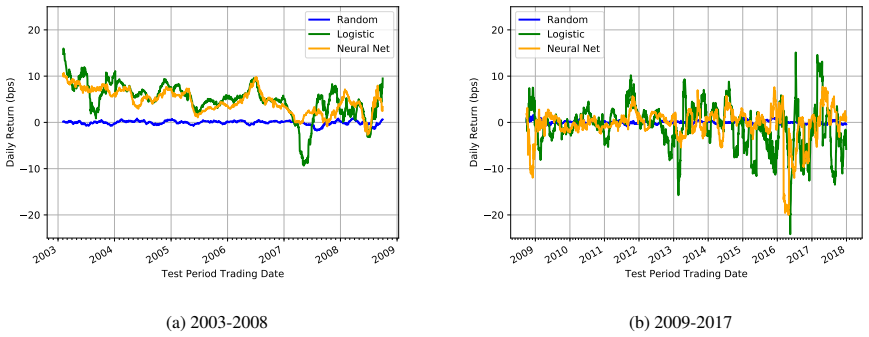
On the paper's own terms, the central claim is that future intra-day stock prices could be predicted effectively, and profitably traded, until about October 2008 — that is, the weak-form efficient market hypothesis did not hold in US equities during 2003–2008 — and that the same two simple learning algorithms could no longer extract profit after 2009. The evidence is a monthly rolling backtest on one-minute bars for the top 500 stocks by dollar volume, with a long/short balanced portfolio evaluated on daily returns, cumulative returns, and trade precision. The neural-network strategy returned 4.6 basis points per day (93.5% cumulative) before the break and −0.4 basis points after; the logistic-regression strategy returned 4.9 basis points (101.6%) before and −0.9 after; the random control stayed at zero throughout. The authors propose that the time-varying profitability of such flexible learners constitutes an objective measure of relative market efficiency, and they observe that the profitability decline coincides with the rise of high-frequency trading volume, with a Pearson correlation of −0.552 between HFT share and model returns before the 2008 peak and 0.038 afterward.
Load-bearing premise
The backtest assumes that every order is filled at the recorded one-minute close price with zero transaction costs, slippage, and market impact, so if realistic intra-day round-trip costs exceed the reported four to five basis points of daily return, the claimed profitability and the efficiency inference collapse.
Editorial extensions
If this is right
- If the central claim is correct, weak-form market efficiency in US equities increased sharply around October 2008, and the period 2003–2008 contained exploitable intraday inefficiencies.
- The same methodology can be applied as a relative efficiency gauge: any market, asset class, or time period in which these reference learners earn positive returns is comparatively less efficient than one in which they do not.
- The near-zero returns of the random classifier throughout the study confirm that the early profitability is attributable to real predictive information in the price data rather than to the long/short portfolio construction.
- The strong negative correlation between HFT volume share and model returns before the peak, and its absence afterward, supports the candidate explanation that the rise of high-frequency trading drove the market toward efficiency, though the authors note the evidence is a single historical event.
Reading between the lines
- The same measurement recipe could be applied to other markets (e.g., European or emerging-market equities, cryptocurrency pairs) where high-frequency trading grew at different times, turning the single historical event into a panel of natural experiments.
- Because the reference learners are deliberately simple, the method could be strengthened by stress-testing the efficiency inference against more flexible learners (e.g., gradient-boosted trees or LSTMs) to see whether the post-2009 flatness is specific to the chosen models.
- The paper's proposed agent-based simulation follow-up could be run with multiple HFT introductions to assess whether the negative correlation between HFT share and model returns is causal or coincidental.
Signed reviews
Editorial analysis
A structured set of objections, weighed in public.
Referee Report
Summary. The paper proposes using the profitability of two simple machine learning trading strategies—a neural network and a logistic regression—as an objective measure of relative weak-form market efficiency. Using NYSE TAQ data from 2003 to 2017 and a monthly roll-forward training/validation/test design on the 500 most actively traded US stocks, the authors report average daily gross returns of 4.6–4.9 basis points in the period before October 2008 and near-zero or negative returns afterward, while a random classifier control earns zero. They interpret the decline as evidence that US equity markets became more weak-form efficient over time and present a candidate explanation based on the rise of high-frequency trading volume, while acknowledging the single-event nature of that comparison.
Significance. If the empirical claims were robust, the paper would make a useful contribution by operationalizing market efficiency as the out-of-sample profitability of flexible ML learners and by documenting a historical decline in a specific class of intra-day predictability. Strengths include a clear experimental protocol with separate training, validation, and test periods, the use of a random classifier as a control, universe-relative features to reduce market beta, and explicit discussion of the N=1 limitation of the HFT correlation. These design choices are commendable. However, the central evidence for pre-2009 inefficiency is gross of transaction costs, and the break date is selected after seeing the data; both issues are load-bearing for the paper's main conclusion.
major comments (3)
- [Evaluation (Methodology) and Table 1] All reported returns are gross of transaction costs, slippage, and market impact. The strategy takes a daily balanced long/short portfolio in the 500 most-traded stocks, entering one minute after the prediction minute and exiting at the close, so each position incurs at least one round trip per day. Table 1 reports average early-period daily returns of 4.6 bps (Neural) and 4.9 bps (Logistic). For US equities in 2003–2008, realistic round-trip costs—quoted spreads, commissions, and impact—were commonly in the 5–20 bps range, especially in the earlier part of the sample. The paper provides no cost model, no break-even analysis, and no sensitivity check. If net-of-cost returns are non-positive in both periods, the profitability evidence for weak-form inefficiency before 2009, and hence the relative-efficiency inference built on it, collapses. This is the central load-bearing issue.
- [Experimental Results (break date selection)] The division into 'early' and 'late' periods is made after observing the data: the text states 'we observed an abrupt change in market efficiency after October 10, 2008 ... Accordingly, we selected the September/October 2008 boundary.' A post hoc break date inflates the apparent difference between periods and makes the reported early/late statistics, correlations, and figures uninterpretable as confirmatory evidence. The authors should either pre-specify the break (for example, using a known regulatory or structural event) or apply a formal structural-break test (e.g., Bai-Perron or a Chow test on the monthly return series) and report how the conclusions depend on the chosen breakpoint.
- [Table 1 and Figures 1–4] No measures of uncertainty are provided for the key quantities. The claim that early-period returns are positive and late-period returns are zero rests on average daily returns of 4.6–4.9 bps versus -0.4 to -0.9 bps, but the paper reports no standard errors, t-statistics, bootstrap intervals, or number of daily observations underlying these means. Figure 3 suggests overlapping return distributions across periods. The authors should report significance tests (e.g., Newey-West adjusted t-tests for daily return series with autocorrelation) and show that the early-late difference is not attributable to a few volatile months around the 2008 crisis.
minor comments (4)
- [Experimental Results (text and Figure 5)] The exact break date is inconsistent: the text says 'after October 10, 2008' and 'at September 30, 2008' in different places; this should be made consistent and stated precisely.
- [Figure 6] The Pearson correlation of -0.552 between HFT ratio and model monthly return is computed on two highly autocorrelated series; the effective sample size is much smaller than the number of months, so the correlation should be accompanied by a test that accounts for serial correlation (e.g., HAC standard errors or a test on differenced series).
- [Abstract and text] Minor language issues: 'can traced' should be 'can be traced'; 'Avaramovic' appears misspelled in the Discussion; 'neither of them are profitable' should be 'neither of them is profitable.'
- [Approach] The description of the long/short allocation says the strategy will not trade at all when there are no short predictions; it would be helpful to state how often the random classifier and the ML classifiers produced non-trading days, since this affects the interpretation of average daily returns.
Circularity Check
No significant circularity: the profitability measure is computed independently of the HFT correlation and no self-citation chain is load-bearing.
full rationale
The paper's central empirical claim is that two ML trading strategies earned positive gross returns before 2009 and did not afterward, based on a rolling train/validate/test design over TAQ minute bars. The return calculations are independent of the HFT volume series used in the later correlational explanation, and the HFT data come from Avramovic's external Credit Suisse whitepaper. Hyperparameters are selected on a validation month and returns are reported on held-out test months, so the reported profitability is not an in-sample fit renamed as a prediction. The efficiency interpretation is an explicitly stated operational definition ('if an algorithm can predict a future price and profit from it, the market is less efficient'), not a fitted parameter or a result forced by construction. There are no load-bearing self-citations, no imported uniqueness theorems, and no ansatz smuggled in via citation. The September/October 2008 break date, while potentially a post hoc selection, is not circular reasoning because no quantity from the HFT correlation feeds back into the profitability computation. The paper is self-contained against external benchmarks, so no circular step is exhibited.
Assumptions & free parameters
free parameters (3)
- Break date between early and late eras =
2008-09-30 (test period split)
- Hyperparameters (entry minute end_x, movement threshold bps) =
end_x in {-5,-10,-30}, bps in {2,5,10,25}, selected monthly by validation precision
- Neural network architecture and universe size =
two hidden layers (180, 20), ReLU, top 500 stocks by dollar volume
assumptions (4)
- domain assumption TAQ trade data accurately records executed prices at one-second/millisecond resolution and minute bars derived from it are correct.
- domain assumption All strategy orders can be filled at the one-minute close prices with zero transaction costs and no market impact.
- domain assumption The random classifier has expected trade precision 0.5 under universe-relative returns, making it a valid control.
- domain assumption The HFT volume ratio series from Avramovic (2017) is an accurate measure of high-frequency trading share.
Cite this review
Pith. "Pith review of Intra-day Equity Price Prediction using Deep Learning as a Measure of Market Efficiency." pith.science (2026). https://pith.science/paper/2627S4UH
@misc{pith2026190808168,
  author       = {Pith},
  title        = {Pith review of: Intra-day Equity Price Prediction using Deep Learning as a Measure of Market Efficiency},
  year         = {2026},
  howpublished = {\url{https://pith.science/paper/2627S4UH}},
  note         = {Machine review of arXiv:1908.08168}
}
read the original abstract
In finance, the weak form of the Efficient Market Hypothesis asserts that historic stock price and volume data cannot inform predictions of future prices. In this paper we show that, to the contrary, future intra-day stock prices could be predicted effectively until 2009. We demonstrate this using two different profitable machine learning-based trading strategies. However, the effectiveness of both approaches diminish over time, and neither of them are profitable after 2009. We present our implementation and results in detail for the period 2003-2017 and propose a novel idea: the use of such flexible machine learning methods as an objective measure of relative market efficiency. We conclude with a candidate explanation, comparing our returns over time with high-frequency trading volume, and suggest concrete steps for further investigation.
Figures


Figures from the paper (4 more)


Reference graph
Works this paper leans on
-
[1]
write newline
" write newline "" before.all 'output.state := FUNCTION fin.entry add.period write newline FUNCTION new.block output.state before.all = 'skip after.block 'output.state := if FUNCTION new.sentence output.state after.block = 'skip output.state before.all = 'skip after.sentence 'output.state := if if FUNCTION not #0 #1 if FUNCTION and 'skip pop #0 if FUNCTIO...
-
[2]
Amihud, Y., and Mendelson, H. 1986. Asset pricing and the bid-ask spread. Journal of financial Economics 17(2):223--249
work page 1986
-
[3]
Angel, J. J., and McCabe, D. 2013. Fairness in financial markets: The case of high frequency trading. Journal of Business Ethics 112(4):585--595
work page 2013
-
[4]
Avramovic, A. 2017. We're all high frequency traders now. Credit Suisse Market Structure White Paper
work page 2017
-
[5]
Bachelier, L. 1900. Th \'e orie de la sp \'e culation . Gauthier-Villars
work page 1900
-
[6]
Chordia, T.; Roll, R.; and Subrahmanyam, A. 2008. Liquidity and market efficiency. Journal of Financial Economics 87(2):249--268
work page 2008
-
[7]
Fama, E. F. 1991. Efficient capital markets: Ii. The journal of finance 46(5):1575--1617
work page 1991
-
[8]
Foucault, T.; Kadan, O.; and Kandel, E. 2013. Liquidity cycles and make/take fees in electronic markets. The Journal of Finance 68(1):299--341
work page 2013
Show all 15 references
-
[9]
M.; and Menkveld, A
Hendershott, T.; Jones, C. M.; and Menkveld, A. J. 2011. Does algorithmic trading improve liquidity? The Journal of Finance 66(1):1--33
2011
-
[10]
Klaus, T., and Elzweig, B. 2017. The market impact of high-frequency trading systems and potential regulation. Law and Financial Markets Review 11(1):13--19
2017
-
[11]
G., and Fama, E
Malkiel, B. G., and Fama, E. F. 1970. Efficient capital markets: A review of theory and empirical work. The journal of Finance 25(2):383--417
1970
-
[12]
Menkveld, A. J. 2013. High frequency trading and the new market makers. Journal of Financial Markets 16(4):712--740
2013
-
[13]
New York Stock Exchange . 2018. New York Stock Exchange Trade and Quote (TAQ) Data . Obtained via Wharton Data Research Services at https://wrds-web.wharton.upenn.edu/wrds/
2018
-
[14]
United States Securities and Exchange Commission . 2010. Concept Release on Equity Market Structure, SEC Rel. No. 34-61358 . Accessed via https://www.sec.gov/rules/concept/2010/34-61358.pdf
2010
-
[15]
Wellman, M. P. 2006. Methods for empirical game-theoretic analysis. In AAAI , 1552--1556
2006
Reviewed August 14, 2026 · model on record in the stance chip above.
Discussion (0). Continue with ORCID to comment.