REVIEW 2 major objections 4 minor 13 references
A Reproducible Comparison of RSSI Fingerprinting Localization Methods Using LoRaWAN
T0 review · 2 major / 4 minor · reviewed 2026-08-14 · deepseek-v4-flash
Pith's one-line read A multilayer perceptron is the most accurate of three tested fingerprinting methods on a public LoRaWAN dataset, achieving a 358-meter mean localization error.
desk verdict Honest, reproducible benchmark on the Antwerp LoRaWAN dataset, but the headline MLP-vs-kNN win is confounded by giving only the MLP and Extra Trees the LoRa spreading factor as an extra input feature. read the letter →
The pith
A machine-rendered reading of the paper's core claim, the machinery that carries it, and where it could break.
The reading
What carries the argument
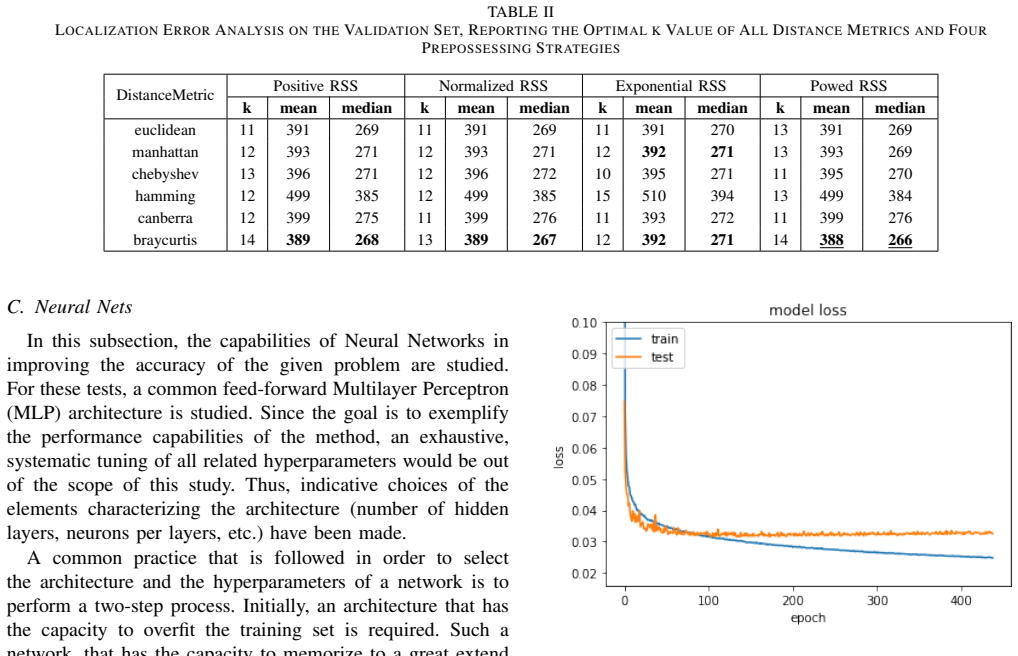
The central object is the public LoRaWAN RSSI fingerprint dataset collected in urban Antwerp, together with a fixed 70/15/15 random split into training, validation, and test sets. The argument is carried by the comparison protocol: each method gets its hyperparameters tuned on the validation set, and the test set provides a shared, reproducible accuracy estimate. For the MLP, the decisive components are a 7-layer architecture with 1024-1024-1024-256-128-128-2 neurons, dropout at rate 0.15, batch normalization, ReLU activations, the Adam optimizer, and early stopping, all chosen after first verifying that the architecture can overfit the training set.
What would settle it
Re-run the same three methods with their reported hyperparameters on 10 different random 70/15/15 splits of the Antwerp dataset and compute the distribution of test-set mean errors; if the MLP's mean error does not stay clearly below Extra Trees and kNN across most splits, the claimed ordering is not established.
Extended reading notes
Core claim
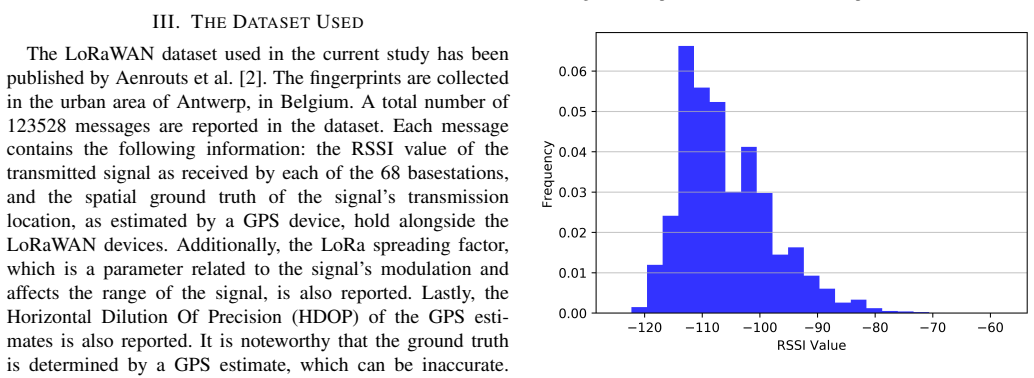
On the Antwerp LoRaWAN fingerprinting dataset, a 7-layer feed-forward neural network with dropout, batch normalization, early stopping, and the spreading factor as an extra input feature yields the lowest localization error among the three methods tested. The paper reports a mean error of 358 meters and a median error of 204 meters on the test set, compared with 380 and 261 meters for Extra Trees and 394 and 273 meters for kNN. The authors also observe that the four RSSI preprocessing schemes they evaluate (positive, normalized, exponential, and powed) produce nearly identical accuracy, which they attribute to the dataset's sparsity: most fingerprints contain RSSI values from only three gateways out of 68.
Load-bearing premise
The ranking of methods relies on a single random 70/15/15 split of the dataset, with no repeated splits, confidence intervals, or significance tests, so the observed differences in mean error could be sampling noise.
Editorial extensions
If this is right
- LoRaWAN RSSI fingerprinting can reach mean localization errors around 350 meters in a dense urban setting, which is useful for applications where GPS is too power-hungry.
- Neural networks appear to extract more location information from sparse RSSI fingerprints than kNN or tree ensembles, especially when non-RSSI features like the spreading factor are included.
- Preprocessing transformations of RSSI values matter less when most fingerprints are extremely sparse, because which gateways received a signal is the dominant signal.
- The released train/validation/test split and code allow future methods to be compared directly against the numbers reported here without re-implementing the pipeline.
- The gap between mean and median error indicates that outliers still dominate the mean, so localization accuracy is best described by the full error distribution rather than a single number.
Reading between the lines
- Because most fingerprints contain only three gateway readings, treating the set of receiving gateways as categorical features, rather than just RSSI magnitudes, could yield further gains; the paper's observation about preprocessing insensitivity hints at this but does not test it.
- The reported superiority of the MLP rests on a single split; a natural extension is to repeat the comparison across multiple random splits or geographic subregions to see whether the ranking is stable.
- The method's performance on the rural LoRaWAN dataset released by the same data authors remains untested, and rural sparsity patterns may change which method wins.
- The near-equivalence of preprocessing schemes on this dataset suggests that benchmark comparisons on LPWAN data should report gateway-coverage statistics, since those may matter more than RSSI scaling.
Signed reviews
Editorial analysis
A structured set of objections, weighed in public.
Referee Report
Summary. The paper compares three fingerprinting localization methods (k-nearest neighbours, Extra Trees, and a multilayer perceptron) on a public LoRaWAN RSSI dataset collected in Antwerp. The authors apply four RSSI preprocessing schemes, tune hyperparameters on a validation split, and report localization errors on a held-out test split. They find that the MLP achieves the lowest mean error (358 m) and median error (204 m) on the test set, and they release the code, data splits, and preprocessing details to support reproducibility.
Significance. Given the scarcity of public LPWAN fingerprinting benchmarks, a careful, reproducible comparison is potentially valuable. The authors correctly use a held-out test set and perform hyperparameter selection on validation, and the decision to publish the exact split is a concrete step toward comparability. The paper also demonstrates that on this particular sparse dataset, preprocessing choices have little effect, which is an interesting empirical observation. However, the headline claim that MLP is the most accurate method is currently supported only by point estimates from a single split and rests on a comparison in which kNN receives a strictly smaller feature set, so the significance is conditional on fixing these issues.
major comments (2)
- [Section V (Experimental Setup) and Table III] The comparison is confounded by an input-feature asymmetry. Section V states that kNN uses only the RSSI values from the 68 basestations as features, while Extra Trees and MLP also receive the LoRa spreading factor as an additional feature. The spreading factor is not a constant; it varies per message and is known to affect signal propagation, so it may contain location-relevant information. As a result, the reported test-set gap between MLP (358 m) and kNN (394 m) cannot be attributed solely to the choice of method. The claim that kNN 'cannot naturally process' a non-commensurable feature is not convincing, since kNN can be applied with normalized, standardized, or one-hot encoded features, or with a Gower-type distance. I recommend either giving the same features to all three methods or running an ablation that removes the spreading factor from Extra Trees and MLP; the current Table III does not isolate the algorithmic contribution.
- [Section III, Section VI, Table III] All conclusions are based on a single random 70/15/15 split of the dataset into training, validation, and test (Section III). Table III reports point estimates without confidence intervals, bootstrap results, or repeated runs. The test-set gap between MLP and Extra Trees is only 22 m in mean (358 vs. 380) and 57 m in median (204 vs. 261), which could easily be within sampling noise for a dataset with 18530 test points and inherent variability. The authors should repeat the split multiple times (or use bootstrap sampling) and report the distribution of test errors, or at least a paired or stratified test, before claiming that MLP is the most accurate method. In addition, the '10% improvement' over Aernouts et al. [2] is computed across different test splits and should be clearly flagged as an informal comparison rather than a head-to-head result.
minor comments (4)
- [Section IV, Equation (2)] Equation (2) appears to be missing a division operator between the numerator and denominator; please check the typesetting of the powed representation.
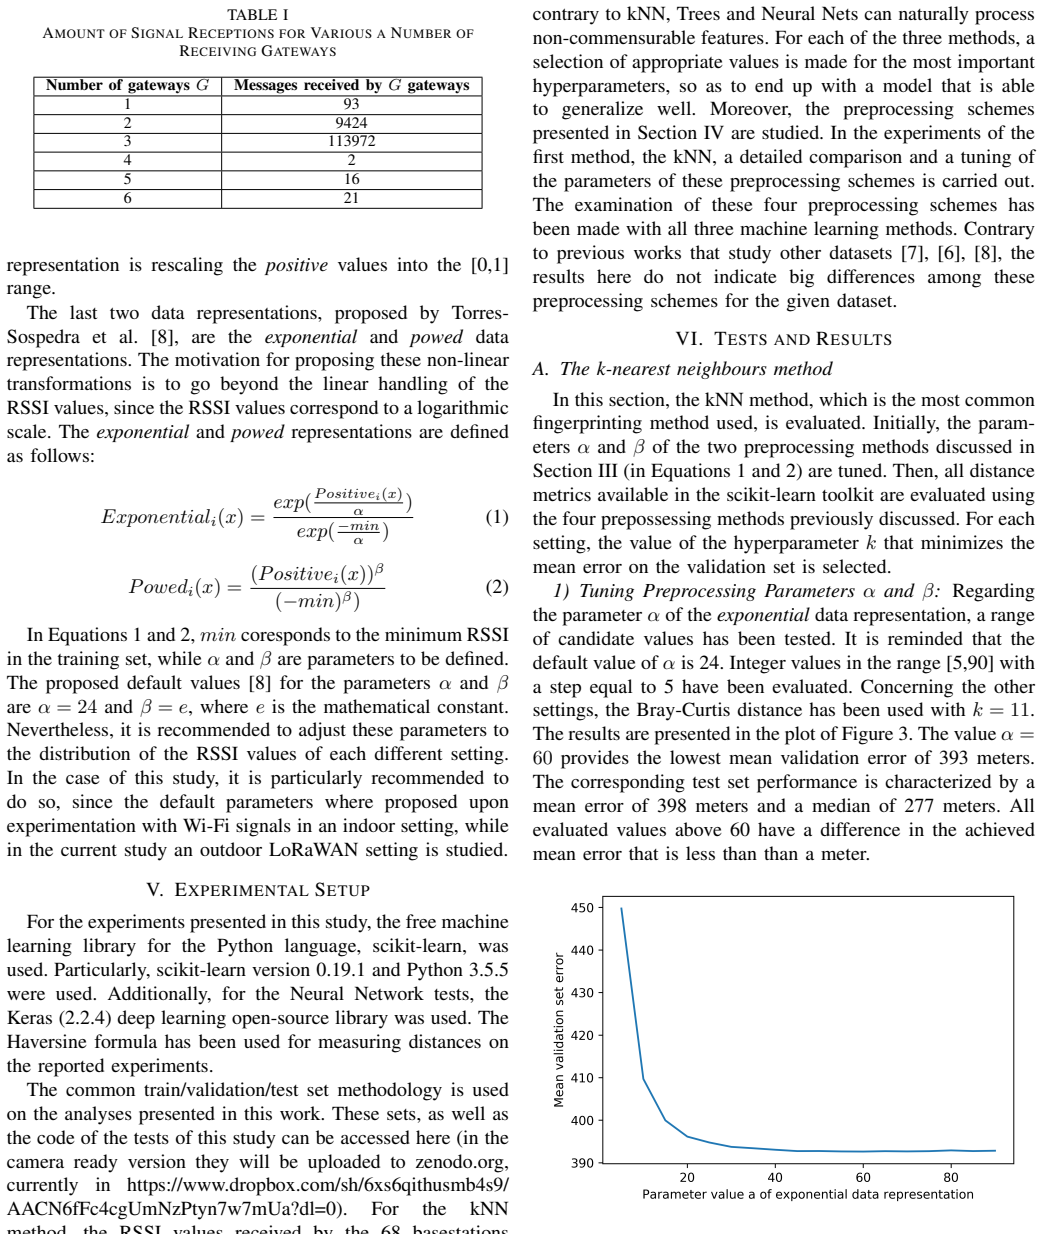
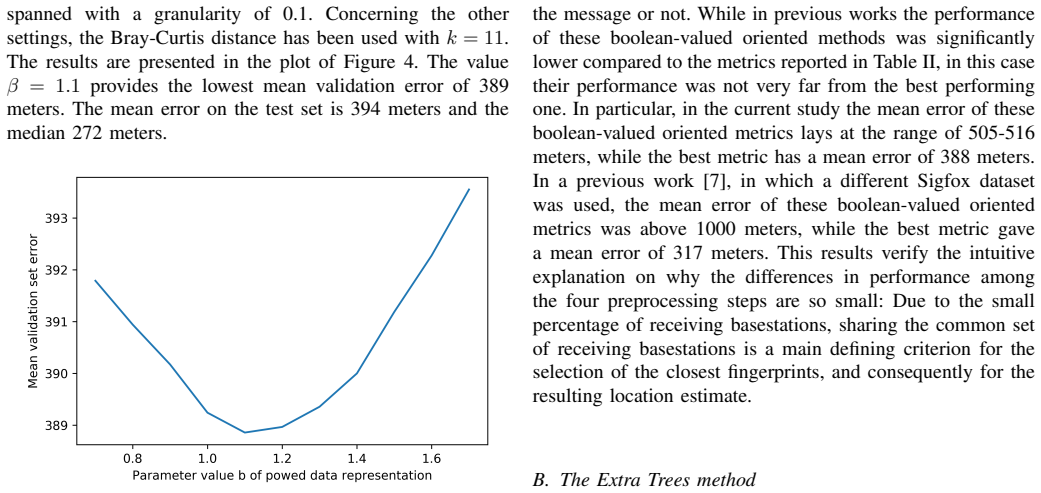
- [Section VI-A and Table III] The text reporting the α tuning gives a kNN test mean of 398 m and median of 277 m for α=60, and for β=1.1 a test mean of 394 m and median of 272 m; Table III reports kNN test mean 394 m and median 273 m. These numbers are not fully consistent and should be reconciled.
- [Sections V and VII] For a reproducibility-focused paper, the code and data should be available through a persistent archive (e.g., Zenodo) at the time of publication; the current text promises a camera-ready upload and gives a Dropbox link, which is not stable enough for the stated reproducibility goal.
- [Throughout] The manuscript contains several typographical issues, including 'Extra Tress' in the Introduction, 'prepossessing' for 'preprocessing', 'comonly' for 'commonly', and 'coresponds' for 'corresponds'; a careful proofreading pass is needed.
Circularity Check
No circular derivation; reported MLP error is measured on a held-out test set, with only non-load-bearing self-citations.
full rationale
The paper's central claim—that the MLP achieves a 358 m mean / 204 m median test error and outperforms kNN and Extra Trees—is an empirical measurement on a public dataset, not a derived quantity. Hyperparameters (k, alpha, beta, tree depths, dropout, early stopping) are tuned on the validation set, and the test set is held out (Section III: 'we have randomly split the dataset into a training, a validation and a test set containing 70%, 15%, and 15%'); Table III reports test-set errors that are not fitted constants. Self-citations to the authors' prior Sigfox study [7] appear only as methodological precedent (e.g., sharing train/validation/test splits, preprocessing schemes, Bray-Curtis metric corroboration) and are not load-bearing: the LoRaWAN results are computed independently on the Aernouts et al. dataset. The comparison to the 398 m kNN benchmark of [2] is expressly qualified as using a different test split, so the 10% improvement claim is not presented as a controlled prediction. The feature-asymmetry issue (LoRa spreading factor provided to Extra Trees and MLP but not kNN) is a potential experimental confound, but it does not make any result equivalent to its inputs by construction; the test errors remain out-of-sample measurements. Hence no circular step is present.
Assumptions & free parameters
free parameters (8)
- alpha (exponential preprocessing) =
60
- beta (powed preprocessing) =
1.1
- kNN k per distance metric =
e.g., 14 for Bray-Curtis on positive RSS; values in Table II
- Extra Trees min_samples_split, min_samples_leaf, max_depth =
14, 1, 40
- Extra Trees n_estimators =
100
- MLP architecture =
7 layers: 1024, 1024, 1024, 256, 128, 128, 2
- MLP dropout rate and L2 lambda =
dropout 0.15, lambda 0
- MLP early stopping patience, batch size, final epochs =
not reported
assumptions (5)
- domain assumption The Aernouts et al. LoRaWAN dataset is an accurate representation of real LoRaWAN RSSI fingerprints in Antwerp.
- domain assumption The GPS-derived ground truth is accurate enough at the scale of the claimed errors.
- domain assumption The random 70/15/15 split is a representative sample of the dataset.
- standard math The scikit-learn and Keras implementations of kNN, Extra Trees, and MLP are numerically correct for this task.
- domain assumption RSSI values transformed by the four preprocessing schemes preserve the information needed for localization.
Cite this review
Pith. "Pith review of A Reproducible Comparison of RSSI Fingerprinting Localization Methods Using LoRaWAN." pith.science (2026). https://pith.science/paper/26HN5AA6
@misc{pith2026190805085,
  author       = {Pith},
  title        = {Pith review of: A Reproducible Comparison of RSSI Fingerprinting Localization Methods Using LoRaWAN},
  year         = {2026},
  howpublished = {\url{https://pith.science/paper/26HN5AA6}},
  note         = {Machine review of arXiv:1908.05085}
}
read the original abstract
The use of fingerprinting localization techniques in outdoor IoT settings has started to gain popularity over the recent years. Communication signals of Low Power Wide Area Networks (LPWAN), such as LoRaWAN, are used to estimate the location of low power mobile devices. In this study, a publicly available dataset of LoRaWAN RSSI measurements is utilized to compare different machine learning methods and their accuracy in producing location estimates. The tested methods are: the k Nearest Neighbours method, the Extra Trees method and a neural network approach using a Multilayer Perceptron. To facilitate the reproducibility of tests and the comparability of results, the code and the train/validation/test split of the dataset used in this study have become available. The neural network approach was the method with the highest accuracy, achieving a mean error of 358 meters and a median error of 204 meters.
Figures

Figures from the paper (2 more)
Reference graph
Works this paper leans on
-
[8]
J. Torres-Sospedra, R. Montoliu, S. Trilles, scar Belmonte, and J. Huerta, “Comprehensive analysis of distance and similarity measures for wi-fi fingerprinting indoor positioning systems,” Expert Systems with Applications, vol. 42, no. 23, pp. 9263 – 9278, 2015. [Online]. Available: http://www.sciencedirect.com/science/article/pii/S0957417415005527
work page 2015
-
[2]
Sigfox and lorawan datasets for fingerprint localization in large urban and rural areas,
M. Aernouts, R. Berkvens, K. Van Vlaenderen, and M. Weyn, “Sigfox and lorawan datasets for fingerprint localization in large urban and rural areas,” Data, vol. 3, no. 2, 2018. [Online]. Available: http://www.mdpi.com/2306-5729/3/2/13
work page 2018
-
[1]
Indoor fingerprint positioning based on wi-fi: An overview,
S. Xia, Y . Liu, G. Yuan, M. Zhu, and Z. Wang, “Indoor fingerprint positioning based on wi-fi: An overview,” ISPRS International Journal of Geo-Information , vol. 6, no. 5, 2017. [Online]. Available: http://www.mdpi.com/2220-9964/6/5/135
work page 2017
-
[3]
Experimen- tal performance evaluation of outdoor tdoa and rss positioning in a public lora network,
D. Plets, N. Podevijn, J. Trogh, L. Martens, and W. Joseph, “Experimen- tal performance evaluation of outdoor tdoa and rss positioning in a public lora network,” in 2018 International Conference on Indoor Positioning and Indoor Navigation (IPIN) , Sep. 2018, pp. 1–8
work page 2018
-
[4]
Low-power lora signal-based outdoor positioning using fingerprint algorithm,
W. Choi, Y .-S. Chang, Y . Jung, and J. Song, “Low-power lora signal-based outdoor positioning using fingerprint algorithm,” ISPRS International Journal of Geo-Information , vol. 7, no. 11, 2018. [Online]. Available: http://www.mdpi.com/2220-9964/7/11/440
work page 2018
-
[5]
Low-cost car park localization using rssi in supervised lora mesh networks,
P. Gotthard and T. Jankech, “Low-cost car park localization using rssi in supervised lora mesh networks,” in 2018 15th Workshop on Positioning, Navigation and Communications (WPNC) , Oct 2018, pp. 1–6
work page 2018
-
[6]
Outdoor finger- printing localization using sigfox,
T. Janssen, M. Aernouts, R. Berkvens, and M. Weyn, “Outdoor finger- printing localization using sigfox,” in 2018 International Conference on Indoor Positioning and Indoor Navigation (IPIN) , Sep. 2018, pp. 1–6
work page 2018
-
[7]
A. K. Grigorios G. Anagnostopoulos, “A reproducible analysis of rssi fingerprinting for outdoor localization using sigfox: Preprocessing and hyperparameter tuning,” in 2019 International Conference on Indoor Positioning and Indoor Navigation (IPIN) , Oct 2019
work page 2019
Show all 13 references
-
[9]
Extremely randomized trees,
P. Geurts, D. Ernst, and L. Wehenkel, “Extremely randomized trees,” Mach. Learn. , vol. 63, no. 1, pp. 3–42, Apr. 2006. [Online]. Available: http://dx.doi.org/10.1007/s10994-006-6226-1
2006 doi
-
[10]
Dropout: A simple way to prevent neural networks from overfitting,
N. Srivastava, G. Hinton, A. Krizhevsky, I. Sutskever, and R. Salakhutdinov, “Dropout: A simple way to prevent neural networks from overfitting,” Journal of Machine Learning Research, vol. 15, pp. 1929–1958, 2014. [Online]. Available: http://jmlr.org/papers/v15/srivastava14a.html
1929
-
[11]
Batch normalization: Accelerating deep network training by reducing internal covariate shift,
S. Ioffe and C. Szegedy, “Batch normalization: Accelerating deep network training by reducing internal covariate shift,” in Proceedings of the 32Nd International Conference on International Conference on Machine Learning - V olume 37 , ser. ICML’15. JMLR.org, 2015, pp. 448–456...
2015
-
[12]
Deep learning using rectified linear units (relu),
A. F. Agarap, “Deep learning using rectified linear units (relu),” CoRR, vol. abs/1803.08375, 2018. [Online]. Available: http://arxiv.org/abs/ 1803.08375
2018 arXiv
-
[13]
Adam: A method for stochastic optimization,
D. P. Kingma and J. Ba, “Adam: A method for stochastic optimization,” in 3rd International Conference on Learning Representations, ICLR 2015, San Diego, CA, USA, May 7-9, 2015, Conference Track Proceedings, 2015. [Online]. Available: http://arxiv.org/abs/1412.6980
2015 arXiv
Reviewed August 14, 2026 · model on record in the stance chip above.
Discussion (0). Continue with ORCID to comment.