REVIEW 2 major objections 5 minor 18 references
L-BASS: A project to produce an absolutely calibrated 1.4 GHz sky map. II -- Technical Description of the System
T0 review · 2 major / 5 minor · reviewed 2026-08-07 · deepseek-v4-flash
Pith's one-line read This paper reports laboratory verification that L-BASS's 1.4 GHz hardware meets the requirements for absolute sky-temperature measurements accurate to better than 0.1 K.
desk verdict Solid, honest instrument paper, but the load-bearing claim about APC-7 connector repeatability is not actually demonstrated—'close to desired' is not a number. read the letter →
The pith
A machine-rendered reading of the paper's core claim, the machinery that carries it, and where it could break.
The reading
What carries the argument
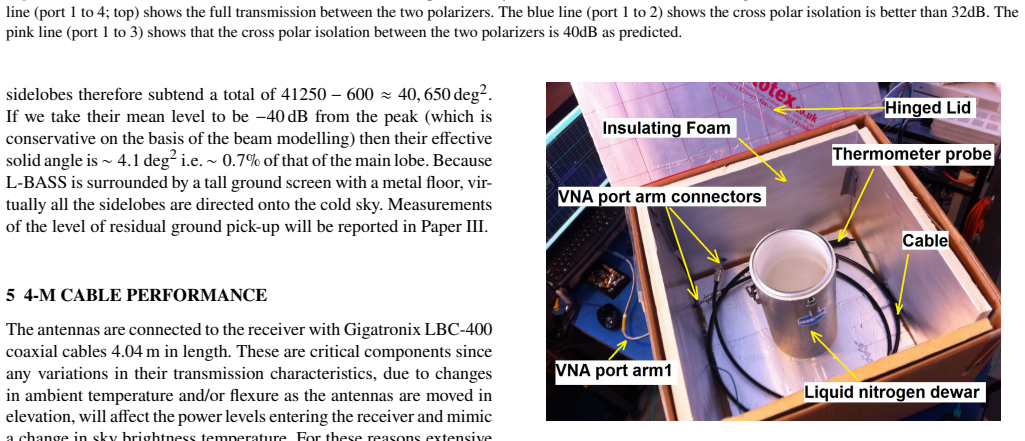
The load-bearing mechanism is a continuous-comparison direct-conversion radiometer, the architecture used by the WMAP and Planck-LFI space missions: two magic-tee hybrids split and recombine the signals from the two antennas, with low-noise amplifier chains between them, a phase switch driven at 10 Hz, and a double-differencing scheme that removes back-end gain fluctuations. Around this core is a web of supporting measurements: a passive-materials model that converts readings from 38 temperature sensors along the horns, polarizers, and cables into corrections for ohmic loss and thermal emission, and a CW gain-monitoring system that injects a known continuous-wave signal into each horn through the polarizer's spare port. The key numeric claims are that cable flexure perturbs loss by under 0.001 dB and that the receiver's cross-chain isolation exceeds 30 dB, both demonstrated in the laboratory.
What would settle it
A dedicated test that carries a calibrated hot source across the sky at large off-axis angles while the antenna tracks the North Celestial Pole, or that tilts the ground screen and measures the change in system temperature, would show whether stray radiation is actually below the 0.1 K budget; if any backlobe reaches -30 dB relative to peak, the assumption fails.
Extended reading notes
Core claim
The paper's central claim, on its own terms, is that the L-BASS hardware, assembled and tested, satisfies the requirements needed to pursue radiometric measurements of the sky with an absolute accuracy better than 0.1 K at 1.4 GHz. The evidence is a set of component and sub-system measurements: the 4.04 m cables show no more than 0.001 dB of loss change under flexure; the receiver achieves better than 30 dB isolation between its two chains with gains matched to 0.06 dB; the polarizers show better than 32 dB cross-polar isolation; and the temperature coefficients of cables, amplifiers, and power meters are small enough to be modeled and corrected. The paper does not yet claim the 0.1 K result has been achieved on the sky; that final demonstration is deferred to Paper III, which will describe the end-to-end calibration.
Load-bearing premise
The weakest load-bearing premise is that the electromagnetic model of the horn's far-out sidelobes, with a mean level of about -40 dB, is accurate enough, and that the ground screen directs virtually all of those sidelobes onto cold sky, so stray-radiation pickup adds less than 0.1 K of error.
Editorial extensions
If this is right
- L-BASS can produce a 1.4 GHz absolute sky map whose zero level is tied to the North Celestial Pole at the 0.1 K level, a quantity that current dish-based surveys lack.
- The absolute brightness temperature of the North Celestial Pole will be fixed by a cryogenic-load measurement, providing the zero-point for absolute calibration of all other 1.4 GHz surveys.
- The ARCADE-2 isotropic steep-spectrum radio background can be checked with an independent instrument that does not rely on the same assumed zero levels.
- The passive thermal modeling and CW-gain monitoring techniques can be transferred to other single-dish telescopes that want absolute temperature calibration without building a second antenna.
- The measured cable flexure and connector repeatability numbers set a practical floor for ground-based absolute radiometry at L-band, independent of receiver noise.
Reading between the lines
- If the true far-out sidelobe level were -30 dB rather than the modeled -40 dB, the effective sidelobe solid angle would rise by a factor of 10, likely driving stray-radiation pickup errors well past the 0.1 K goal; a direct far-sidelobe measurement would settle this.
- The disconnect/reconnect uncertainty at the polarizer-cable interface suggests that the final absolute accuracy may be limited more by connector repeatability than by any other single term in the error budget; a remotely switchable cryogenic load would eliminate that term entirely.
- The CW gain-injection scheme, which leaks a known signal through the polarizer's spare port, could double as an in-situ monitor of polarizer port-to-port coupling stability, since any drift in that coupling would show up as a drift in the injected CW amplitude.
Editorial analysis
A structured set of objections, weighed in public.
Referee Report
Summary. The paper describes the technical design and laboratory characterization of the L-BASS instrument, a dual-horn 1.4 GHz radiometer intended to produce an absolutely calibrated sky map with better than 0.1 K accuracy. It covers the horn and septum polarizer design, antenna-level insertion/return loss and beam measurements, the 4.04-m cable system (including loss, temperature susceptibility, flexure, and disconnect/reconnect reproducibility), the continuous-comparison receiver, the digital spectrometer, and the temperature/gain monitoring systems. The reported component-level measurements include cable flexure changes below 0.001 dB, receiver chain isolation exceeding 30 dB, and a receiver gain match of 0.06 dB. The paper positions these results as establishing that the hardware meets the requirements needed to pursue the 0.1 K goal, while deferring full-system calibration, residual ground pickup, and absolute temperature-scale establishment to future papers.
Significance. If the 0.1 K absolute accuracy is achieved, L-BASS would provide a much-needed absolute zero-level for 1.4 GHz all-sky maps and an independent test of the ARCADE-2 isotropic radio background. This paper is a valuable technical reference: it reports careful component-level measurements with explicit error bars, using calibrated VNAs and power meters, and it is unusually candid about limitations, such as the discrepancy between the field-measured main beam and EM predictions, the inability to probe sidelobes below -40 dB, and the deferral of ground-pickup measurements to a later paper. The strengths are the detailed cable flexure and temperature-susceptibility measurements, the receiver isolation measurement with a clear experimental methodology, and the explicit linking of component tolerances to the radiometric error budget. The principal weakness is that two load-bearing elements of the accuracy argument—the disconnect/reconnect reproducibility of the APC-7 connectors and the far-out sidelobe level—are not quantitatively established in this paper.
major comments (2)
- [Section 5.3] The disconnect/reconnect reproducibility of the APC-7 connector is the single most important factor limiting the absolute accuracy, as the paper itself states, yet no quantitative result is reported. The text says only that 'the insertion loss values are repeatably close to the desired 0.001dB level,' with no number of test cycles, no mean or standard deviation, and no worst-case deviation. Since the paper has already shown that a 0.001 dB ohmic loss change at the ~290 K polarizer port contributes ~0.067 K—two-thirds of the 0.1 K budget—and that standard type-N connectors fail with a ~0.003 dB spread, the absence of a measured spread for the APC-7 connectors means the paper does not demonstrate that the hardware meets the core accuracy requirement. Please provide the full statistics of the disconnect/reconnect tests (N, mean, standard deviation, maximum deviation) and propagate the measured spread through the error budget.
- [Section 4 (Figure 5 and sidelobe solid-angle calculation)] The stray-radiation error budget relies on the assumption that the far-out sidelobes have a mean level of -40 dB, but the field feed test could not measure below -40 dB because of ground scattering, and the different EM software packages predict different back-lobe strengths. The paper calculates an effective sidelobe solid angle of ~4.1 deg^2 (0.7% of the main beam) from the modeled level and asserts that the ground screen directs these sidelobes to cold sky, but residual ground pickup is deferred to Paper III. The observed discrepancy between the field-measured main beam and both the EM prediction and the solar-transit measurement also raises the question of whether the EM model reliably predicts the far-out pattern. To make the component-level claim that the antenna subsystem meets the 0.1 K goal, the paper should either provide a sensitivity analysis showing how much the sidelobe level and the residual ground pickup would need to change to violate the error budget, or explicitly state that the antenna sidelobe verification is incomplete and that the error-budget impact will be quantified in Paper III.
minor comments (5)
- [Abstract and Section 1] There is a typo in the abstract: 'North Celesial Pole' should be 'North Celestial Pole.'
- [Section 6.1(iv)] In the linearity test description, the injected CW signal is said to be at '1413.5GHz'; this should be 1413.5 MHz. Also, the signal generator is referred to as both 'Agilent 83565L' in the text and 'Anritsu 83650L' in the caption of Figure 16; please unify the notation.
- [Section 5.3] The sentence describing the APC-7 connector states that it is designed to maintain a reflection coefficient of 0.001 dB repeatably; reflection coefficient is not conventionally expressed in dB. Please rephrase in terms of return loss or VSWR, or clarify the intended quantity.
- [Section 4] The sentence 'In practice the sidelobe pattern is affected by mounting the antennas on the L-BASS structure. However the ground screen ensures that the sidelobes end up pointing at the cold sky' is an assertion without supporting measurement or simulation. Even if the ground screen redirects the main sidelobe direction, scattering and diffraction from the screen itself could contribute to stray pickup; a brief discussion of this limitation would improve the paper.
- [Section 6.2.2] The gain-ratio values quoted (0.975 for the East horn and 0.943 for the West horn) are presented without a clear definition of the ratio being computed; please specify which outputs and phase-switch states are being compared so that a reader can reproduce the statement.
Circularity Check
No significant circularity: the component and sub-system results are laboratory measurements benchmarked against external VNA and power-meter standards, and the self-citations are background or data-availability references, not load-bearing derivations.
full rationale
The paper's central claims are laboratory characterizations of the L-BASS hardware: horn/polarizer insertion loss, cable flexure and temperature susceptibility, receiver isolation, chain linearity, and spectrometer linearity. These are presented as measurements made with external instruments (Keysight VNAs, Anritsu power meters, spectrum analyzers) and compared with manufacturer specifications and EM simulations. There is no step in which a 'prediction' is derived from a quantity that was itself fitted from the same data. The horn FWHM comparison (Section 4) is a design-target check, not a circular derivation, because the simulation was used to design the horn and the solar-transit measurement independently confirms the realized beam; even if the agreement were imperfect, that would be a validation issue, not circularity. The sidelobe effective-solid-angle calculation assumes a mean far-out sidelobe level of -40 dB based on the beam model; the paper explicitly notes that field tests could not probe below -40 dB and that different EM software predicts different back-lobe strengths. This is an acknowledged modeling assumption and an evidentiary limitation, not a circular reduction, and the paper defers residual ground-pickup measurements to Paper III. The APC-7 connector statement in Section 5.3 reports that insertion-loss values are 'repeatably close to the desired 0.001dB level' without quoting a measured spread; the authors themselves call disconnect/reconnect reproducibility 'the single most important factor limiting the accuracy.' This is a missing quantitative demonstration, but it is not circular: the requirement (0.001 dB) is stated independently of the measurement, and the measurement is not claimed to be the requirement. Self-citations to Paper I, Zerafa (2022), and Black (2024) are used for design background, detailed test reports, and data processing; none of these citations is invoked to prove the component-level results, which stand on the external lab measurements. The paper does not claim the 0.1 K absolute-accuracy goal has been met; it claims the components meet requirements needed to pursue that goal, and the explicit limitations are consistent with that narrower claim. Overall, no load-bearing argument reduces to its own inputs, and no fitted parameter is renamed as a prediction.
Assumptions & free parameters
free parameters (1)
- Receiver chain cable path difference =
-74 mm
assumptions (3)
- domain assumption The EM-simulated far-out sidelobe pattern of the horns is accurate at the -40 dB level used for contamination estimates.
- domain assumption The ground screen directs virtually all sidelobes onto the cold sky, making ground pickup negligible.
- domain assumption Standard laboratory RF metrology (VNA calibrations, power meters, temperature sensors) provides accurate absolute references for the component measurements.
Cite this review
Pith. "Pith review of L-BASS: A project to produce an absolutely calibrated 1.4 GHz sky map. II -- Technical Description of the System." pith.science (2026). https://pith.science/paper/27MRL2TU
@misc{pith2026250603900,
  author       = {Pith},
  title        = {Pith review of: L-BASS: A project to produce an absolutely calibrated 1.4 GHz sky map. II -- Technical Description of the System},
  year         = {2026},
  howpublished = {\url{https://pith.science/paper/27MRL2TU}},
  note         = {Machine review of arXiv:2506.03900}
}
read the original abstract
L-BASS is an instrument designed to make radiometric temperature measurements of the sky with an absolute accuracy of better than 0.1 K at 1.4 GHz. This will be achieved in two steps: first by measuring the sky temperature relative to that of the North Celestial Pole, using two horn-based antennas, and second with the sky antenna replaced with a calibrated cryogenic load to measure the absolute brightness temperature of the North Celesial Pole. Here we describe the design of the L-BASS two-antenna system and report on laboratory measurements to establish its performance at component and sub-system level.
Figures


Figures from the paper (13 more)




Reference graph
Works this paper leans on
-
[1]
Behe R., Brachat P., 1991, @doi [IEEE Transactions on Antennas and Propagation] 10.1109/8.97358 , 39, 1222
-
[2]
Bennett C. L., et al., 2013, @doi [ ] 10.1088/0067-0049/208/2/20 , https://ui.adsabs.harvard.edu/abs/2013ApJS..208...20B 208, 20
-
[3]
Bersanelli M., et al., 2010, @doi [ ] 10.1051/0004-6361/200912853 , https://ui.adsabs.harvard.edu/abs/2010A&A...520A...4B 520, A4
-
[4]
Black P. J., 2024, Master's thesis, University of Manchester, Jodrell Bank Centre for Astrophysics, United Kingdom, https://research.manchester.ac.uk/en/studentTheses/commissioning-and-data-handling-for-the-l-bass-instrument
work page 2024
-
[5]
R., Staveley-Smith L., Barnes D
Calabretta M. R., Staveley-Smith L., Barnes D. G., 2014, @doi [ ] 10.1017/pasa.2013.36 , https://ui.adsabs.harvard.edu/abs/2014PASA...31....7C 31, e007
-
[6]
Dassault Systemes 2017, CST Studio Suite, https://www.3ds.com/products/simulia/cst-studio-suite
work page 2017
-
[7]
Fixsen D. J., et al., 2011, @doi [ ] 10.1088/0004-637X/734/1/5 , http://adsabs.harvard.edu/abs/2011ApJ...734....5F 734, 5
-
[8]
Jarosik N., et al., 2003, @doi [ ] 10.1086/346080 , 145, 413
doi:10.1086/346080 2003
Show all 18 references
-
[9]
Leech J., et al., 2011, @doi [ ] 10.1051/0004-6361/201117124 , https://ui.adsabs.harvard.edu/abs/2011A&A...532A..61L 532, A61
2011 doi
-
[10]
Mician GmbH 2015, Microwave Wizard V.8, https://www.mician.com
2015
-
[11]
W., Holler C
Pollak A. W., Holler C. M., Jones M. E., Taylor A. C., 2019, @doi [ ] 10.1093/mnras/stz2169 , 489, 548
2019 doi
-
[12]
Radiometer Physics GmbH 2013, LABVIEW, https://www.radiometer-physics.de
2013
-
[13]
C., 2004, in Uyaniker B., Reich W., Wielebinski R., eds, The Magnetized Interstellar Medium
Reich P., Reich W., Testori J. C., 2004, in Uyaniker B., Reich W., Wielebinski R., eds, The Magnetized Interstellar Medium. pp 63--68
2004
-
[14]
Seiffert M., Mennella A., Burigana C., Mandolesi N., Bersanelli M., Meinhold P., Lubin P., 2002, @doi [ ] 10.1051/0004-6361:20020880 , https://ui.adsabs.harvard.edu/abs/2002A&A...391.1185S 391, 1185
2002 doi
-
[15]
Seiffert M., et al., 2011, @doi [ ] 10.1088/0004-637X/734/1/6 , http://adsabs.harvard.edu/abs/2011ApJ...734....6S 734, 6
2011 doi
-
[16]
Wolleben M., et al., 2021, @doi [ ] 10.3847/1538-3881/abf7c1 , https://ui.adsabs.harvard.edu/abs/2021AJ....162...35W 162, 35
2021 doi
-
[17]
Zerafa D., 2022, PhD thesis, University of Manchester, Jodrell Bank Centre for Astrophysics, United Kingdom, https://research.manchester.ac.uk/en/studentTheses/evaluating-the-temperature-of-the-sky-the-l-band-all-sky-survey
2022
-
[18]
N., Radcliffe C
Zerafa D., Wilkinson P. N., Radcliffe C. J., Leahy J. P., Browne I. W. A., Black P. J., 2025, @doi [RASTI] https://doi.org/10.1093/rasti/rzaf017 , accepted
2025 doi
Reviewed August 7, 2026 · model on record in the stance chip above.
Discussion (0). Sign in to comment.