REVIEW 3 major objections 5 minor 40 references
Stain-aware Domain Alignment for Imbalance Blood Cell Classification
T0 review · 3 major / 5 minor · reviewed 2026-08-11 · deepseek-v4-flash
Pith's one-line read This paper claims that a two-stage, stain-aware training procedure can make blood-cell classifiers robust to both domain shift and class imbalance.
desk verdict Useful practical method for imbalanced blood cell classification, but the reported edge over baselines is likely inflated because hyperparameters were tuned on the held-out test domains. read the letter →
The pith
A machine-rendered reading of the paper's core claim, the machinery that carries it, and where it could break.
The reading
What carries the argument
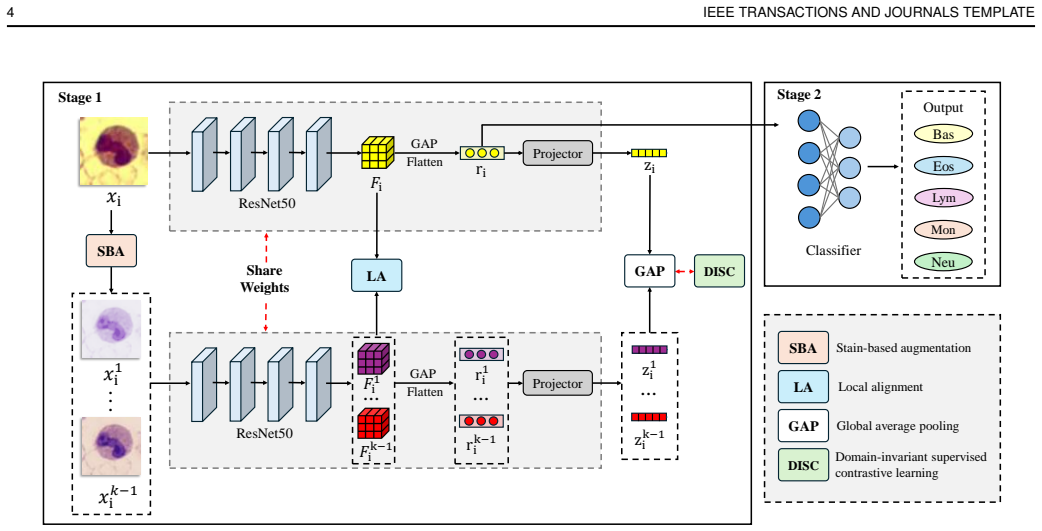
The load-bearing object is the Beer-Lambert optical-density factorization $V = W H$, obtained via sparse non-negative matrix factorization, which splits a blood-cell image into a stain color matrix $W$ and a density map $H$ that is assumed to carry the cell structure. The method clusters the $W$ matrices in each mini-batch, then re-stains a sample's density map with the $W$ from other clusters to create synthetic domain variants while leaving morphology intact. A pixel-wise local alignment loss and a contrastive loss whose anchors are averages of original and re-stained embeddings then drive the feature extractor to ignore the differences between these views.
What would settle it
Take a single blood-cell image, decompose it via the paper's SNMF procedure, re-stain its density map with stain matrices from the other k-means clusters, and compare a cell-morphology measurement such as nucleus segmentation overlap or cell boundary IoU between the original and re-stained versions; if morphology shifts systematically with the chosen stain matrix, the separation premise fails.
Extended reading notes
Core claim
SADA's central claim is that domain-invariant features can be learned by exploiting the Beer-Lambert structure of stained microscopy images. The method first factorizes each image's optical density into a stain color matrix and a structure density map using sparse non-negative matrix factorization, clusters the stain colors in each mini-batch, and then generates synthetic domain-transformed samples by re-staining the original structure with stain colors from other clusters. A pixel-wise local alignment loss forces the backbone's feature maps to agree between original and re-stained views, and a domain-invariant supervised contrastive loss builds anchors by averaging the embeddings of all views of the same cell, diluting domain-specific content. The paper reports that this training, followed by a second stage of classifier training on frozen features, yields the highest F1-micro and F1-macro scores on each of the four public datasets under leave-one-out evaluation, and also on a held-out private clinical dataset, with the largest gains over prior methods on the datasets where stain variation is most visible.
Load-bearing premise
The whole method relies on the Beer-Lambert sparse factorization cleanly separating stain color from cell structure, so that recoloring the density map with another cluster's stain colors preserves the morphology that defines the cell type.
Editorial extensions
If this is right
- A classifier trained on multi-source blood-cell images can generalize to a new hospital's staining protocol, making automated hematology models potentially deployable without per-site retraining.
- Minority classes receive more effective training exposure because each image generates multiple stain variants, which the paper argues helps with rare cell types without harming majority-class accuracy.
- The gains are achieved without changing the inference-time architecture or adding extra experts, so the improvement does not come with added deployment cost.
- The ablation results show that replacing the averaged-anchor contrastive loss with standard supervised contrastive learning drops F1-macro by 6.4 points, indicating that the domain-invariant anchor construction is a genuine contributor.
- The two-stage decoupling of feature learning from classifier training means the method can be bolted onto existing backbones and classification heads.
Reading between the lines
- The same re-staining operation could be applied at test time to normalize an incoming image into a canonical stain profile before classification, a post-deployment robustness measure the paper does not explore.
- A factorial ablation separating the diversity benefit of the augmentation from the alignment benefit of the losses would clarify whether the 4.4-point gain comes from seeing more stain variants or from the feature-level constraints.
- The averaged-anchor contrastive idea may transfer to other microscopy domains where appearance factors such as fixation, magnification, or fluorophore can be separated from the structure being classified.
- The paper's evaluation does not isolate whether the SNMF decomposition truly preserves morphology, so a direct measurement of morphological consistency under re-staining would be a natural follow-up test.
Signed reviews
Editorial analysis
A structured set of objections, weighed in public.
Referee Report
Summary. The paper proposes SADA, a two-stage method for blood cell classification under domain shift and class imbalance. In Stage 1, the method performs stain-based augmentation by decomposing images into stain color matrices and density maps via Beer-Lambert and sparse non-negative matrix factorization, clustering the color bases, and re-staining density maps with color bases from other clusters. A pixel-wise local alignment loss and a domain-invariant supervised contrastive loss are then applied to the raw and augmented samples. In Stage 2, a classifier is trained with standard cross-entropy. The method is evaluated with a leave-one-out protocol on four public blood cell datasets and on a private hospital dataset, reporting F1-micro and F1-macro. The central claim is state-of-the-art performance, with average F1-micro of 84.4% and F1-macro of 68.6% on the public datasets, exceeding the second-best method BoDA by 4.4% and 3.9%, respectively.
Significance. If the reported results are valid, SADA would be a useful practical contribution to hematological image analysis, where both domain shift and data imbalance are common. The paper has several strengths: it uses a standard and challenging cross-dataset evaluation protocol, reports results over three trials, includes an ablation study, and provides a source code URL. The proposed components are simple and additive, which makes the method easy to reproduce. However, the validity of the headline claim depends on two load-bearing issues: hyperparameter selection appears to use the same held-out target domains as the final evaluation, and the stain decomposition assumption underlying the augmentation is not independently validated. These issues, if left unaddressed, make the reported margins over the baselines difficult to interpret as honest generalization performance.
major comments (3)
- [Section IV-D, Table I] Hyperparameter selection in Section IV-D is performed using the same leave-one-out protocol that produces the final results in Table I. The text states that k and beta were tuned by measuring F1-micro and F1-macro 'under the framework outlined in Section IV-A,' and Section IV-A is the leave-one-out evaluation protocol. Therefore the values k=3 and beta=0.1 were selected using the held-out target domains, and the reported averages of 84.4% F1-micro and 68.6% F1-macro are the result of target-aware selection rather than independent prediction. This selection bias directly affects the central state-of-the-art claim. The paper should either use a nested or source-validation protocol for hyperparameter selection, or report results for a fixed, pre-specified configuration, and should clarify whether the baseline methods in Tables I and II were given equivalent target-aware tuning.
- [Section III-A, Eqs. (1)-(3)] The stain-based augmentation method assumes that the SNMF decomposition in Eq. (1) separates stain appearance W from cell structure H, so that recoloring H with W from another k-means cluster preserves morphology while simulating domain shift. This assumption is load-bearing because the local alignment loss and the domain-invariant supervised contrastive loss both train on the reconstructed samples. The paper provides no independent validation that the decomposition preserves labels or morphological structure. Since the ablation study in Table III does not include a variant without the stain-based augmentation module, the contribution of this assumption is not isolated. A concrete validation would be to have the generated samples checked by a human expert, or to measure classification-consistent morphology before and after re-staining, or to run an ablation that removes SBA while keeping the other losses.
- [Section III-D, Eq. (8), Table I] The paper repeatedly states that decoupling training into two stages alleviates data imbalance, but Stage 2 trains the classifier with plain cross-entropy, Eq. (8), and no class-balanced sampling, re-weighting, or other imbalance-aware mechanism is described. The only imbalance-aware components are the supervised contrastive loss, which considers all positives regardless of class frequency, and the macro-F1 metric. The reported improvement in macro-F1 is therefore not attributable to the two-stage schedule unless an ablation or analysis isolates it. The authors should either add a class-balanced classifier stage or provide a dedicated experiment showing that the two-stage procedure, beyond the proposed losses, is responsible for the macro-F1 gains.
minor comments (5)
- [Section III-A] In the sentence introducing density maps and stain color matrices, the text says 'density maps Hs (i.e. stain color) and stain color matrices Ws (i.e. structure)', which reverses the definitions given in the same section and in Eq. (1). Density maps should be associated with structure and stain color matrices with appearance.
- [Section III-C, Eq. (6)] The summation index k in the denominator of Eq. (6) conflicts with the hyperparameter k used for the number of stain-color clusters in Section III-A. A different index, such as m or j, should be used for the summation.
- [Section I, contribution list] Contribution 2 says the local alignment constraint makes 'the target sample and generated samples' consistent, but no target-domain samples are used during training. The intended meaning appears to be 'raw sample and generated samples,' and the wording should be corrected.
- [Section IV-D, Fig. 7] Figure 7 reports only the hyperparameter tuning results averaged over the four public datasets, without per-dataset curves or error bars. It would be clearer to state how the optimal k and beta were selected from the plotted curves and whether the same values were used without further tuning for the SYSU3H external test in Table II.
- [Section II-A] The sentence 'Regarding Loss re-weighting addresses data imbalance by adjusting the loss contribution of each class' is grammatically incomplete; it should be rewritten, for example as 'Regarding loss re-weighting, it addresses data imbalance by adjusting the loss contribution of each class.'
Circularity Check
No derivation-level circularity; the headline improvements are partly selected by tuning k and β on the leave-one-out target folds.
-
fitted input called prediction
[Section IV-D 'Hyperparameter Tuning' with Section IV-A 'Experimental Settings' and Table I]
"This investigation is carried out under a rigorous framework outlined in Section IV-A. The results of hyperparameter tuning averaged across four public datasets, are presented in Fig. 7. We identify k = 3 and β = 0.1 as the optimal parameters, achieving an impressive F1-micro score of 84.45% and a competitive F1-macro score of 68.65%. ... For all datasets, we adopt the leave-one-out strategy for evaluation, where one dataset serves as the hold-out target domain, and the remaining datasets act as source domains."
The hyperparameters k and beta are tuned by measuring F1-micro/F1-macro under the leave-one-out protocol of Section IV-A, whose held-out target datasets are exactly the datasets used to produce the headline results in Table I. Thus the reported average F1-micro of 84.4% and F1-macro of 68.6% are not independent predictions for a fixed method; they are the best values selected by maximizing the evaluation metrics on the target domains. The performance claim is therefore partly forced by the selection criterion, i.e., target-aware hyperparameter fitting is presented as state-of-the-art performance. This is a statistical-selection circularity rather than an equation-level equivalence; the losses in Eq. (7) are heuristic and do not contain target labels by construction.
full rationale
The method's core components are heuristic and externally grounded: the Beer-Lambert SNMF decomposition is attributed to Vahadane et al. [33], the local alignment loss (Eqs. 4-5) and domain-invariant supervised contrastive loss (Eq. 6) are new training objectives, and no equation in the paper is defined in terms of the reported F1 values. There is no self-citation chain, no imported uniqueness theorem, and no ansatz smuggled in from the authors' prior work. The only load-bearing step connecting the inputs to the reported results is Section IV-D, where k and beta are selected using the same leave-one-out target folds later reported in Table I. This makes the headline margins optimistically biased and is a legitimate evaluation-leakage concern, but it does not make the proposed derivation equivalent to its inputs. The unvalidated assumption that W captures stain and H captures structure is a modeling risk rather than a circular step. Overall, the central method has independent content, so the circularity score is moderate rather than high.
Assumptions & free parameters
free parameters (3)
- k (number of stain-color clusters) =
3
- beta (local alignment loss weight) =
0.1
- tau (contrastive temperature)
assumptions (4)
- standard math Beer-Lambert law V = -log(X/X0) = WH, with W as stain color and H as structure, is separable by SNMF.
- domain assumption Blood cell morphology (density maps H) is domain-invariant, and stain color variation is the dominant domain shift.
- domain assumption k-means clusters of stain color matrices within a mini-batch define meaningful pseudo-domain labels.
- domain assumption Averaging raw and stain-transformed embeddings removes domain-specific components from the contrastive anchor.
Cite this review
Pith. "Pith review of Stain-aware Domain Alignment for Imbalance Blood Cell Classification." pith.science (2026). https://pith.science/paper/2B3FRY2W
@misc{pith2026241202976,
  author       = {Pith},
  title        = {Pith review of: Stain-aware Domain Alignment for Imbalance Blood Cell Classification},
  year         = {2026},
  howpublished = {\url{https://pith.science/paper/2B3FRY2W}},
  note         = {Machine review of arXiv:2412.02976}
}
read the original abstract
Blood cell identification is critical for hematological analysis as it aids physicians in diagnosing various blood-related diseases. In real-world scenarios, blood cell image datasets often present the issues of domain shift and data imbalance, posing challenges for accurate blood cell identification. To address these issues, we propose a novel blood cell classification method termed SADA via stain-aware domain alignment. The primary objective of this work is to mine domain-invariant features in the presence of domain shifts and data imbalances. To accomplish this objective, we propose a stain-based augmentation approach and a local alignment constraint to learn domain-invariant features. Furthermore, we propose a domain-invariant supervised contrastive learning strategy to capture discriminative features. We decouple the training process into two stages of domain-invariant feature learning and classification training, alleviating the problem of data imbalance. Experiment results on four public blood cell datasets and a private real dataset collected from the Third Affiliated Hospital of Sun Yat-sen University demonstrate that SADA can achieve a new state-of-the-art baseline, which is superior to the existing cutting-edge methods with a big margin. The source code can be available at the URL (\url{https://github.com/AnoK3111/SADA}).
Figures


Figures from the paper (3 more)


Reference graph
Works this paper leans on
-
[1]
Q. Wang, T. Shi, M. Wan, J. Wei, F. Wang, and C. Mao, “Research progress of using micro/nanomotors in the detection and therapy of dis- eases related to the blood environment,” Journal of Materials Chemistry B, vol. 9, no. 2, pp. 283–294, 2021
work page 2021
-
[2]
Q. Liu, Z. Wang, S. Rong, J. Li, and Y . Zhang, “Revisiting foreground and background separation in weakly-supervised temporal action local- ization: A clustering-based approach,” in Proceedings of the IEEE/CVF International Conference on Computer Vision , pp. 10433–10443, 2023
work page 2023
-
[3]
Pdisconet: Semantically consistent part discovery for fine-grained recognition,
R. van der Klis, S. Alaniz, M. Mancini, C. F. Dantas, D. Ienco, Z. Akata, and D. Marcos, “Pdisconet: Semantically consistent part discovery for fine-grained recognition,” in Proceedings of the IEEE/CVF International Conference on Computer Vision , pp. 1866–1876, 2023
work page 2023
-
[4]
R. M. Umer, A. Gruber, S. S. Boushehri, C. Metak, and C. Marr, “Imbalanced domain generalization for robust single cell classification in hematological cytomorphology,” arXiv preprint arXiv:2303.07771 , 2023
work page Pith review arXiv 2023
-
[5]
Explainable ai identifies diagnostic cells of genetic aml subtypes,
M. Hehr, A. Sadafi, C. Matek, P. Lienemann, C. Pohlkamp, T. Haferlach, K. Spiekermann, and C. Marr, “Explainable ai identifies diagnostic cells of genetic aml subtypes,” PLOS Digital Health , vol. 2, no. 3, p. e0000187, 2023
work page 2023
-
[6]
M. A. Jamal, M. Brown, M.-H. Yang, L. Wang, and B. Gong, “Re- thinking class-balanced methods for long-tailed visual recognition from a domain adaptation perspective,” in Proceedings of the IEEE/CVF Conference on Computer Vision and Pattern Recognition , pp. 7610– 7619, 2020
work page 2020
-
[7]
Constructing balance from imbalance for long-tailed image recognition,
Y . Xu, Y .-L. Li, J. Li, and C. Lu, “Constructing balance from imbalance for long-tailed image recognition,” in European Conference on Com- puter Vision, pp. 38–56, Springer, 2022
work page 2022
-
[8]
Ace: Ally complementary experts for solving long-tailed recognition in one-shot,
J. Cai, Y . Wang, and J.-N. Hwang, “Ace: Ally complementary experts for solving long-tailed recognition in one-shot,” in Proceedings of the IEEE/CVF International Conference on Computer Vision , pp. 112–121, 2021
work page 2021
Show all 40 references
-
[9]
Nested collaborative learning for long-tailed visual recognition,
J. Li, Z. Tan, J. Wan, Z. Lei, and G. Guo, “Nested collaborative learning for long-tailed visual recognition,” in Proceedings of the IEEE/CVF Conference on Computer Vision and Pattern Recognition , pp. 6949– 6958, 2022
2022
-
[10]
Decoupling representation and classifier for long-tailed recognition,
B. Kang, S. Xie, M. Rohrbach, Z. Yan, A. Gordo, J. Feng, and Y . Kalantidis, “Decoupling representation and classifier for long-tailed recognition,” in International Conference on Learning Representations , 2019
2019
-
[11]
Learning imbalanced datasets with maximum margin loss,
H. Kang, T. Vu, and C. D. Yoo, “Learning imbalanced datasets with maximum margin loss,” in 2021 IEEE International Conference on Image Processing (ICIP) , IEEE, 2021
2021
-
[12]
Adversarial domain adaptation with domain mixup,
M. Xu, J. Zhang, B. Ni, T. Li, C. Wang, Q. Tian, and W. Zhang, “Adversarial domain adaptation with domain mixup,” in Proceedings of the AAAI Conference on Artificial Intelligence , vol. 34, pp. 6502–6509, 2020
2020
-
[13]
Autoaug- ment: Learning augmentation strategies from data,
E. D. Cubuk, B. Zoph, D. Mane, V . Vasudevan, and Q. V . Le, “Autoaug- ment: Learning augmentation strategies from data,” in 2019 IEEE/CVF Conference on Computer Vision and Pattern Recognition (CVPR), IEEE, 2019
2019
-
[14]
Pcl: Proxy-based contrastive learning for domain generalization,
X. Yao, Y . Bai, X. Zhang, Y . Zhang, Q. Sun, R. Chen, R. Li, and B. Yu, “Pcl: Proxy-based contrastive learning for domain generalization,” in Proceedings of the IEEE/CVF Conference on Computer Vision and Pattern Recognition, pp. 7097–7107, 2022
2022
-
[15]
Selfreg: Self-supervised contrastive regularization for domain generalization,
D. Kim, Y . Yoo, S. Park, J. Kim, and J. Lee, “Selfreg: Self-supervised contrastive regularization for domain generalization,” in Proceedings of the IEEE/CVF International Conference on Computer Vision , pp. 9619– 9628, 2021
2021
-
[16]
Learning imbal- anced datasets with label-distribution-aware margin loss,
K. Cao, C. Wei, A. Gaidon, N. Arechiga, and T. Ma, “Learning imbal- anced datasets with label-distribution-aware margin loss,” Advances in Neural Information Processing Systems , vol. 32, 2019. AUTHOR et al.: TITLE 9
2019
-
[17]
Focal loss for dense object detection,
T.-Y . Lin, P. Goyal, R. Girshick, K. He, and P. Doll ´ar, “Focal loss for dense object detection,” in Proceedings of the IEEE International Conference on Computer Vision , pp. 2980–2988, 2017
2017
-
[18]
Overcoming classifier imbalance for long-tail object detection with balanced group softmax,
Y . Li, T. Wang, B. Kang, S. Tang, C. Wang, J. Li, and J. Feng, “Overcoming classifier imbalance for long-tail object detection with balanced group softmax,” in Proceedings of the IEEE/CVF Conference on Computer Vision and Pattern Recognition , pp. 10991–11000, 2020
2020
-
[19]
Mdcs: More diverse experts with consistency self-distillation for long-tailed recognition,
Q. Zhao, C. Jiang, W. Hu, F. Zhang, and J. Liu, “Mdcs: More diverse experts with consistency self-distillation for long-tailed recognition,” in Proceedings of the IEEE/CVF International Conference on Computer Vision, pp. 11597–11608, 2023
2023
-
[20]
Contrastive learning based hybrid networks for long-tailed image classification,
P. Wang, K. Han, X.-S. Wei, L. Zhang, and L. Wang, “Contrastive learning based hybrid networks for long-tailed image classification,” in Proceedings of the IEEE/CVF Conference on Computer Vision and Pattern Recognition, pp. 943–952, 2021
2021
-
[21]
A simple feature augmentation for domain generalization,
P. Li, D. Li, W. Li, S. Gong, Y . Fu, and T. M. Hospedales, “A simple feature augmentation for domain generalization,” in Proceedings of the IEEE/CVF International Conference on Computer Vision , pp. 8886– 8895, 2021
2021
-
[22]
Reducing domain gap by reducing style bias,
H. Nam, H. Lee, J. Park, W. Yoon, and D. Yoo, “Reducing domain gap by reducing style bias,” in Proceedings of the IEEE/CVF Conference on Computer Vision and Pattern Recognition , pp. 8690–8699, 2021
2021
-
[23]
Cross- domain feature augmentation for domain generalization,
Y . Liu, Y . Zou, R. Qiao, F. Liu, M. L. Lee, and W. Hsu, “Cross- domain feature augmentation for domain generalization,” arXiv preprint arXiv:2405.08586, 2024
2024
-
[24]
Stain mix-up: Unsupervised domain generalization for histopathology images,
J.-R. Chang, M.-S. Wu, W.-H. Yu, C.-C. Chen, C.-K. Yang, Y .-Y . Lin, and C.-Y . Yeh, “Stain mix-up: Unsupervised domain generalization for histopathology images,” in Medical Image Computing and Computer Assisted Intervention–MICCAI 2021: 24th International Conference, Strasbo...
2021
-
[25]
Style neophile: Constantly seeking novel styles for domain generalization,
J. Kang, S. Lee, N. Kim, and S. Kwak, “Style neophile: Constantly seeking novel styles for domain generalization,” in Proceedings of the IEEE/CVF Conference on Computer Vision and Pattern Recognition , pp. 7130–7140, 2022
2022
-
[26]
Randstainna: Learning stain- agnostic features from histology slides by bridging stain augmentation and normalization,
Y . Shen, Y . Luo, D. Shen, and J. Ke, “Randstainna: Learning stain- agnostic features from histology slides by bridging stain augmentation and normalization,” in International Conference on Medical Image Computing and Computer-Assisted Intervention , pp. 212–221, Springer, 2022
2022
-
[27]
Rethinking multi-domain generaliza- tion with a general learning objective,
Z. Tan, X. Yang, and K. Huang, “Rethinking multi-domain generaliza- tion with a general learning objective,”arXiv preprint arXiv:2402.18853, 2024
2024 arXiv
-
[28]
Domain generalization with adversarial feature learning,
H. Li, S. J. Pan, S. Wang, and A. C. Kot, “Domain generalization with adversarial feature learning,” in Proceedings of the IEEE Conference on Computer Vision and Pattern Recognition , pp. 5400–5409, 2018
2018
-
[29]
Supervised contrastive learn- ing,
P. Khosla, P. Teterwak, C. Wang, A. Sarna, Y . Tian, P. Isola, A. Maschinot, C. Liu, and D. Krishnan, “Supervised contrastive learn- ing,” Advances in Neural Information Processing Systems , vol. 33, pp. 18661–18673, 2020
2020
-
[30]
Learning from extrin- sic and intrinsic supervisions for domain generalization,
S. Wang, L. Yu, C. Li, C.-W. Fu, and P.-A. Heng, “Learning from extrin- sic and intrinsic supervisions for domain generalization,” in European Conference on Computer Vision , pp. 159–176, Springer, 2020
2020
-
[31]
Feature stylization and domain-aware contrastive learning for domain generalization,
S. Jeon, K. Hong, P. Lee, J. Lee, and H. Byun, “Feature stylization and domain-aware contrastive learning for domain generalization,” in Proceedings of the 29th ACM International Conference on Multimedia , pp. 22–31, 2021
2021
-
[32]
Progressive domain expansion network for single domain gen- eralization,
L. Li, K. Gao, J. Cao, Z. Huang, Y . Weng, X. Mi, Z. Yu, X. Li, and B. Xia, “Progressive domain expansion network for single domain gen- eralization,” in Proceedings of the IEEE/CVF Conference on Computer Vision and Pattern Recognition , pp. 224–233, 2021
2021
-
[33]
Structure- preserving color normalization and sparse stain separation for histolog- ical images,
A. Vahadane, T. Peng, A. Sethi, S. Albarqouni, L. Wang, M. Baust, K. Steiger, A. M. Schlitter, I. Esposito, and N. Navab, “Structure- preserving color normalization and sparse stain separation for histolog- ical images,” IEEE Transactions on Medical Imaging , vol. 35, no. 8, p...
1962
-
[34]
An overview of statistical learning theory,
V . N. Vapnik, “An overview of statistical learning theory,” IEEE Trans- actions on Neural Networks , vol. 10, no. 5, pp. 988–999, 1999
1999
-
[35]
Deep coral: Correlation alignment for deep domain adaptation,
B. Sun and K. Saenko, “Deep coral: Correlation alignment for deep domain adaptation,” in Computer Vision–ECCV 2016 Workshops: Ams- terdam, The Netherlands, October 8-10 and 15-16, 2016, Proceedings, Part III 14, pp. 443–450, Springer, 2016
2016
-
[36]
A dataset of microscopic peripheral blood cell images for development of automatic recognition systems,
A. Acevedo, A. Merino Gonz ´alez, E. S. Alf ´erez Baquero, ´A. Molina Borr ´as, L. Bold ´u Nebot, and J. Rodellar Bened ´e, “A dataset of microscopic peripheral blood cell images for development of automatic recognition systems,” Data in Brief , vol. 30, p. 105474, 2020
2020
-
[37]
A large dataset of white blood cells containing cell locations and types, along with segmented nuclei and cytoplasm,
Z. M. Kouzehkanan, S. Saghari, S. Tavakoli, P. Rostami, M. Abaszadeh, F. Mirzadeh, E. S. Satlsar, M. Gheidishahran, F. Gorgi, S. Mohammadi, et al., “A large dataset of white blood cells containing cell locations and types, along with segmented nuclei and cytoplasm,” Scientific...
2022
-
[38]
Transmixnet: an attention based double-branch model for white blood cell classification and its training with the fuzzified training data,
H. Chen, J. Liu, C. Hua, Z. Zuo, J. Feng, B. Pang, and D. Xiao, “Transmixnet: an attention based double-branch model for white blood cell classification and its training with the fuzzified training data,” in 2021 IEEE International Conference on Bioinformatics and Biomedicine ...
2021
-
[39]
Fast and robust segmenta- tion of white blood cell images by self-supervised learning,
X. Zheng, Y . Wang, G. Wang, and J. Liu, “Fast and robust segmenta- tion of white blood cell images by self-supervised learning,” Micron, vol. 107, pp. 55–71, 2018
2018
-
[40]
Swad: Domain generalization by seeking flat minima,
J. Cha, S. Chun, K. Lee, H.-C. Cho, S. Park, Y . Lee, and S. Park, “Swad: Domain generalization by seeking flat minima,” Advances in Neural Information Processing Systems , vol. 34, pp. 22405–22418, 2021
2021
Reviewed August 11, 2026 · model on record in the stance chip above.
Discussion (0). Continue with ORCID to comment.