Scene-based field validation of wearable light loggers
Pith reviewed 2026-06-26 21:51 UTC · model grok-4.3
The pith
A scene-based validation framework using 433 real-world scenes shows wearable light loggers stabilize in performance after about 100 scenes with consistent cross-site results.
A machine-rendered reading of the paper's core claim, the machinery that carries it, and where it could break.
Core claim
The authors developed a scene-based field validation framework that integrates wearable light loggers with laboratory-grade spectral reference instruments and image-based scene characterisation. When applied to 433 natural scenes at two sites, the ActTrust2 and ActLumus devices showed high agreement with references (R² values of 0.988-0.990) but systematically underestimated illuminance. Bias varied by lighting condition, from -0.065 log units in daylight to -0.195 in artificial light, and scene complexity and other factors influenced errors. Resampling showed performance metrics stabilize at approximately 100 scenes, and cross-site tests confirmed consistent results, establishing the framew
What carries the argument
The scene-based field validation framework that pairs wearable devices with spectral references and image characterisation to assess performance across diverse natural lighting scenes.
If this is right
- Single-condition or limited-category tests can underestimate or overestimate overall wearable performance.
- Performance estimates stabilize at approximately 100 scenes for reliable field validation.
- Bias is smaller in daylight-only scenes (-0.065 log units) than in artificial-only scenes (-0.195 log units).
- Cross-site validation yields consistent performance, supporting reproducibility of the framework.
- Lighting condition, scene complexity, time of day, and study site each contribute to measurement bias.
Where Pith is reading between the lines
- The same scene-sampling logic could be adapted to validate other wearable environmental sensors such as temperature or air-quality loggers.
- The result that roughly 100 scenes suffice may reduce the effort needed for future field validations compared with exhaustive testing.
- Mixed lighting scenes appear essential in any validation set to avoid under-capturing realistic bias levels.
- This framework could help set minimum standards for how personal light-exposure data are collected in circadian and sleep studies.
Load-bearing premise
The laboratory-grade spectral instruments supply the true ground-truth values and the selected scenes adequately cover the variability of everyday lighting without systematic bias in choice.
What would settle it
Collecting a fresh set of scenes that includes lighting conditions or complexities absent from the original 433 and finding that bootstrap performance estimates fail to stabilize until well past 100 scenes or show large site-to-site differences.
Figures
read the original abstract
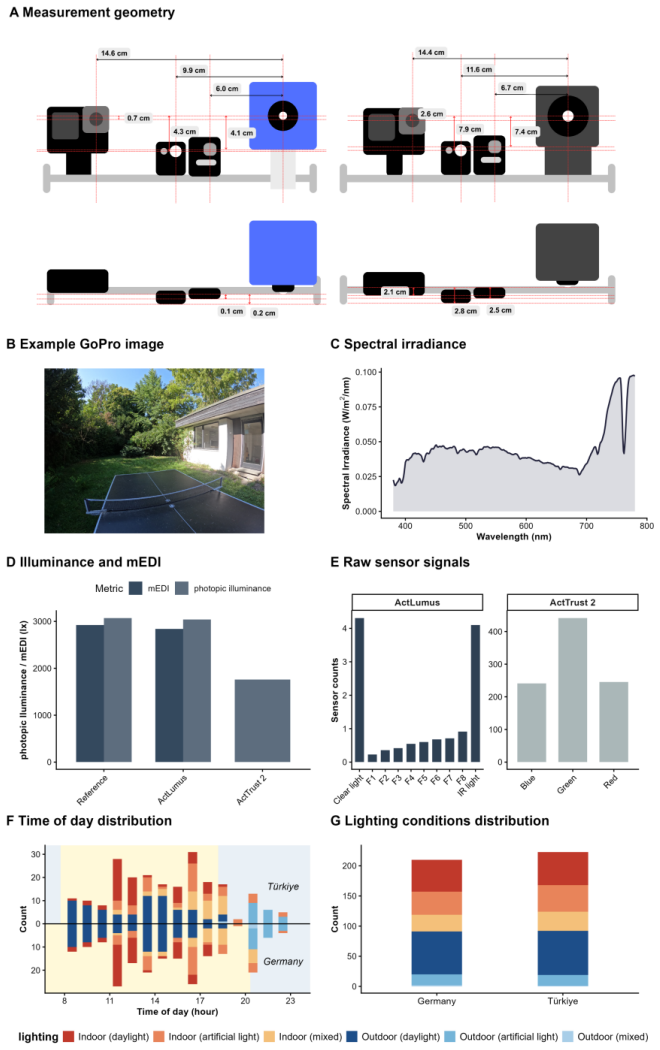
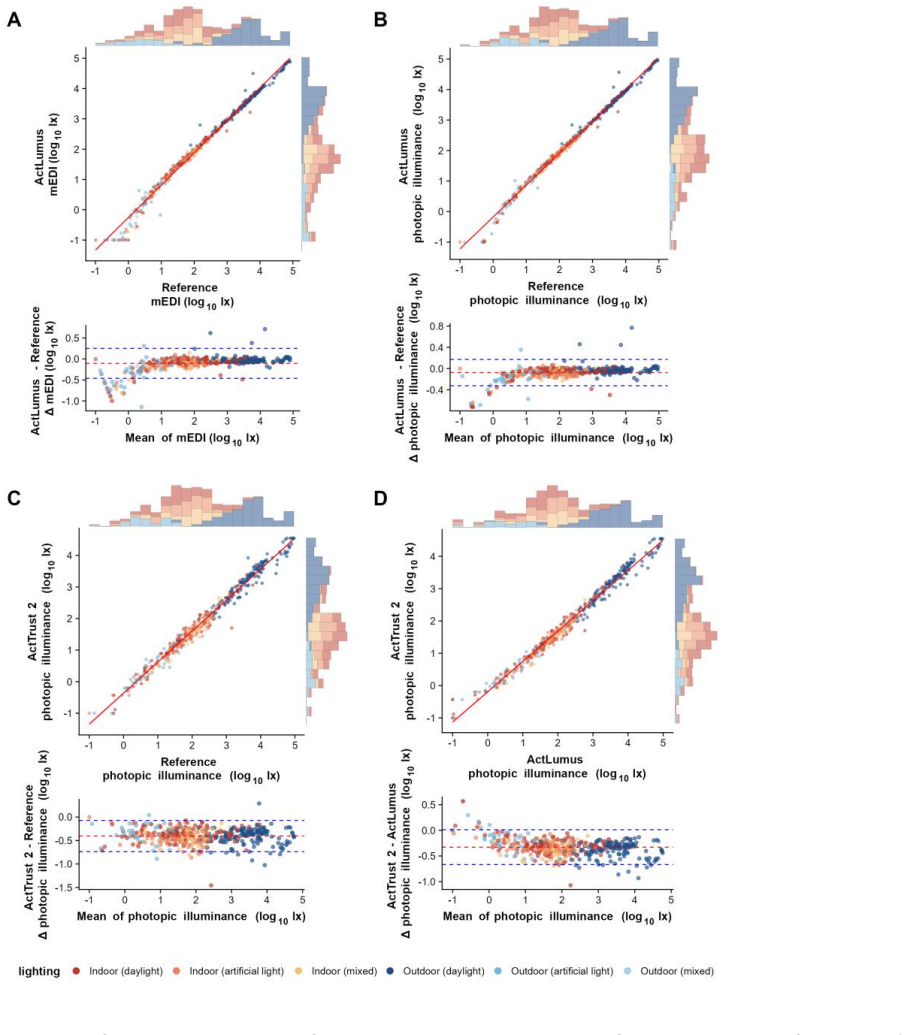
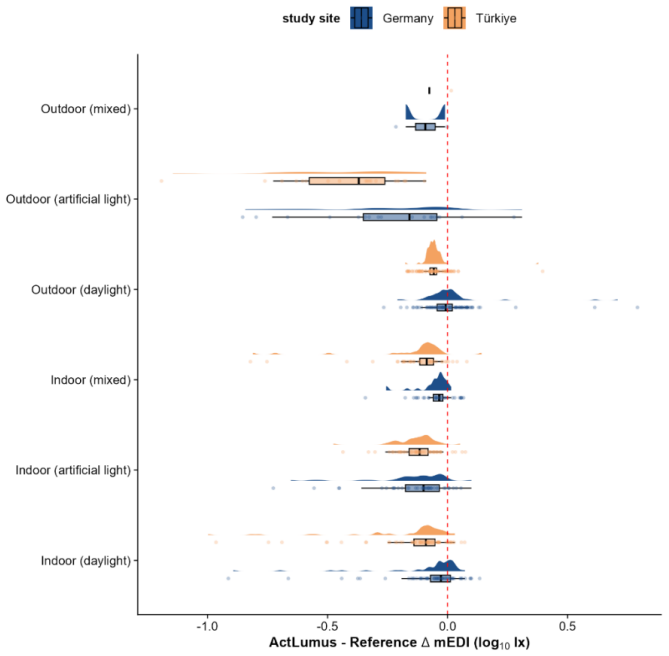
Wearable light loggers are increasingly used to measure personal light exposure. However, there is no standardised method to test how well these devices perform in real-world settings. To address this, we developed a scene-based field validation framework combining wearable light loggers, laboratory-grade spectral reference instruments, and image-based scene characterisation to evaluate wearable performance in the field. We applied the validation framework to ActTrust2 and ActLumus light loggers using 433 natural, everyday scenes across two sites: T\"ubingen, Germany (n=210), and Izmir, T\"urkiye (n=223), spanning indoor and outdoor environments in daylight, artificial light and mixed scenarios, across wide range of photopic and melanopic equivalent daylight illuminances. Both light loggers exhibited high agreement with the reference instruments (R^2=0.988-0.990), but they systematically underestimated light exposure. The lighting condition, scene complexity, time of day, and study site contributed significantly to measurement bias. Resampling under specific lighting conditions indicated that bias ranged from -0.065 log units in daylight-only situations to -0.195 log units in artificial-only situations. This suggested that single-condition assessments with limited spectra or scene categories can underestimate or overestimate overall wearable performance. Bootstrap resampling demonstrated that performance estimates stabilised at approximately 100 scenes, indicating that a diverse sample of this size is sufficient for reliable field validation. Finally, cross-site validation showed consistent performance across two sites, supporting the framework's reproducibility. Overall, these findings establish our validation framework as an effective tool for guiding scene diversity and sampling design for ecologically valid field validation of wearable light loggers.
Editorial analysis
A structured set of objections, weighed in public.
Referee Report
Summary. The manuscript presents a scene-based field validation framework for wearable light loggers, applied to ActTrust2 and ActLumus devices across 433 natural scenes at two sites (Tübingen n=210, Izmir n=223). It reports high agreement with laboratory-grade spectral reference instruments (R²=0.988–0.990), systematic underestimation, significant effects of lighting condition/scene complexity/time of day/site on bias, resampling showing bias variation by condition (-0.065 to -0.195 log units), bootstrap stabilization of performance estimates at ~100 scenes, and consistent cross-site performance, concluding that the framework effectively guides scene diversity and sampling for ecologically valid validation.
Significance. If the empirical results hold, the work supplies a practical, multi-site framework for real-world validation of wearable light loggers that incorporates scene diversity and demonstrates that ~100 scenes suffice for stable estimates. This addresses a gap in standardized field testing and could improve ecological validity over single-condition laboratory assessments, with the cross-site consistency providing evidence of reproducibility.
major comments (2)
- [Abstract / Results (bias analysis)] Abstract and results on bias by lighting condition: the reported bias range (-0.065 log units in daylight-only to -0.195 in artificial-only) and the claim that single-condition assessments can misestimate overall performance rest on the untested assumption that the laboratory-grade spectral reference instruments supply unbiased ground-truth photopic and melanopic illuminance values in all field geometries and mixed conditions; no quantitative check on reference fidelity (e.g., cosine response or spectral mismatch) is provided.
- [Abstract / Bootstrap resampling section] Bootstrap resampling results: the central claim that performance estimates stabilize at approximately 100 scenes (supporting the framework's utility for guiding sampling design) is presented without reported error bars, confidence intervals on the stabilization threshold, or details on the resampling procedure (e.g., stratification by site, lighting condition, or scene complexity), which directly affects the robustness of the ~100-scene guideline.
minor comments (2)
- [Abstract] The abstract states that lighting condition, scene complexity, time of day, and study site 'contributed significantly' to bias but does not report the statistical model, p-values, or effect sizes; adding these would improve clarity without altering the central empirical comparison.
- [Methods / Results] Scene selection and exclusion criteria are noted as important but lack quantitative assessment of coverage or bias impact; a supplementary table summarizing scene distribution by condition and complexity would strengthen the representativeness discussion.
Simulated Author's Rebuttal
We thank the referee for their constructive comments, which help clarify the presentation of our field validation framework. We respond point-by-point to the major comments below.
read point-by-point responses
-
Referee: [Abstract / Results (bias analysis)] Abstract and results on bias by lighting condition: the reported bias range (-0.065 log units in daylight-only to -0.195 in artificial-only) and the claim that single-condition assessments can misestimate overall performance rest on the untested assumption that the laboratory-grade spectral reference instruments supply unbiased ground-truth photopic and melanopic illuminance values in all field geometries and mixed conditions; no quantitative check on reference fidelity (e.g., cosine response or spectral mismatch) is provided.
Authors: We acknowledge that the manuscript does not include new quantitative checks (such as direct measurements of cosine response or spectral mismatch) for the reference spectroradiometers under the precise field geometries and mixed lighting conditions encountered. The devices are calibrated laboratory-grade instruments with manufacturer specifications for these properties, and we treated them as the best available ground truth. This is a fair point about an untested assumption in the bias analysis. In revision we will add a concise discussion of reference instrument specifications and this limitation in the methods or discussion section, while retaining the empirical observation that single-condition sampling can produce different bias estimates than the full scene set. revision: partial
-
Referee: [Abstract / Bootstrap resampling section] Bootstrap resampling results: the central claim that performance estimates stabilize at approximately 100 scenes (supporting the framework's utility for guiding sampling design) is presented without reported error bars, confidence intervals on the stabilization threshold, or details on the resampling procedure (e.g., stratification by site, lighting condition, or scene complexity), which directly affects the robustness of the ~100-scene guideline.
Authors: We agree that the bootstrap section would be strengthened by explicit methodological details and measures of uncertainty. The procedure involved repeated random sampling of increasing scene subsets and tracking convergence of R² and bias; stratification by site and lighting condition was applied in some runs but not fully documented. In the revised manuscript we will expand the methods to describe the exact resampling algorithm, any stratification used, and will report variability (e.g., standard deviation across resamples or 95% intervals) around the stabilization threshold, either in text or as error bands on the relevant figure. revision: yes
Circularity Check
No circularity: empirical device-to-reference comparisons with no self-referential derivations
full rationale
The paper is a purely empirical validation study. All reported metrics (R² values of 0.988–0.990, bias estimates by lighting condition, bootstrap stabilization at ~100 scenes, cross-site consistency) are computed directly from paired measurements of wearable loggers against laboratory-grade spectral references across 433 scenes. No equations, fitted parameters, or derivations are present that reduce any performance claim to a quantity defined by the same data or by self-citation. Bootstrap resampling and statistical tests are standard, externally verifiable procedures applied to the collected dataset; they do not create circularity. The framework's conclusions rest on observable agreement and variability in the field data rather than any self-definitional or load-bearing self-citation step.
Axiom & Free-Parameter Ledger
axioms (2)
- domain assumption Laboratory-grade spectral instruments provide accurate reference measurements of photopic and melanopic equivalent daylight illuminance in all tested scenes.
- domain assumption The 433 selected scenes adequately capture the diversity of natural, everyday indoor/outdoor and lighting conditions without systematic selection bias.
Reference graph
Works this paper leans on
-
[1]
Physiologically-relevant light exposure and light behaviour in Switzerland and Malaysia
Biller AM, Zauner J, Cajochen C, et al. Physiologically-relevant light exposure and light behaviour in Switzerland and Malaysia. J Expo Sci Environ Epidemiol. 2026;36(2):409–
2026
-
[2]
https://doi.org/10.1038/s41370-025-00825-8
-
[3]
Behavioural determinants of physiologically-relevant light exposure
Biller AM, Balakrishnan P, Spitschan M. Behavioural determinants of physiologically-relevant light exposure. Communications Psychology. 2024;2:114. https://doi.org/10.1038/s44271-024- 00159-5
-
[4]
Zauner J, Didikoglu A, Aerts S, et al. Individual, behavioural, and environmental determinants of personal light exposure in daily life: A multi-country wearable and experience-sampling study. bioRxiv. Preprint posted online June 9, 2026. https://doi.org/10.64898/2026.06.04.730226
-
[5]
Linking light exposure and subsequent sleep: A field polysomnography study in humans
Wams EJ, Woelders T, Marring I, et al. Linking light exposure and subsequent sleep: A field polysomnography study in humans. Sleep. 2017;40(12):zsx165. https://doi.org/10.1093/sleep/zsx165
-
[6]
Didikoglu A, Mohammadian N, Johnson S, et al. Associations between light exposure and sleep timing and sleepiness while awake in a sample of UK adults in everyday life. Proc Natl Acad Sci U S A. 2023;120(42):e2301608120. https://doi.org/10.1073/pnas.2301608120
-
[7]
The impact of daytime light exposures on sleep and mood in office workers
Figueiro MG, Steverson B, Heerwagen J, et al. The impact of daytime light exposures on sleep and mood in office workers. Sleep Health. 2017;3(3):204–
2017
-
[8]
https://doi.org/10.1016/j.sleh.2017.03.005
-
[9]
Alignment between 24-h light-dark and activity-rest rhythms is associated with diabetes and glucose metabolism in a nationally representative sample of American adults
Xiao Q, Durbin J, Bauer C, Yeung CHC, Figueiro MG. Alignment between 24-h light-dark and activity-rest rhythms is associated with diabetes and glucose metabolism in a nationally representative sample of American adults. Diabetes Care. 2023;46(12):2171–
2023
-
[10]
https://doi.org/10.2337/dc23-1034
-
[11]
Salamone F, Altomonte S, Amorim CND, et al. Wearable monitoring for evaluating non-visual effects of light on health and well-being: a systematic review. Build Environ. 2025;284:113482. https://doi.org/10.1016/j.buildenv.2025.113482 31
-
[12]
Measuring light exposure in daily life: A review of wearable light loggers
van Duijnhoven J, Hartmeyer SL, Didikoglu A, et al. Measuring light exposure in daily life: A review of wearable light loggers. Build Environ. 2025;274:112771. https://doi.org/10.1016/j.buildenv.2025.112771
-
[13]
Figueiro MG, Hamner R, Bierman A, Rea MS. Comparisons of three practical field devices used to measure personal light exposures and activity levels. Lighting Research and Technology. 2013;45(4):421–434. https://doi.org/10.1177/1477153512450453
-
[14]
Markvart J, Hansen ÅM, Christoffersen J. Comparison and correction of the light sensor output from 48 wearable light exposure devices by using a side-by-side field calibration method. LEUKOS - Journal of Illuminating Engineering Society of North America. 2015;11(3):155–171. https://doi.org/10.1080/15502724.2015.1020948
-
[15]
Ishihara A, Brychta RJ, LaMunion SR, et al. Performance of wearable light sensors for measuring photopic and melanopic illuminance under laboratory and free-living conditions. Sleep. 2026;49(2):zsaf358. https://doi.org/10.1093/sleep/zsaf358
-
[16]
Measuring and using light in the melanopsin age
Lucas RJ, Peirson SN, Berson DM, et al. Measuring and using light in the melanopsin age. Trends Neurosci. 2014;37(1):1–9. https://doi.org/10.1016/j.tins.2013.10.004
-
[17]
R: A language and environment for statistical computing
R Core Team. R: A language and environment for statistical computing. Vienna, Austria: R Foundation for Statistical Computing; 2025. https://www.R-project.org/
2025
-
[18]
McDowell RJ, Didikoglu A, Woelders T, et al. Beyond lux: Methods for species and photoreceptor-specific quantification of ambient light for mammals. BMC Biol. 2024;22(1):257. https://doi.org/10.1186/s12915-024-02038-1
-
[19]
CIE system for metrology of optical radiation for ipRGC-influenced responses to light (CIE S 026/E:2018)
International Commission on Illumination. CIE system for metrology of optical radiation for ipRGC-influenced responses to light (CIE S 026/E:2018). Vienna, Austria: CIE
2018
-
[20]
https://doi.org/10.25039/S026.2018
-
[21]
scikit-image: Image processing in Python,
van der Walt S, Schönberger JL, Nunez-Iglesias J, et al. scikit-image: Image processing in Python. PeerJ. 2014;2:e453. https://doi.org/10.7717/peerj.453 32
-
[22]
Dates and times made easy with lubridate
Grolemund G, Wickham H. Dates and times made easy with lubridate. J Stat Softw. 2011;40(3):1–25. https://doi.org/10.18637/jss.v040.i03
-
[23]
suncalc: Compute sun position, sunlight phases, moon position and lunar phase
Thieurmel B, Elmarhraoui A. suncalc: Compute sun position, sunlight phases, moon position and lunar phase. R package version 0.5.0; 2022. https://CRAN.R-project.org/package=suncalc
2022
-
[24]
stats: The R stats package
R Core Team. stats: The R stats package. Included in R version 4.4.3. Vienna, Austria: R Foundation for Statistical Computing; 2025. https://www.R-project.org/
2025
-
[25]
An R companion to applied regression
Fox J, Weisberg S. An R companion to applied regression. 3rd ed. Thousand Oaks, CA: Sage; 2019
2019
-
[26]
broom: Convert statistical objects into tidy tibbles
Robinson D, Hayes A, Couch S. broom: Convert statistical objects into tidy tibbles. R package version 1.0.7; 2024. https://CRAN.R-project.org/package=broom
2024
-
[27]
corrplot: Visualization of a correlation matrix
Wei T, Simko V. corrplot: Visualization of a correlation matrix. R package version 0.95
-
[28]
https://CRAN.R-project.org/package=corrplot
-
[29]
emmeans: Estimated marginal means, aka least-squares means
Lenth RV. emmeans: Estimated marginal means, aka least-squares means. R package version 1.10.7; 2025. https://CRAN.R-project.org/package=emmeans
2025
-
[30]
purrr: Functional programming tools
Henry L, Wickham H. purrr: Functional programming tools. R package version 1.0.4
-
[31]
https://CRAN.R-project.org/package=purrr
-
[32]
ggplot2: Elegant graphics for data analysis
Wickham H. ggplot2: Elegant graphics for data analysis. 3rd ed. Cham, Switzerland: Springer; 2016
2016
-
[33]
ggdist: Visualizations of distributions and uncertainty
Kay M. ggdist: Visualizations of distributions and uncertainty. R package version 3.3.2
-
[34]
https://CRAN.R-project.org/package=ggdist
-
[35]
Kulesa et al., Sampling distributions and the bootstrap
Kulesa A, Krzywinski M, Blainey P, Altman N. Sampling distributions and the bootstrap. Nat Methods. 2015;12(6):477–478. https://doi.org/10.1038/nmeth.3414
-
[36]
Phillips AJK, Vidafar P, Burns AC, et al. High sensitivity and interindividual variability in the response of the human circadian system to evening light. Proc Natl Acad Sci U S A. 2019;116(24):12019–12024. https://doi.org/10.1073/pnas.1901824116
discussion (0)
Sign in with ORCID, Apple, or X to comment. Anyone can read and Pith papers without signing in.