REVIEW 4 major objections 5 minor 1 cited by
Developing an Unsupervised Real-time Anomaly Detection Scheme for Time Series with Multi-seasonality
T0 review · 4 major / 5 minor · reviewed 2026-08-14 · deepseek-v4-flash
Pith's one-line read The paper claims that an unsupervised, real-time anomaly detector can outperform five established baselines on multi-seasonal time series by scoring each frame with Local Trend Inconsistency, a measure of how far actual data deviate from…
desk verdict Genuinely new LTI weighting metric and a fair empirical comparison, but the Server Log AUC headline rests on private labels and the paper needs error bars and a defined constant before I'd trust the full comparison. read the letter →
The pith
A machine-rendered reading of the paper's core claim, the machinery that carries it, and where it could break.
The reading
What carries the argument
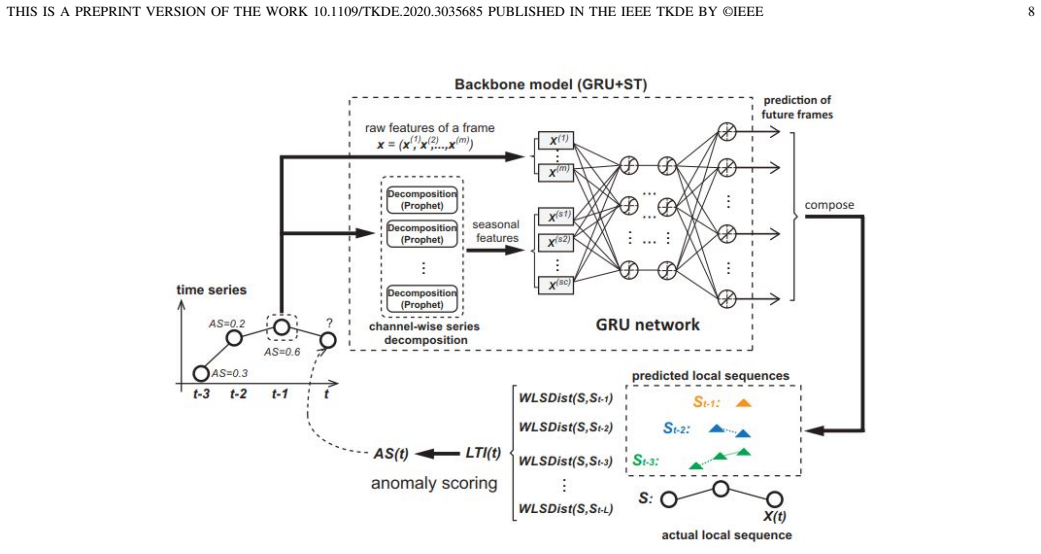
The load-bearing object is Local Trend Inconsistency (LTI), a normalized, exponentially time-decayed distance between an actual local sequence and a multi-source ensemble forecast. The paper expresses its computation as the matrix product $LTI(t)=P N_2 N_1 D_F T$, where $D_F$ holds frame distances, $T$ holds time-decay weights, and $P$ holds source normalcy probabilities, and argues that this form is parallelizable to $O(m+L)$ per frame. Supporting LTI is a two-module predictor: a decomposition module that extracts daily and weekly seasonal terms per channel and feeds them into a stacked gated recurrent unit that forecasts local sequences of length $L$; the seasonal augmentation is what lets the predictor learn multi-period patterns without long back-propagation through time.
What would settle it
Have a second security technician independently re-annotate the server-log test set, then recompute AD-LTI and LSTM-AD AUC values on those new labels; if the gap shrinks to the magnitude seen on the public datasets, the claimed dominance rests on the original annotations rather than on Local Trend Inconsistency.
Extended reading notes
Core claim
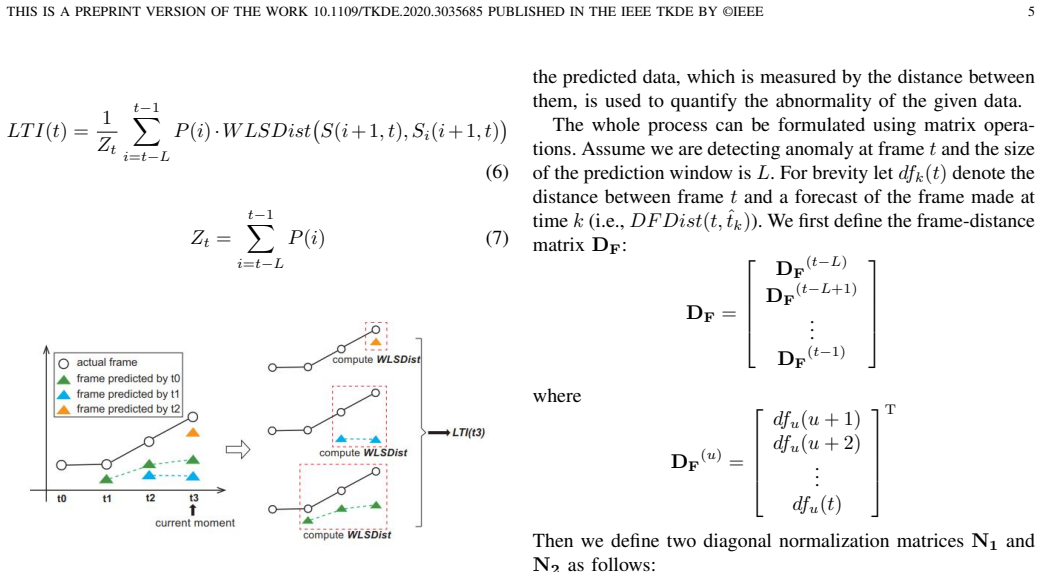
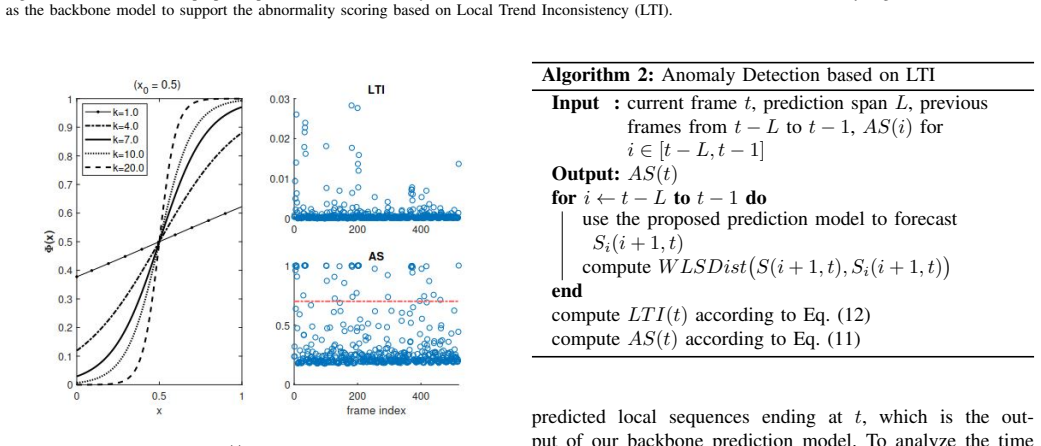
The central claim is that a frame is anomalous to the degree that its recent local trend departs from an ensemble of short-horizon forecasts made at different earlier times, where each forecast's contribution is damped if its source frame is itself suspicious. Formally, for frame $t$, $LTI(t) = \frac{1}{Z_t}\sum_{i=t-L}^{t-1}(1-AS(i))\,WLSDist(S(i+1,t), S_i(i+1,t))$, with $S_i(i+1,t)$ the sequence predicted from source $i$, $WLSDist$ a time-decayed, length-normalized frame distance, and $Z_t$ the sum of the normalcy weights. The paper asserts that mapping $LTI(t)$ through a logistic scoring function with parameters fit iteratively on a reference segment separates normal from anomalous frames better than raw prediction error, and that this scoring procedure, run chronologically, gives unsupervised real-time detection without storing large histories.
Load-bearing premise
The load-bearing premise is that the manually annotated anomaly labels on the private server-log test set are correct and were produced independently of the algorithm; that dataset is where AD-LTI's AUC advantage is largest (0.977 versus 0.793).
Editorial extensions
If this is right
- On the three test sets, AD-LTI reports AUC 0.935, 0.977, and 0.923, above OCSVM, Isolation Forest, Piecewise AD, LSTM-FD, and LSTM-AD, with the largest gap on the server-log data.
- Prediction-driven detectors (LSTM-FD, LSTM-AD, AD-LTI) outperform point-outlier methods on the noisy highway-traffic set, suggesting that local trend comparison is the operative advantage there.
- The seasonal-augmented GRU reduces test MSE by 20 to 50 percent relative to the same GRU without seasonal terms, with no increase in training time to convergence.
- With parallelization, per-frame detection complexity drops from $O(L^2 m)$ to $O(m+L)$, supporting the real-time claim for short probe windows.
- Probe length $L$ values between 5 and 20 are recommended; larger values dilute local information and reduce AUC on the server-log data.
Reading between the lines
- Beyond the paper: LTI is a scoring layer that could wrap any sequence forecaster, not only the specific GRU-plus-decomposition backbone; substituting a different forecaster would test whether the metric or the model carries the reported gains.
- Because LTI weights the most recent frames exponentially, it may miss slow-drift anomalies that build gradually without a sharp local break; an injected gradual-ramp experiment on a labeled series would reveal this blind spot.
- Anomaly scores feed back into source weights, so a single early mis-scoring can influence later frames; perturbing a few early scores in a replay would quantify how far such errors propagate.
- The parallelization argument assumes an ideal grid of $L\times L$ processes; on real hardware the practical latency floor is set by memory movement and model inference, so end-to-end streaming measurements would be the true test of the real-time claim.
Signed reviews
Editorial analysis
A structured set of objections, weighed in public.
Referee Report
Summary. The paper proposes AD-LTI, an unsupervised, prediction-driven anomaly detection scheme for time series with multi-seasonality. Its backbone combines Prophet-based decomposition (daily and weekly seasonal terms) with a stacked GRU network that predicts local sequences of length L for every arriving frame. Detection rests on a new metric, Local Trend Inconsistency (LTI), which measures the weighted distance between an actual local sequence and an ensemble of predictions made from multiple earlier source frames; each source is weighted by its estimated probability of being normal. LTI values are mapped through a logistic function to anomaly scores, with the logistic parameters k and x0 fitted automatically by an iterative procedure on a reference series. Experiments on CalIt2, a private Server Log dataset, and Dodgers Loop compare AD-LTI against OCSVM, Isolation Forest, Piecewise AD, LSTM-FD, and LSTM-AD; the paper reports the highest AUC in all three cases (0.935, 0.977, and 0.923, respectively) and reports per-frame overheads in the sub-millisecond range.
Significance. If the empirical results hold, the paper makes a useful practical contribution: an online unsupervised detector that combines explicit seasonal decomposition with multi-source prediction weighting, plus a matrix formulation that supports parallelization. The overhead measurements (roughly 0.19-1.46 ms per frame in Table V) are consistent with real-time operation, and the two public datasets provide some evidence that the scheme is competitive. The strongest part of the claimed advantage, however, comes from the private Server Log dataset (0.977 vs. 0.793 for the best baseline), whose labels cannot be independently verified from the manuscript. In addition, the lack of confidence intervals or repeated trials, the apparent test-set selection of L*, and the unreported constant c all weaken the evidence base for the headline claim of consistent, significant outperformance. The central algorithmic idea is defensible, but the experimental demonstration needs substantial reinforcement before the claim can be accepted at face value.
major comments (4)
- [Section V, Server Log Dataset and Table IV] The largest reported AUC gain rests on labels that are not documented or verifiable. The manuscript states only that 76 frames in the private test set were 'acquired from the technicians' and gives no annotation protocol, no definition of what constituted an anomalous event, no inter-annotator agreement, and no raw data or label file. With 520 test frames and a 14.6% contamination ratio, a small number of ambiguous or misapplied labels can materially change AUC. I do not claim the labels are wrong, but the paper's strongest numerical result (0.977 vs. 0.793) cannot be distinguished from label artifact unless the authors release the anonymized labels and annotation instructions or replace this dataset with a publicly verifiable one.
- [Section V-B, Tables IV and V] The comparisons are based on single AUC values with no confidence intervals, repeated runs, or significance tests. This matters because Isolation Forest is randomized and all LSTM/GRU training is stochastic; moreover, the margins on CalIt2 (0.935 vs. 0.900) and Dodgers Loop (0.923 vs. 0.859) are not obviously robust. In addition, the values in Table IV appear to be the best-over-L AUC values from Table V, yet the text never states that L* was chosen on a validation set. If L* was selected by maximizing test AUC, the comparison is optimistically biased. Please report mean and standard deviation over multiple seeds, state the L-selection rule, and provide all configurations or validation-based selection.
- [Section IV-C, Eq. (12), and Algorithm 1] The iterative re-weighting loop is self-referential: LTI(t) uses (1-AS(i)) from earlier frames, and AS(i) is itself a logistic transform of an earlier LTI value. The manuscript gives no convergence proof, no fixed-point characterization, and no sensitivity analysis for the initialization AS(i)=0 or for the 0.1% stopping criterion. Because this feedback can in principle downweight high-LTI frames that are true anomalies if the initial scoring is imperfect, it could inflate apparent detection performance on the private dataset. This is not circular with respect to the evaluation labels, since k and x0 are normalized to the reference LTI distribution rather than to AUC, but the stability and robustness of the recursion should be demonstrated, for example by comparing with fixed uniform weights and by perturbing the initialization.
- [Section IV-C, Eq. (10), and Algorithm 1] The constant c in k = c/stdev(LTI) is never given a value, nor is its sensitivity analyzed. Since every anomaly score is produced by the logistic function whose steepness is controlled by k, the experimental results cannot be reproduced without knowing c. The claim that the procedure 'unparameterizes' the scoring function is therefore incomplete. Please state the value of c used for each dataset or, preferably, provide a sensitivity analysis showing that the reported AUC ranking is stable over a range of c.
minor comments (5)
- [Section III, matrix formulation] The dimensions of DF, N1, N2, and T are not stated explicitly, and the notation DF^(u) as a column vector inside a row block is easy to misread; a short paragraph defining each matrix's shape would make Eq. (8) much clearer.
- [Table III caption] The word 'INDICTED' in the caption should be 'INDICATED'.
- [Fig. 1] The text below Fig. 1 uses 'WSLDist' in two places; this should be 'WLSDist'.
- [Section V, Server Log Dataset] The text says 'the labels are not available' and then immediately describes acquired manual annotations for the test set; please clarify that the algorithm is trained and validated without labels while the test set has manual annotations.
- [Section IV-C] The phrase 'unparameterizing Phi' is awkward; 'automatic fitting of the scoring parameters' would be clearer.
Circularity Check
No significant circularity: the LTI/AS recurrence is causal over time, the logistic fit cannot change AUC, and no load-bearing argument reduces to a self-citation.
full rationale
The paper's derivation chain is self-contained. The LTI metric (Eq. 6) is a weighted sum of WLSDist distances between actual local sequences and multi-source predictions; the only non-raw-data quantity entering it is the source-reliability weight P(i), which is instantiated as 1−AS(i) in Eq. 12. This is a causal recurrence (AS(t) depends only on AS(i) for i<t), not a circular definition, and it never uses test labels. Algorithm 1 fits k and x0 from the reference LTI distribution (k=c/stdev(LTI), x0=mean(LTI)); because Φ in Eq. 10 is strictly increasing in LTI, the anomaly-score ranking—and hence the reported AUC—is invariant to these fitted values, so the fitting cannot manufacture the headline comparison. The backbone model is a GRU augmented with Prophet seasonal terms; Prophet is cited as independent prior work and no central claim is justified by a self-citation. The main caveat, the privately annotated Server Log test set with 76 labels and no annotation protocol, is an external-validity threat to the largest reported AUC gain, not a circularity: it makes no equation equivalent to its inputs. I therefore find no significant circularity.
Assumptions & free parameters
free parameters (4)
- L =
5 to 20 recommended; 5 used for backbone evaluation
- k =
c/stdev(LTI) via Algorithm 1
- x0 =
mean(LTI) via Algorithm 1
- c =
not specified
assumptions (5)
- domain assumption Anomalous frames have minor impact on long-term periodic patterns, so Prophet-based decomposition remains trustworthy under contamination.
- domain assumption Prophet decomposition correctly separates trend, seasonality, holidays and noise for each channel (X = g+s+h+eps).
- domain assumption A GRU with truncated BPTT can learn a frame-to-sequence map that predicts the next L frames from one input frame.
- ad hoc to paper The iterative procedure in Algorithm 1 converges to a stable k and x0.
- domain assumption The manually annotated labels for the Server Log test set are accurate.
Cite this review
Pith. "Pith review of Developing an Unsupervised Real-time Anomaly Detection Scheme for Time Series with Multi-seasonality." pith.science (2026). https://pith.science/paper/2IRBHLNZ
@misc{pith2026190801146,
  author       = {Pith},
  title        = {Pith review of: Developing an Unsupervised Real-time Anomaly Detection Scheme for Time Series with Multi-seasonality},
  year         = {2026},
  howpublished = {\url{https://pith.science/paper/2IRBHLNZ}},
  note         = {Machine review of arXiv:1908.01146}
}
read the original abstract
On-line detection of anomalies in time series is a key technique used in various event-sensitive scenarios such as robotic system monitoring, smart sensor networks and data center security. However, the increasing diversity of data sources and the variety of demands make this task more challenging than ever. Firstly, the rapid increase in unlabeled data means supervised learning is becoming less suitable in many cases. Secondly, a large portion of time series data have complex seasonality features. Thirdly, on-line anomaly detection needs to be fast and reliable. In light of this, we have developed a prediction-driven, unsupervised anomaly detection scheme, which adopts a backbone model combining the decomposition and the inference of time series data. Further, we propose a novel metric, Local Trend Inconsistency (LTI), and an efficient detection algorithm that computes LTI in a real-time manner and scores each data point robustly in terms of its probability of being anomalous. We have conducted extensive experimentation to evaluate our algorithm with several datasets from both public repositories and production environments. The experimental results show that our scheme outperforms existing representative anomaly detection algorithms in terms of the commonly used metric, Area Under Curve (AUC), while achieving the desired efficiency.
Figures
Figures from the paper (6 more)


Forward citations
Cited by 1 Pith paper
-
Dive into Time-Series Anomaly Detection: A Decade Review
A survey of time-series anomaly detection that proposes a process-centric taxonomy and a meta-analysis of a decade of literature.
Reference graph
Works this paper leans on
-
[2]
Frisch, R., & Waugh, F. V . (1933). Partial time regressions as com- pared with individual trends. Econometrica: Journal of the Econometric Society, 387-401
work page 1933
-
[3]
Seiwell, H. R. (1949). The principles of time series analyses applied to ocean wave data. Proceedings of the National Academy of Sciences of the United States of America, 35(9), 518
work page 1949
-
[4]
Sch ¨olkopf, B., Williamson, R. C., Smola, A. J., Shawe-Taylor, J., & Platt, J. C. (2000). Support vector method for novelty detection. Proceedings of the 12th International Conference on Neural Information Processing Systems (NIPS’99), pp. 582-588
work page 2000
-
[5]
Zhang, R., Zhang, S., Lan, Y ., & Jiang, J. (2008). Network anomaly detection using one class support vector machine. In Proceedings of the International MultiConference of Engineers and Computer Scientists (V ol. 1)
work page 2008
-
[6]
Maglaras, L. A., & Jiang, J. (2014, August). Ocsvm model combined with k-means recursive clustering for intrusion detection in scada systems. In 10th International conference on heterogeneous networking for quality, reliability, security and robustness (pp. 133-134). IEEE
work page 2014
-
[7]
Shang, W., Zeng, P., Wan, M., Li, L., & An, P. (2016). Intrusion detection algorithm based on OCSVM in industrial control system. Security and Communication Networks, 9(10), 1040-1049
work page 2016
-
[8]
Liu, F. T., Ting, K. M., & Zhou, Z. H. (2012). Isolation-based anomaly detection. ACM Transactions on Knowledge Discovery from Data (TKDD), 6(1)
work page 2012
-
[9]
Radovanovi ´c, M., Nanopoulos, A., & Ivanovi ´c, M. (2014). Reverse nearest neighbors in unsupervised distance-based outlier detection. IEEE transactions on knowledge and data engineering, 27(5), 1369-1382
work page 2014
Show all 51 references
-
[10]
N., Ramamohanarao, K., Buyya, R., Leckie, C., & Versteeg, S
Calheiros, R. N., Ramamohanarao, K., Buyya, R., Leckie, C., & Versteeg, S. (2017). On the effectiveness of isolation-based anomaly detection in cloud data centers. Concurrency and Computation: Practice and Experience, 29(2017)e4169. doi: 10.1002/cpe.4169
2017 doi
-
[11]
K., & Mahoney, M
Chan, P. K., & Mahoney, M. V . (2005, November). Modeling multiple time series for anomaly detection. In Fifth IEEE International Confer- ence on Data Mining (ICDM’05) (pp. 8-pp). IEEE
2005
-
[12]
(2009, June)
Ye, L., & Keogh, E. (2009, June). Time series shapelets: a new primitive for data mining. In Proceedings of the 15th ACM SIGKDD international conference on Knowledge discovery and data mining (pp. 947-956). ACM
2009
-
[13]
(2012, December)
Zakaria, J., Mueen, A., & Keogh, E. (2012, December). Clustering time series using unsupervised-shapelets. In 2012 IEEE 12th International Conference on Data Mining (pp. 785-794). IEEE
2012
-
[14]
Yeh, C. C. M., Zhu, Y ., Ulanova, L., Begum, N., Ding, Y ., Dau, H. A., ... & Keogh, E. (2018). Time series joins, motifs, discords and shapelets: a unifying view that exploits the matrix profile. Data Mining and Knowledge Discovery, 32(1), 83-123
2018
-
[15]
T., & Zurada, J
Hou, L., Kwok, J. T., & Zurada, J. M. (2016, February). Efficient learning of time series shapelets. In 13th AAAI Conference on Artificial Intelligence
2016
-
[16]
Gu, Z., He, L., Chang, C., Sun, J., Chen, H., & Huang, C. (2017). Developing an efficient pattern discovery method for CPU utilizations of computers. International Journal of Parallel Programming, 45(4), 853- 878
2017
-
[17]
T., & He, L
Zhu, H., Gu, Z., Zhao, H., Chen, K., Li, C. T., & He, L. (2018). Developing a pattern discovery method in time series data and its GPU acceleration. Big Data Mining and Analytics, 1(4), 266-283
2018
-
[18]
N., Keogh, E
Wei, L., Kumar, N., Lolla, V . N., Keogh, E. J., Lonardi, S., & Chotirat (Ann) Ratanamahatana. (2005, June). Assumption-Free Anomaly Detec- tion in Time Series. In SSDBM (V ol. 5, pp. 237-242)
2005
-
[19]
Huang, T., Zhu, Y ., Wu, Y ., Bressan, S., & Dobbie, G. (2016). Anomaly detection and identification scheme for VM live migration in cloud infrastructure. Future Generation Computer Systems, 56, 736-745
2016
-
[20]
J., Wang, E., & Laptev, N
Hyndman, R. J., Wang, E., & Laptev, N. (2015, November). Large-scale unusual time series detection. In 2015 IEEE international conference on data mining workshop (ICDMW) (pp. 1616-1619). IEEE
2015
-
[21]
Li, J., Pedrycz, W., & Jamal, I. (2017). Multivariate time series anomaly detection: A framework of Hidden Markov Models. Applied Soft Com- puting, 60, 229-240
2017
-
[22]
Anomaly detection in ECG time signals via deep long short-term memory networks
Chauhan, Sucheta and Vig, Lovekesh. Anomaly detection in ECG time signals via deep long short-term memory networks. In Data Science and Advanced Analytics (DSAA), 2015. 36678 2015. IEEE International Conference on, pp. 1–7. IEEE, 2015
2015
-
[23]
Malhotra, P., Ramakrishnan, A., Anand, G., Vig, L., Agarwal, P., & Shroff, G. (2016). LSTM-based encoder-decoder for multi-sensor anomaly detection. arXiv preprint arXiv:1607.00148
2016 arXiv
-
[24]
Ahmad, S., Lavin, A., Purdy, S., & Agha, Z. (2017). Unsupervised real- time anomaly detection for streaming data. Neurocomputing, 262, 134- 147
2017
-
[25]
(2013, February)
Pascanu, R., Mikolov, T., & Bengio, Y . (2013, February). On the diffi- culty of training recurrent neural networks. In International conference on machine learning (pp. 1310-1318)
2013
-
[26]
Tang, X. (2019). Large-Scale Computing Systems Workload Prediction Using Parallel Improved LSTM Neural Network. IEEE Access, 7, 40525-40533
2019
-
[27]
Chen, S., Li, B., Cao, J., & Mao, B. (2018). Research on Agricultural Environment Prediction Based on Deep Learning. Procedia computer science, 139, 33-40
2018
-
[28]
& Peters, S
Harvey, A. & Peters, S. (1990), Estimation procedures for structural time series models, Journal of Forecasting, V ol. 9, 89-108
1990
-
[29]
J., & Letham, B
Taylor, S. J., & Letham, B. (2018). Forecasting at scale. The American Statistician, 72(1), 37-45
2018
-
[30]
and Ba, J
Kingma, D. and Ba, J. (2015) Adam: A Method for Stochastic Opti- mization. Proceedings of the 3rd International Conference on Learning Representations (ICLR 2015)
2015
-
[31]
& Vanderplas, J
Pedregosa, F., Varoquaux, G., Gramfort, A., Michel, V ., Thirion, B., Grisel, O., ... & Vanderplas, J. (2011). Scikit-learn: Machine learning in Python. Journal of machine learning research, 12(Oct), 2825-2830
2011
-
[32]
Vallis, O., Hochenbaum, J., & Kejariwal, A. (2014). A novel technique for long-term anomaly detection in the cloud. In 6th USENIX Workshop on Hot Topics in Cloud Computing (HotCloud 14)
2014
-
[33]
Filonov, A
P. Filonov, A. Lavrentyev, A. V orontsov, Multivariate Industrial Time Series with Cyber-Attack Simulation: Fault Detection Using an LSTM- based Predictive Data Model, NIPS Time Series Workshop 2016, Barcelona, Spain, 2016
2016
-
[34]
(2015, April)
Malhotra, P., Vig, L., Shroff, G., & Agarwal, P. (2015, April). Long short term memory networks for anomaly detection in time series. In Proceedings of European Symposium on Artificial Neural Networks, Computational Intelligence and Machine Learning (ESANN 15’), pp. 89-94
2015
-
[35]
Shi, H., Yang, J., Ding, M., & Wang, J. (2011). A short-term wind power prediction method based on wavelet decomposition and BP neural network. Automation of Electric Power Systems, 35(16), 44-48
2011
-
[36]
G., Koehler, A
Gould, P. G., Koehler, A. B., Ord, J. K., Snyder, R. D., Hyndman, R. J., & Vahid-Araghi, F. (2008). Forecasting time series with multiple seasonal patterns. European Journal of Operational Research, 191(1), 207-222
2008
-
[37]
M., Hyndman, R
De Livera, A. M., Hyndman, R. J., & Snyder, R. D. (2011). Forecasting time series with complex seasonal patterns using exponential smoothing. Journal of the American Statistical Association, 106(496), 1513-1527. THIS IS A PREPRINT VERSION OF THE WORK 10.1109/TKDE.2020.3035685 ...
2011
-
[38]
Hodge, V ., & Austin, J. (2004). A survey of outlier detection method- ologies. Artificial intelligence review, 22(2), 85-126
2004
-
[39]
& Van Hoecke, S
Janssens, O., Slavkovikj, V ., Vervisch, B., Stockman, K., Loccufier, M., Verstockt, S., ... & Van Hoecke, S. (2016). Convolutional neural network based fault detection for rotating machinery. Journal of Sound and Vibration, 377, 331-345
2016
-
[40]
Ince, T., Kiranyaz, S., Eren, L., Askar, M., & Gabbouj, M. (2016). Real- time motor fault detection by 1-D convolutional neural networks. IEEE Transactions on Industrial Electronics, 63(11), 7067-7075
2016
-
[41]
Sabokrou, M., Fayyaz, M., Fathy, M., Moayed, Z., & Klette, R. (2018). Deep-anomaly: Fully convolutional neural network for fast anomaly de- tection in crowded scenes. Computer Vision and Image Understanding, 172, 88-97
2018
-
[42]
Zheng, Y ., Liu, Q., Chen, E., Ge, Y ., & Zhao, J. L. (2014, June). Time series classification using multi-channels deep convolutional neural networks. In International Conference on Web-Age Information Man- agement (pp. 298-310). Springer, Cham
2014
-
[43]
J., & Rayner, P
Rajan, J. J., & Rayner, P. J. (1995). Unsupervised time series classifi- cation. Signal processing, 46(1), 57-74
1995
-
[44]
L ¨angkvist, M., Karlsson, L., & Loutfi, A. (2014). A review of unsu- pervised feature learning and deep learning for time-series modeling. Pattern Recognition Letters, 42, 11-24
2014
-
[45]
N., & Hu, J
Ahmed, M., Mahmood, A. N., & Hu, J. (2016). A survey of network anomaly detection techniques. Journal of Network and Computer Ap- plications, 60, 19-31
2016
-
[46]
Holt, C. C. (2004). Forecasting seasonals and trends by exponentially weighted moving averages. International journal of forecasting, 20(1), 5-10
2004
-
[47]
A., & Watts, J
Van De Geijn, R. A., & Watts, J. (1997). SUMMA: Scalable universal matrix multiplication algorithm. Concurrency: Practice and Experience, 9(4), 255-274
1997
-
[48]
Chen, J., Li, K., Deng, Q., Li, K., & Philip, S. Y . (2019). Distributed Deep Learning Model for Intelligent Video Surveillance Systems with Edge Computing. IEEE Transactions on Industrial Informatics
2019
-
[49]
A., Li, K., & Yu, P
Chen, J., Li, K., Bilal, K., Metwally, A. A., Li, K., & Yu, P. (2018). Parallel protein community detection in large-scale PPI networks based on multi-source learning. IEEE/ACM transactions on computational biology and bioinformatics
2018
-
[50]
Chen, J., Li, K., Bilal, K., Li, K., & Philip, S. Y . (2018). A bi- layered parallel training architecture for large-scale convolutional neural networks. IEEE transactions on parallel and distributed systems, 30(5), 965-976
2018
-
[51]
Duan, M., Li, K., Liao, X., & Li, K. (2017). A parallel multiclassifi- cation algorithm for big data using an extreme learning machine. IEEE transactions on neural networks and learning systems, 29(6), 2337-2351
2017
-
[52]
Chen, C., Li, K., Ouyang, A., Tang, Z., & Li, K. (2017). Gpu-accelerated parallel hierarchical extreme learning machine on flink for big data. IEEE Transactions on Systems, Man, and Cybernetics: Systems, 47(10), 2740-2753
2017
Reviewed August 14, 2026 · model on record in the stance chip above.
Discussion (0). Continue with ORCID to comment.