REVIEW 4 major objections 4 minor 3 references
Three-dimensional Near-field Analysis Through Peak Force Scattering-type Near-field Optical Microscopy
T0 review · 4 major / 4 minor · reviewed 2026-08-14 · deepseek-v4-flash
Pith's one-line read A round h-11BN disk locks polariton momentum to discrete values, and the tip-sample distance fine-tunes it between resonances.
desk verdict PF-SNOM delivers real 3D near-field data and a plausible momentum-quantization story, but the Bessel-mode assignment is fit to the same three resonances, so treat the specific (s,n) labels as tentative. read the letter →
The pith
A machine-rendered reading of the paper's core claim, the machinery that carries it, and where it could break.
The reading
What carries the argument
The central object is the 3D near-field response cube $S_{\mathrm{NF}}(x,y,d)$, assembled from vertical near-field interaction curves collected by PF-SNOM at every lateral point; it supplies tomographic images at fixed $d$ and sectional images at fixed $x$ or $y$. The quantization argument rests on the standing-wave solution $\rho = J_s(k_{sn}r+\phi)(A\cos(s\theta)+B\sin(s\theta))e^{i\omega t}$, with resonant spatial frequencies fixed by $J'_s(k_{sn}r_0+\phi)=0$, where $\phi=-0.28\pi$ is the anomalous edge phase shift and $(s,n)$ are mode indices. The tip-sample distance $d$ acts as a controllable momentum filter: small $d$ couples strongly to high spatial frequencies, large $d$ to low spatial frequencies, which explains both the $d$-dependent dispersion and the mode-superposition behavior between resonances.
What would settle it
Measure h-11BN microdisks with deliberately different radii and check whether every resonant frequency and locked momentum obeys $J'_s(k_{sn}r_0-0.28\pi)=0$ with the same phase shift and no refitting; a single resonance off the predicted ladder would falsify the quantization claim.
Extended reading notes
Core claim
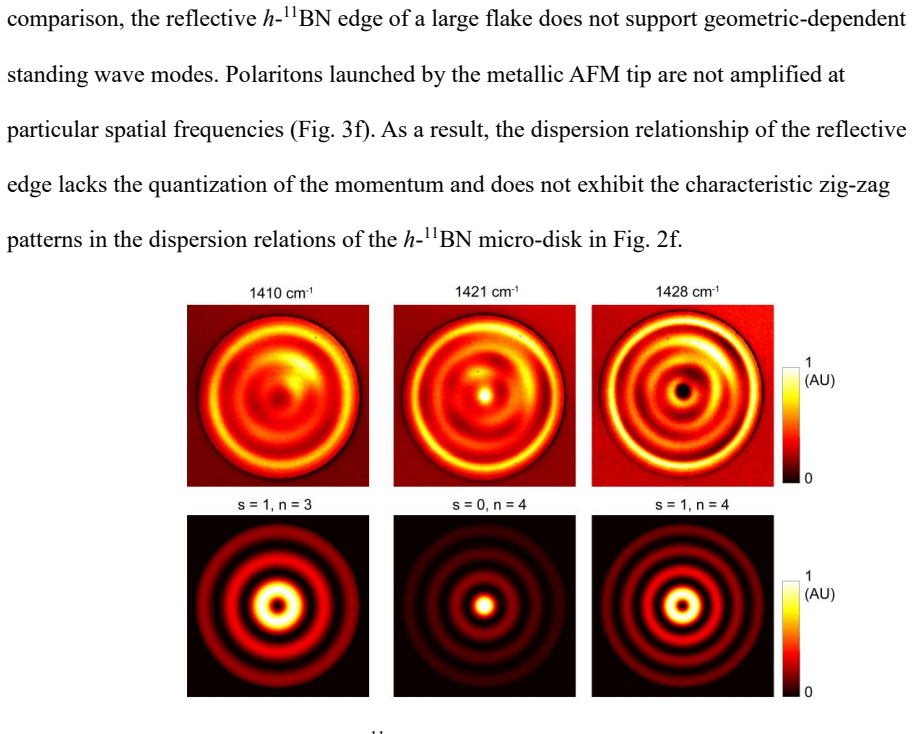
The central claim is that the circular boundary of an h-11BN microdisk quantizes the in-plane momentum of hyperbolic phonon polaritons: at resonant frequencies of 1410, 1421, and 1428 $\mathrm{cm}^{-1}$, the measured polariton momentum $q_p$ stays locked at $2.11$, $2.48$, and $2.84\ \mu\mathrm{m}^{-1}$ regardless of tip-sample distance, and these values coincide with the roots $k_{sn}$ of $J'_s(k_{sn}r_0+\phi)=0$ with $\phi=-0.28\pi$. At non-resonant frequencies the momentum is not locked; instead larger tip-sample separation produces lower spatial frequency, because a more distant tip supports a more loosely confined, lower-momentum field. The vertical dimension of the data cube also distinguishes the two regimes: at resonance the near-field signal grows monotonically as the tip approaches the surface, while between resonances the center of the disk develops a dip caused by destructive interference between two adjacent standing-wave modes. The paper presents the same analysis on an h-11BN flake edge to show that without circular confinement the momentum is continuously tunable and no discrete resonances appear.
Load-bearing premise
The momentum-quantization claim rests on fitting the edge phase shift to $-0.28\pi$ and then assigning whole-number mode labels to the observed resonances; if those fitting choices are wrong, the locked momenta could be a coincidence rather than true geometric resonances.
Editorial extensions
If this is right
- PF-SNOM can map the vertical decay of near fields over less than 20 nm, providing a direct check of near-field models rather than a single lateral image.
- Circular h-11BN resonators can be used as in situ momentum filters that select polaritons with discrete momenta when integrated into heterostructures.
- At the 1420 $\mathrm{cm}^{-1}$ resonance, the disk center concentrates near-field intensity into a roughly 500 nm hotspot, a location usable for mid-infrared chemical sensing or nonlinear mixing.
- The same 3D tomography should reveal geometric resonances in other polaritonic and plasmonic microstructures, since PF-SNOM and s-SNOM share the same scattering mechanism.
Reading between the lines
- If the quantization is genuine, a disk of different radius should show resonances at frequencies predicted by the same Bessel condition with unchanged phase shift; a systematic radius series would separate true geometry quantization from coincidence.
- The fitted effective substrate permittivity $\varepsilon_s=2.05$ could be tested by measuring the same disk on substrates with different oxide thickness or on a metal backplane, which should shift the non-resonant dispersion but not the locked resonant momenta.
- The vertical dip between resonances implies that conventional tapping-mode s-SNOM, which averages over a range of tip-sample distances, partially washes out the mode-superposition signature; PF-SNOM's distance-resolved data could be used to deconvolve that averaging.
- Because the Bessel modes alternate between bright and dark centers with $s=0$ and $s=1$, the vertical interaction curve at the disk center may serve as a fast readout of the mode order without full imaging.
Signed reviews
Editorial analysis
A structured set of objections, weighed in public.
Referee Report
Summary. The manuscript presents a PF-SNOM (peak force scattering-type near-field optical microscopy) method that records a 3D near-field response cube with explicit tip-sample distance dependence, and applies it to an isotopically pure h-11BN microdisk and to an h-11BN edge. The central experimental claims are: (i) the polariton momentum in the circular microdisk takes fixed, frequency-specific values over a small range of infrared frequencies, independent of tip-sample distance, while between these values the momentum can be tuned by the tip-sample distance; (ii) these fixed momenta are identified with the roots k_sn of the Bessel standing-wave condition J_s'(k_sn r0 + phi)=0, corresponding to geometrically quantized polariton modes; and (iii) the edge structure, lacking circular confinement, does not show such quantization but does show distance-dependent momentum tuning. The paper includes tomographic images, extracted dispersion relations, comparison with a second microdisk, simulations of J_s^2 fringe patterns, and vertical sectional analysis that shows a center dip interpreted as destructive interference between adjacent Bessel modes at non-resonant frequencies.
Significance. If the central quantization claim is validated, the work is significant for two reasons. First, it demonstrates a new measurement capability: PF-SNOM provides a 3D near-field cube with explicit tip-sample distance resolution, which standard s-SNOM cannot deliver; this is a genuine methodological advance and is convincingly supported by the data. Second, it reports a potentially important physical observation: circular confinement of hyperbolic phonon polaritons appears to produce discrete, d-independent momentum plateaus, in contrast to the continuous d-dependent momentum in an unstructured edge. The experimental observation of d-independent momenta is reproducible (a second disk shows the same locking behavior), and the vertical sectional analysis provides a novel way to visualize mode superposition. However, the identification of the plateaus with specific Bessel modes (s,n) relies on a fitting procedure in which the phase phi is fitted to the same data and mode numbers are assigned post hoc, with no error bars for the extracted momenta. This circularity weakens the central quantitative claim and must be addressed before the quantization is established.
major comments (4)
- [Supplementary Note 1, Table S1] The assignment of the three d-independent momenta to specific (s,n) Bessel modes is post hoc: the procedure reads q_p from the experimental images, solves Eq. S4 for k_sn, and then assigns (s,n) if the values match, with phi = -0.28π chosen as the best fit on these same data. With only three resonances and no stated uncertainty on q_p (or on the FFT peak position), the agreement (residuals of 0.03-0.06 μm^-1) does not distinguish the quantization hypothesis from a three-point fit. Please provide the uncertainty on each q_p, list all k_sn in the investigated q_p range, and include at least one predictive check with fixed parameters, such as using the phi and r0 from one disk to predict the resonance frequencies of the second disk in Supplementary Fig. S3 or a leave-one-out test on the three observed resonances.
- [Main text Eq. (1) and Supplementary Note 1] The anomalous phase phi is introduced as a fitting parameter in the quantization condition J_s'(k_sn r0 + phi)=0, yet in the fringe-pattern simulation (Eq. S5) the phase is omitted 'to achieve optimal agreement between simulated fringes and PF-SNOM fringes.' This dual role is internally inconsistent: if phi is a physical edge correction it should appear in both the eigencondition and the simulated spatial pattern; if it is only a fitting knob, its use in the quantization condition is not independently constrained. Please clarify how phi is determined, whether it is transferred between the two uses, and how the assigned (s,n) change over the plausible range of phi.
- [Methods, Dispersion relation simulation] The dispersion curves in Figs. 2e-f are computed using an effective substrate permittivity epsilon_s = 2.05 that is explicitly chosen to match the experimental results, and the justification (a heterogeneous SiO2/Si substrate) does not pin down this value. Consequently the overlay of experimental data and the brown dispersion curve in Figs. 2e-f is not a parameter-free comparison. This does not invalidate the measured plateaus themselves, but the figure should clearly state that epsilon_s is a fitted parameter, and the sensitivity of the comparison to the plausible range of epsilon_s (1.2 to 11.7) should be shown.
- [Main text, Fig. 5d and related discussion] The interpretation of the center dip in the vertical interaction curve at 1425 cm^-1 as destructive interference between the (0,4) and (1,4) Bessel modes (arising from alternating s between adjacent resonances) depends directly on the correctness of the mode assignments in Table S1. Because those assignments are not independently established (see first major comment), this physical interpretation is also not yet fully supported. A quantitative simulation of the expected vertical profile near the center, using the superposition of the assigned modes with distance-dependent coupling weights, would strengthen the argument.
minor comments (4)
- [Supplementary Fig. S4 caption] The caption states that at non-resonant conditions 'q_p increases as d increases,' but panel (a) shows the fringe wavelength lambda_f increasing with d, which implies q_p = pi/lambda_f decreases with d; this is also consistent with the main-text statement that larger d gives lower spatial frequency. Please correct this typo.
- [Introduction, abstract] The abbreviation 'h-11BN' is used without a definition at first occurrence; please define it (isotopically pure hexagonal boron nitride with boron-11) when it is introduced.
- [Methods, PF-SNOM setup] The text says the AFM is operated with a peak force tapping frequency of 4 kHz and a peak-to-peak sample oscillation amplitude of 300 nm; it would be helpful to specify the cantilever stiffness and the oscillation amplitude at the tip (or at least the typical peak force setpoint) for reproducibility.
- [Supplementary Note 1] In the derivation, the Neumann boundary condition is applied at r = r0 without including the phase phi; the phase is then added to the argument of the Bessel function. This is a nonstandard step that deserves a more explicit justification, even when citing Ref. 29; a reader should be able to see why the same boundary condition is not applied to the phi-shifted argument.
Circularity Check
The quantization claim rests on parameters fitted to the same resonances and post hoc (s,n) assignment; the core observation is real but the Bessel-mode identification is partly calibrated.
-
fitted input called prediction
[Methods, Dispersion relation simulation; Eq. (3)]
"The Si substrate used in this study generally has a 285 nm thick thermal oxide layer on top of the Si. ... This heterogeneous nature of substrate determines that we cannot simply use the permittivity of SiO2. Therefore, we used a modified εs = 2.05 (between 1.2 and 11.7) to match experimental results, which is consistent for additional data from another BN micro disk in supplementary Fig. 3."
The brown dispersion curves in Figs. 2e-f, which are intersected with the calculated k_sn values to mark the three resonant conditions, are computed using Eq. (3) with εs chosen specifically to match the experimental dispersion data. Therefore the apparent agreement between the calculated resonant frequencies/k_sn and the observed fixed momenta is partly the result of calibration, not an independent prediction. The second disk provides consistency, but the parameter was set to fit the data it later explains.
-
fitted input called prediction
[Formation of Geometric Resonances, Eq. (1); Supplementary Note 1, Eq. (S4)]
"where JS is the Bessel function of sth order, r0 is the disk radius, ksn is the nth root to Equation (1) and the spatial frequencies of the standing wave, n = 1, 2, 3…and φ0 is the anomalous phase shift at the edge, which is found to be -0.28 π from fitting."
Equation (1), J_s'(k_sn r0 + φ) = 0, defines the predicted discrete spatial frequencies k_sn that are later compared with the experimental q_p. But the phase φ entering this equation is not obtained independently: the paper states it was found 'from fitting' and Supplementary Note 1 says φ = −0.28π 'best fit our experimental results'. Since φ shifts all Bessel roots, the k_sn values in Table S1 are adjusted toward the data, so the quoted residuals of 0.03–0.06 μm^-1 are partly a measure of the fit quality, not a test of an unadjusted prediction.
1 more flagged steps
-
self definitional
[Supplementary Note 1, workflow steps 1–3 and Table S1]
"To assign a proper (s, n) pair to each resonant condition, we compare k_sn with q_p from FFT on PF-SNOM images at resonant conditions. ... 3. Compare k_sn with q_p and ρ2 with experimental fringe patterns. If they match, assign corresponding mode numbers (s, n) to this resonant frequency."
The central claim is that the three fixed experimental momenta are aligned with the discrete roots k_sn. But the alignment is established by first reading q_p from the same images, then computing k_sn from Eq. (S4), and then choosing the mode labels (s,n) that make k_sn match q_p. Because the Bessel-root spectrum is rich and the labels are assigned post hoc, the match in Table S1 (q_p = 2.11, 2.48, 2.84 μm^-1 versus k_sn = 2.08, 2.44, 2.78 μm^-1) is a selection, not a blind prediction. The alternating s=0/1 center bright/dark behavior is an independent check, but it does not uniquely determine the (s,n) assignment.
full rationale
The experimental observation that the micro-disk exhibits d-independent polariton momenta at certain frequencies, while the reflective edge does not, is a real and self-contained result. However, the central interpretive step—identifying the locked momenta with the standing-wave roots J_s'(k_sn r0 + φ) = 0—is not executed as a blind first-principles prediction: the phase φ is fitted to the data, the substrate permittivity εs is chosen to make the dispersion curve match, and the (s,n) labels are assigned by comparing computed k_sn with measured q_p. Table S1 then presents small residuals as agreement, but the freedom in φ, εs, and mode labels over a dense root spectrum can absorb those residuals. The second disk and the alternating s=0/1 center behavior provide some independent support, so the paper is not wholly circular, but the central quantization claim is partially fit rather than fully predictive.
Assumptions & free parameters
free parameters (3)
- anomalous phase shift phi =
-0.28 pi
- effective substrate permittivity epsilon_s =
2.05
- mode number assignment (s,n) =
(1,3), (0,4), (1,4)
assumptions (5)
- domain assumption Polariton propagation on the h-BN disk is described by the 2D wave equation (S1) with Neumann boundary condition (S2).
- domain assumption The PF-SNOM scattering signal is proportional to the roundtrip component rho^2 = J_s^2(k_sn r) (Eq. S5).
- domain assumption The h-11BN dielectric function parameters in Table 1 (from Giles et al.) are accurate for the measured samples.
- domain assumption Linear far-field background subtraction and the mapping of piezo extension to tip-sample distance correctly isolate the near-field signal.
- domain assumption The dispersion relation Eq. (3) for the air/h-BN/SiO2 multilayer is valid for the measured sample geometry.
Cite this review
Pith. "Pith review of Three-dimensional Near-field Analysis Through Peak Force Scattering-type Near-field Optical Microscopy." pith.science (2026). https://pith.science/paper/2LSXJFBP
@misc{pith2026190805230,
  author       = {Pith},
  title        = {Pith review of: Three-dimensional Near-field Analysis Through Peak Force Scattering-type Near-field Optical Microscopy},
  year         = {2026},
  howpublished = {\url{https://pith.science/paper/2LSXJFBP}},
  note         = {Machine review of arXiv:1908.05230}
}
read the original abstract
Scattering-type scanning near-field optical microscopy (s-SNOM) is instrumental in exploring polaritonic behaviors of two-dimensional (2D) materials at the nanoscale. A sharp s-SNOM tip couples momenta into 2D materials through phase matching to excite phonon polaritons, which manifest as nanoscale interference fringes in raster images. However, s-SNOM lacks the ability to detect the progression of near-field property along the perpendicular axis to the surface. Here, we perform near-field analysis of a micro-disk and a reflective edge made of isotopically pure hexagonal boron nitride (h-11BN), by using three-dimensional near-field response cubes obtained by peak force scattering-type near-field optical microscopy (PF-SNOM). Momentum quantization of polaritons from the confinement of the circular structure is revealed in situ. Moreover, tip-sample distance is found to be capable of fine-tuning the momentum of polaritons and modifying the superposition of quantized polaritonic modes. The PF-SNOM-based three-dimensional near-field analysis provides detailed characterization capability with a high spatial resolution to fully map three-dimensional near-fields of nano-photonics and polaritonic structures.
Figures


Figures from the paper (1 more)

Reference graph
Works this paper leans on
-
[1]
M. Tamagnone, A. Ambrosio, K. Chaudhary, L. A. Jauregui, P. Kim, W. L. Wilson and F. Capasso, Science Advances, 2018, 4, eaat7189
work page 2018
-
[2]
A. J. Giles, S. Dai, O. J. Glembocki, A. V . Kretinin, Z. Sun, C. T. Ellis, J. G. Tischler, T. Taniguchi, K. Watanabe and M. M. Fogler, Nano letters, 2016, 16, 3858-3865
work page 2016
-
[3]
A. Y . Nikitin, T. Low and L. Martin-Moreno, Physical Review B, 2014, 90, 041407
work page 2014
Reviewed August 14, 2026 · model on record in the stance chip above.
Discussion (0). Continue with ORCID to comment.