REVIEW 3 major objections 6 minor 13 references
Coconut Palm Tree Counting on Drone Images with Deep Object Detection and Synthetic Training Data
T0 review · 3 major / 6 minor · reviewed 2026-08-11 · deepseek-v4-flash
Pith's one-line read Training a YOLOv7 object detector on synthetic images composed of palm cutouts on AI-generated backgrounds can count coconut palms in real Ghanaian drone footage at a mean average precision of 0.88, up from 0.65, enough for farm planning.
desk verdict Useful applied YOLO paper with an overstated headline number—the 0.88 is a selected max, not an average. read the letter →
The pith
A machine-rendered reading of the paper's core claim, the machinery that carries it, and where it could break.
The reading
What carries the argument
The load-bearing mechanism is a custom Python data generator that assembles synthetic training and validation images. It randomly picks an AI-generated background, randomly rotates, resizes, and flips plant cutouts extracted from 13 drone images, places them without overlap, and writes YOLO-format label files automatically. This turns a handful of manually curated cutouts into thousands of labeled images, which is what lets the pretrained YOLOv7 detector be fine-tuned despite the absence of a large real labeled set. The same generator makes controlled variations, such as background color, number of palms per image, and training versus validation count ranges, that drive the paper's ablation experiments.
What would settle it
Take the same synthetic-only pipeline, train it on one farm's cutouts, and test it on drone images from a second coconut farm with different soil, season, or planting layout. If mAP@0.5 drops well below 0.88 and counts drift from ground truth, the reported result is specific to this farm's visual conditions rather than a general synthetic-training effect.
Extended reading notes
Core claim
The central claim is that a detector trained only on synthetic composites can generalize to real drone imagery, provided the synthetic images mimic the relevant ground appearance. The winning recipe was a green background resembling actual Ghanaian grass, four object classes (coconut palms, okra plants, weeds, and tree trunks), 300 training images with 5 to 15 palms each, and a YOLOv7 model pretrained on a general object-detection dataset and fine-tuned for 40 epochs. Adding the non-palm classes improved palm discrimination by giving the model explicit alternatives, and freezing the first 0 to 10 layers did not hurt performance. The paper reports mAP@0.5 of 0.88, with counts that it says suffice for farm management.
Load-bearing premise
The load-bearing premise is that synthetic images, plant cutouts pasted onto AI-generated backgrounds, are representative enough of real drone footage taken at other times and altitudes that a detector trained only on them will keep working on real images, a premise the paper itself hedges by noting the altitude test used just three images.
Editorial extensions
If this is right
- A farm can obtain a palm count without labeling every drone image; only a small set of cutouts and backgrounds are needed to generate training data.
- Adding frequently confused plants as extra classes reduces false positives for the target class, so similar mistakes in other counting tasks may be fixable the same way.
- Background choice matters: a green background resembling real ground beat red laterite and mixed backgrounds, implying synthetic generation should mimic the target terrain.
- Counting accuracy at 0.88 mAP@0.5 is reported as sufficient for operational planning, so the method is positioned as a practical alternative to manual surveys.
- The best results used 300 training images with 5 to 15 palms per image, a density closer to the test footage, so matching synthetic density to expected real density appears to improve counts.
Reading between the lines
- Editorial extension: the same cutout-and-generator recipe could transfer to other tree crops with similar crown structure, such as oil palm or citrus, if the background pool is regenerated to match the new terrain.
- Editorial extension: the reported 199 detections against 187 labeled palms implies the detector is not simply matching ground truth—it is finding some palms the labelers missed while presumably missing others—so the practical count error may differ from what mAP alone suggests.
- Editorial extension: because no real-image training baseline is reported, the marginal benefit of synthetic data versus ordinary augmentation of the 73 real images is not yet isolated; a direct comparison would be the natural next test.
- Editorial extension: the paper's hint at plant health assessment could be tested by labeling cutouts with health status and asking whether the same synthetic pipeline separates healthy from stressed palms.
Signed reviews
Editorial analysis
A structured set of objections, weighed in public.
Referee Report
Summary. The paper addresses counting coconut palm trees in drone imagery from a Ghanaian farm. Because labeled data are scarce, the authors generate synthetic training images by compositing plant cutouts onto DALL-E/stable-diffusion backgrounds, then fine-tune YOLOv7. They report that mAP@.5 rose from 0.65 to 0.88, with the final model detecting 199 palms against 187 ground-truth palms. A sequence of experiments varies background color, object classes, training-image count, test altitude, palms-per-image, train/validation palm ranges, and layer freezing, with all final evaluations on held-out real drone images at 25 m.
Significance. If confirmed, the result is practically valuable: it suggests that synthetic-only training can reduce labeling effort for a real agricultural counting task, and the finding that adding confusable plant classes improves palm detection is a useful, non-obvious insight. The evaluation is not circular: the test images are real and distinct from the synthetic training images, and the paper explicitly acknowledges variability in mAP and the need for further testing. However, the headline 0.88 is a selected maximum over many configurations on a single small test set (38 images, 187 palms at 25 m), with no per-run statistics, so the magnitude of the claimed improvement is not yet statistically established.
major comments (3)
- [§4.9 and Table 7] The headline claim that mAP@.5 rose from 0.65 to "an average of 0.88" is not supported by the reported data. Table 7 lists the final configuration as min 0.75 / max 0.88, and Section 4.2 states that models were tested three times to account for variability, but no per-run values, means, or confidence intervals are given for any configuration. Because 0.88 is the maximum over a sequential search over background color, class set, training-image count, palms-per-image range, train/validation ranges, and freezing (Sections 4.2-4.8), all evaluated on the same 38-image, 187-palm test set, the reported improvement is likely inflated by selection. Please report mean ± standard deviation over repeated evaluations for every configuration and, ideally, evaluate the final model on a separate held-out set or with cross-validation.
- [§4.8 and §4.9] The supporting claim that "199 were detected out of 187 labelled" with "minimal false positives" is a raw detection count, not an IoU-matched precision/recall result. A model can output 199 boxes while mislocalizing trees or double-counting, so this sentence cannot substitute for AP/mAP. The conclusion should either report the standard COCO metrics for the final model or clearly state the matching criterion and the per-image counting error.
- [§3.2 and §4.5] The claim that synthetic-only training is sufficient is not yet supported by a domain-shift analysis. The synthetic images are built from cutouts of 13 images from the same farm, and no comparison is made between synthetic and real image statistics (e.g., object scale, background texture, illumination, sensor noise). In addition, all configurations in Table 7 are trained on synthetic images, so the improvement is relative to a synthetic-data baseline and does not by itself establish that synthetic data is superior to real labeled data. A concrete test would be to evaluate the final model on images from another farm, date, or drone, or at least to quantify the distribution overlap between synthetic and real inputs.
minor comments (6)
- [§4.8] The text refers to "section 2.4" for the YOLOv7 architecture, but the architecture is described in Section 2.3; update the cross-reference.
- [§3.3] The displayed mAP formula is malformed ("1 n k=n ∑ k=1 APk"); it should read (1/n) Σ_{k=1}^n AP_k.
- [§4.2 and Table 1] The text alternately says backgrounds were created with "stable diffusion" and with "DALL-E"; clarify the actual generation pipeline.
- [Table 7 and §4.8] The Freeze column entries "none.", "0-10", and the text's "fixing the first 5 and 11 layers" are inconsistent; specify the exact number of frozen layers for each row.
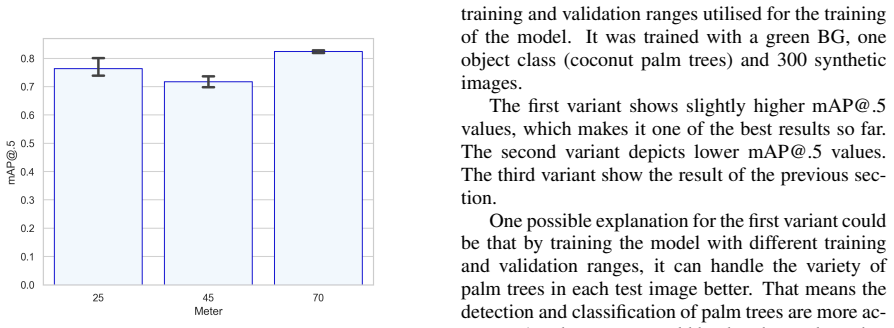
- [§4.5 and Table 4] The claim that 70 m is the optimal altitude is based on only three test images with 66 palms; this limitation is stated in the text, but the figure and table should also flag the small sample.
- [§4.4 and Figure 6] The training-image-count experiment reports no numeric mAP values; add a table or state the values in the text.
Circularity Check
No circularity: the central mAP result is measured on held-out real drone images, and no load-bearing self-citations or definitional equivalences are present.
full rationale
The paper's derivation chain is not circular. Synthetic training images are generated from plant cutouts taken from 13 selected drone images, while the test set consists of the remaining authentic drone images (Section 3.1: 'We based this on 13 selected drone images, keeping the remaining images for model testing'). The reported mAP@.5 of 0.88 is therefore obtained on distinct held-out real footage, not on the synthetic training distribution or on images used to construct the synthetic training data. The comparison between the baseline 0.65 and the final 0.88 is an empirical benchmark on the same held-out test set, not a quantity defined in terms of the training labels or the synthetic generator's parameters. There are no self-citations, no imported uniqueness theorems, and no ansatz smuggled in through prior work by the same authors; all cited works are external tutorials and background references. The paper also explicitly acknowledges variability in mAP results and the need for further testing (Section 4.9), which further indicates that the result is treated as an experimental finding rather than a derivation. The main methodological weakness is that hyperparameters were selected by repeatedly evaluating on the same 187-palm test set and the best configuration was then reported, which is a statistical selection-bias concern, but this is not circularity: the reported metric still measures performance on data not used for training. No step in the paper reduces to its own inputs by definition, so the circularity score is 0.
Assumptions & free parameters
free parameters (6)
- Background color/prompt =
green (DALL-E prompt: 'vertical aerial drone picture of ghana farm grass')
- Number of object classes =
4 (palm, okra, weeds, tree trunks)
- Training image count =
300
- Palms per training image range =
5-15
- Freeze layers =
0-10
- Confidence threshold =
0.6 (and 0.71 for one run)
assumptions (4)
- domain assumption Synthetic images (plant cutouts on DALL-E backgrounds) are representative enough of real drone imagery for training YOLOv7 to generalize to real test images.
- domain assumption The test set (38 images at 25m with 187 palms) is representative of the farm's palm population and distribution.
- domain assumption mAP@.5 is an appropriate proxy for counting accuracy.
- domain assumption YOLOv7 pretrained on COCO provides a useful starting point for palm detection.
Cite this review
Pith. "Pith review of Coconut Palm Tree Counting on Drone Images with Deep Object Detection and Synthetic Training Data." pith.science (2026). https://pith.science/paper/32Z2ONQB
@misc{pith2026241211949,
  author       = {Pith},
  title        = {Pith review of: Coconut Palm Tree Counting on Drone Images with Deep Object Detection and Synthetic Training Data},
  year         = {2026},
  howpublished = {\url{https://pith.science/paper/32Z2ONQB}},
  note         = {Machine review of arXiv:2412.11949}
}
abstract
Drones have revolutionized various domains, including agriculture. Recent advances in deep learning have propelled among other things object detection in computer vision. This study utilized YOLO, a real-time object detector, to identify and count coconut palm trees in Ghanaian farm drone footage. The farm presented has lost track of its trees due to different planting phases. While manual counting would be very tedious and error-prone, accurately determining the number of trees is crucial for efficient planning and management of agricultural processes, especially for optimizing yields and predicting production. We assessed YOLO for palm detection within a semi-automated framework, evaluated accuracy augmentations, and pondered its potential for farmers. Data was captured in September 2022 via drones. To optimize YOLO with scarce data, synthetic images were created for model training and validation. The YOLOv7 model, pretrained on the COCO dataset (excluding coconut palms), was adapted using tailored data. Trees from footage were repositioned on synthetic images, with testing on distinct authentic images. In our experiments, we adjusted hyperparameters, improving YOLO's mean average precision (mAP). We also tested various altitudes to determine the best drone height. From an initial mAP@.5 of $0.65$, we achieved 0.88, highlighting the value of synthetic images in agricultural scenarios.
Figures


Figures from the paper (5 more)




Reference graph
Works this paper leans on
-
[1]
write newline
" write newline "" before.all 'output.state := FUNCTION fin.entry add.period write newline FUNCTION new.block output.state before.all = 'skip after.block 'output.state := if FUNCTION new.sentence output.state after.block = 'skip output.state before.all = 'skip after.sentence 'output.state := if if FUNCTION not #0 #1 if FUNCTION and 'skip pop #0 if FUNCTIO...
-
[2]
Anwer, A. (2022). What is average precision in object detection and localization algorithms and how to calculate it?
work page 2022
-
[3]
Glassner, A. (2021). Deep Learning: A Visual Approach . No Starch Press, San Francisco, California, 1st edition
work page 2021
-
[4]
Goodfellow I., Bengio Y., C. A. (2016). Deep Learning (Adaptive Computation and Machine Learning series) . The MIT Press, Cambridge, Massachusetts, 1st edition
work page 2016
-
[5]
Khandelwal, R. (2020). Tensorflow object detection api
work page 2020
-
[6]
Kukil and Rath, S. (2022). Yolov7 object detection paper explanation and inference
work page 2022
-
[7]
Nair, A. (2022). Baseline models: Your guide for model building
work page 2022
-
[8]
Prince, S. J. (2023). Understanding Deep Learning . MIT Press, Cambridge, Massachusetts
work page 2023
Show all 13 references
-
[9]
Redmon, J., Divvala, S., Girshick, R., and Farhadi, A. (2016). You only look once: Unified, real-time object detection. In Proceedings of the IEEE conference on computer vision and pattern recognition , pages 779--788
2016
-
[10]
Sevarac, Z. (2021). How to get started with deep learning in java
2021
-
[11]
Shah, D. (2022). Mean average precision (map) explained: Everything you need to know
2022
-
[12]
Skelton, J. (2022). Step-by-step instructions for training yolov7 on a custom dataset
2022
-
[13]
Szeliski, R. (2022). Computer Vision: Algorithms and Applications . Springer, Cham, Switzerland, 2nd edition
2022
Reviewed August 11, 2026 · model on record in the stance chip above.
Discussion (0). Continue with ORCID to comment.